



Dashboard
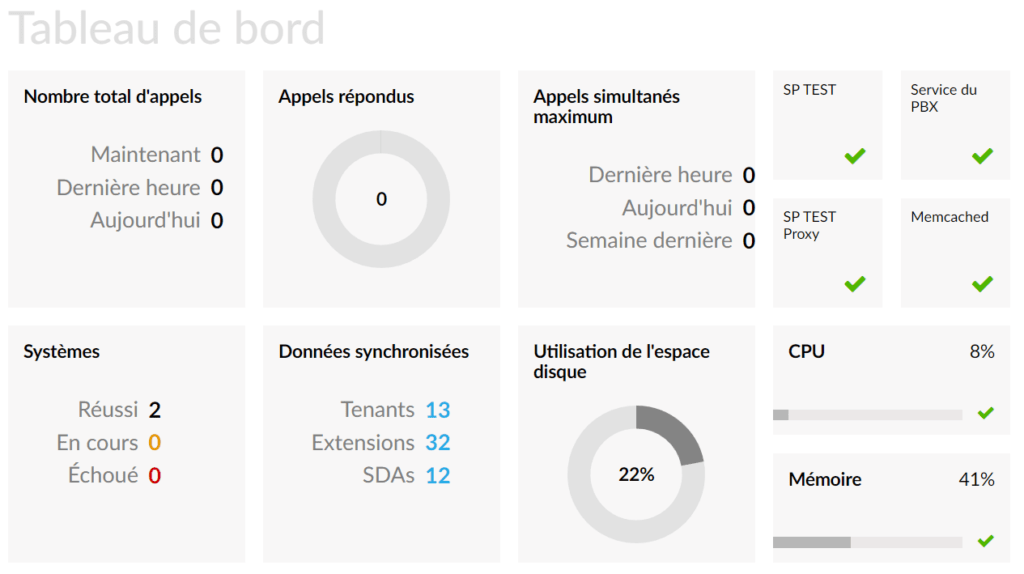
The PBXware system dashboard provides a single-page overview of important PBXware information and statistics in real time. On this page, you can see information about running services, call statistics, licenses and application usage, as well as information about the hardware status.
Calls overview
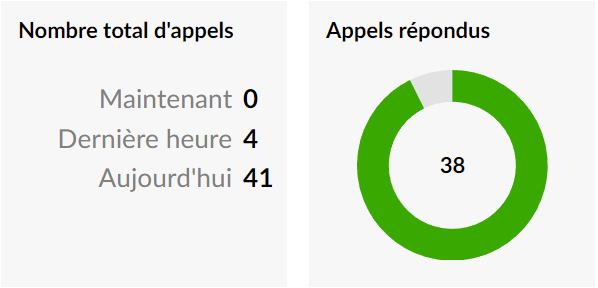
The call overview section displays information about the number of live calls on PBXware as well as the number of calls during the last hour, the number of calls made during the current day as well as answered calls, displayed in a circle that represents the percentage of answered calls relative to the total number of calls.
- Now
Number of calls in progress on PBXware.
- Last time
Number of PBXware calls over the last few hours.
- Today
Number of calls for the current day.
- Answered calls
Number of answered calls displayed as a percentage.
PBXware Services
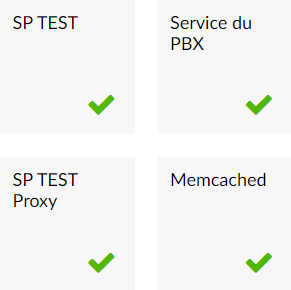
The Services section of the PBXware dashboard allows you to monitor the current status of the main system services: PBXware, PBX Service, Proxy, and Memcached. If a green checkmark is displayed, the service is running without issues; otherwise, a red cross will inform you that there are problems with the service and that it has been stopped.
- PBXware
This represents the main PBXware service. If the PBXware service stops for any reason, you will not be able to access your system through the web interface.
- PBX service
The PBX service is the main service on which PBXware runs. If the PBX service is not running, you will be able to access the PBXware web interface, but you will not be able to make or receive calls.
- PBXware Proxy
The PBXware proxy connects to the Asterisk manager and reads the events, which are then placed in Memcached for later use. Based on this data, the monitoring section will provide the information that users are interested in.
- Memcached
The Memcached service stores the information read by PBXware Proxy.
Synchronized data
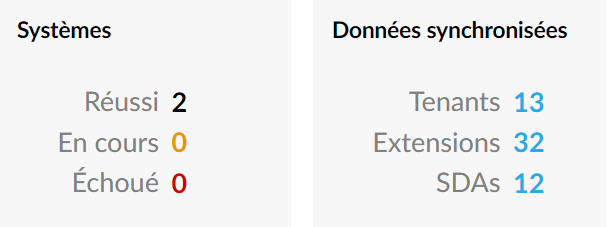
The systems section shows the number of PBXware systems synchronized on the SP.
Hardware resource usage
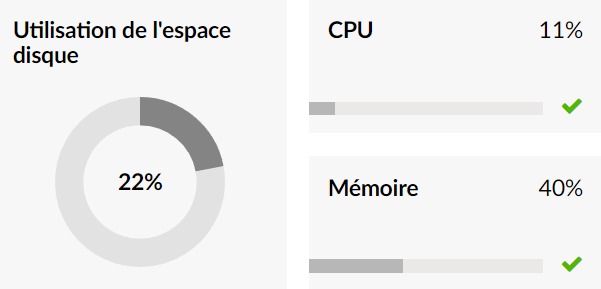
The Hardware Usage section displays important information about the current server load; it helps you easily monitor the main hardware components such as disk space, CPU usage, and memory.
- Disk usage
The Disk Usage section displays information about the current PBXware hard drive usage.
- CPU
The CPU section displays information about the current processor usage on the PBXware server.
- Memory
The Memory section displays information about the current PBXware memory usage.
