



Site monitoring
Site monitoring allows the SERVERware administrator to configure the monitoring of remote sites by creating a set of tests that will indicate whether the monitored site is available or not. The administrator can add actions that will be executed if the tests fail.
Actions can be configured to trigger only if all tests fail (ALL action types) or if any of the tests fail (ANY action types).
The main function of the site monitor is to monitor the replication site with a series of different tests and to perform actions based on the test results.
To create and start monitoring the site, select Site monitoring in the Replication menu.
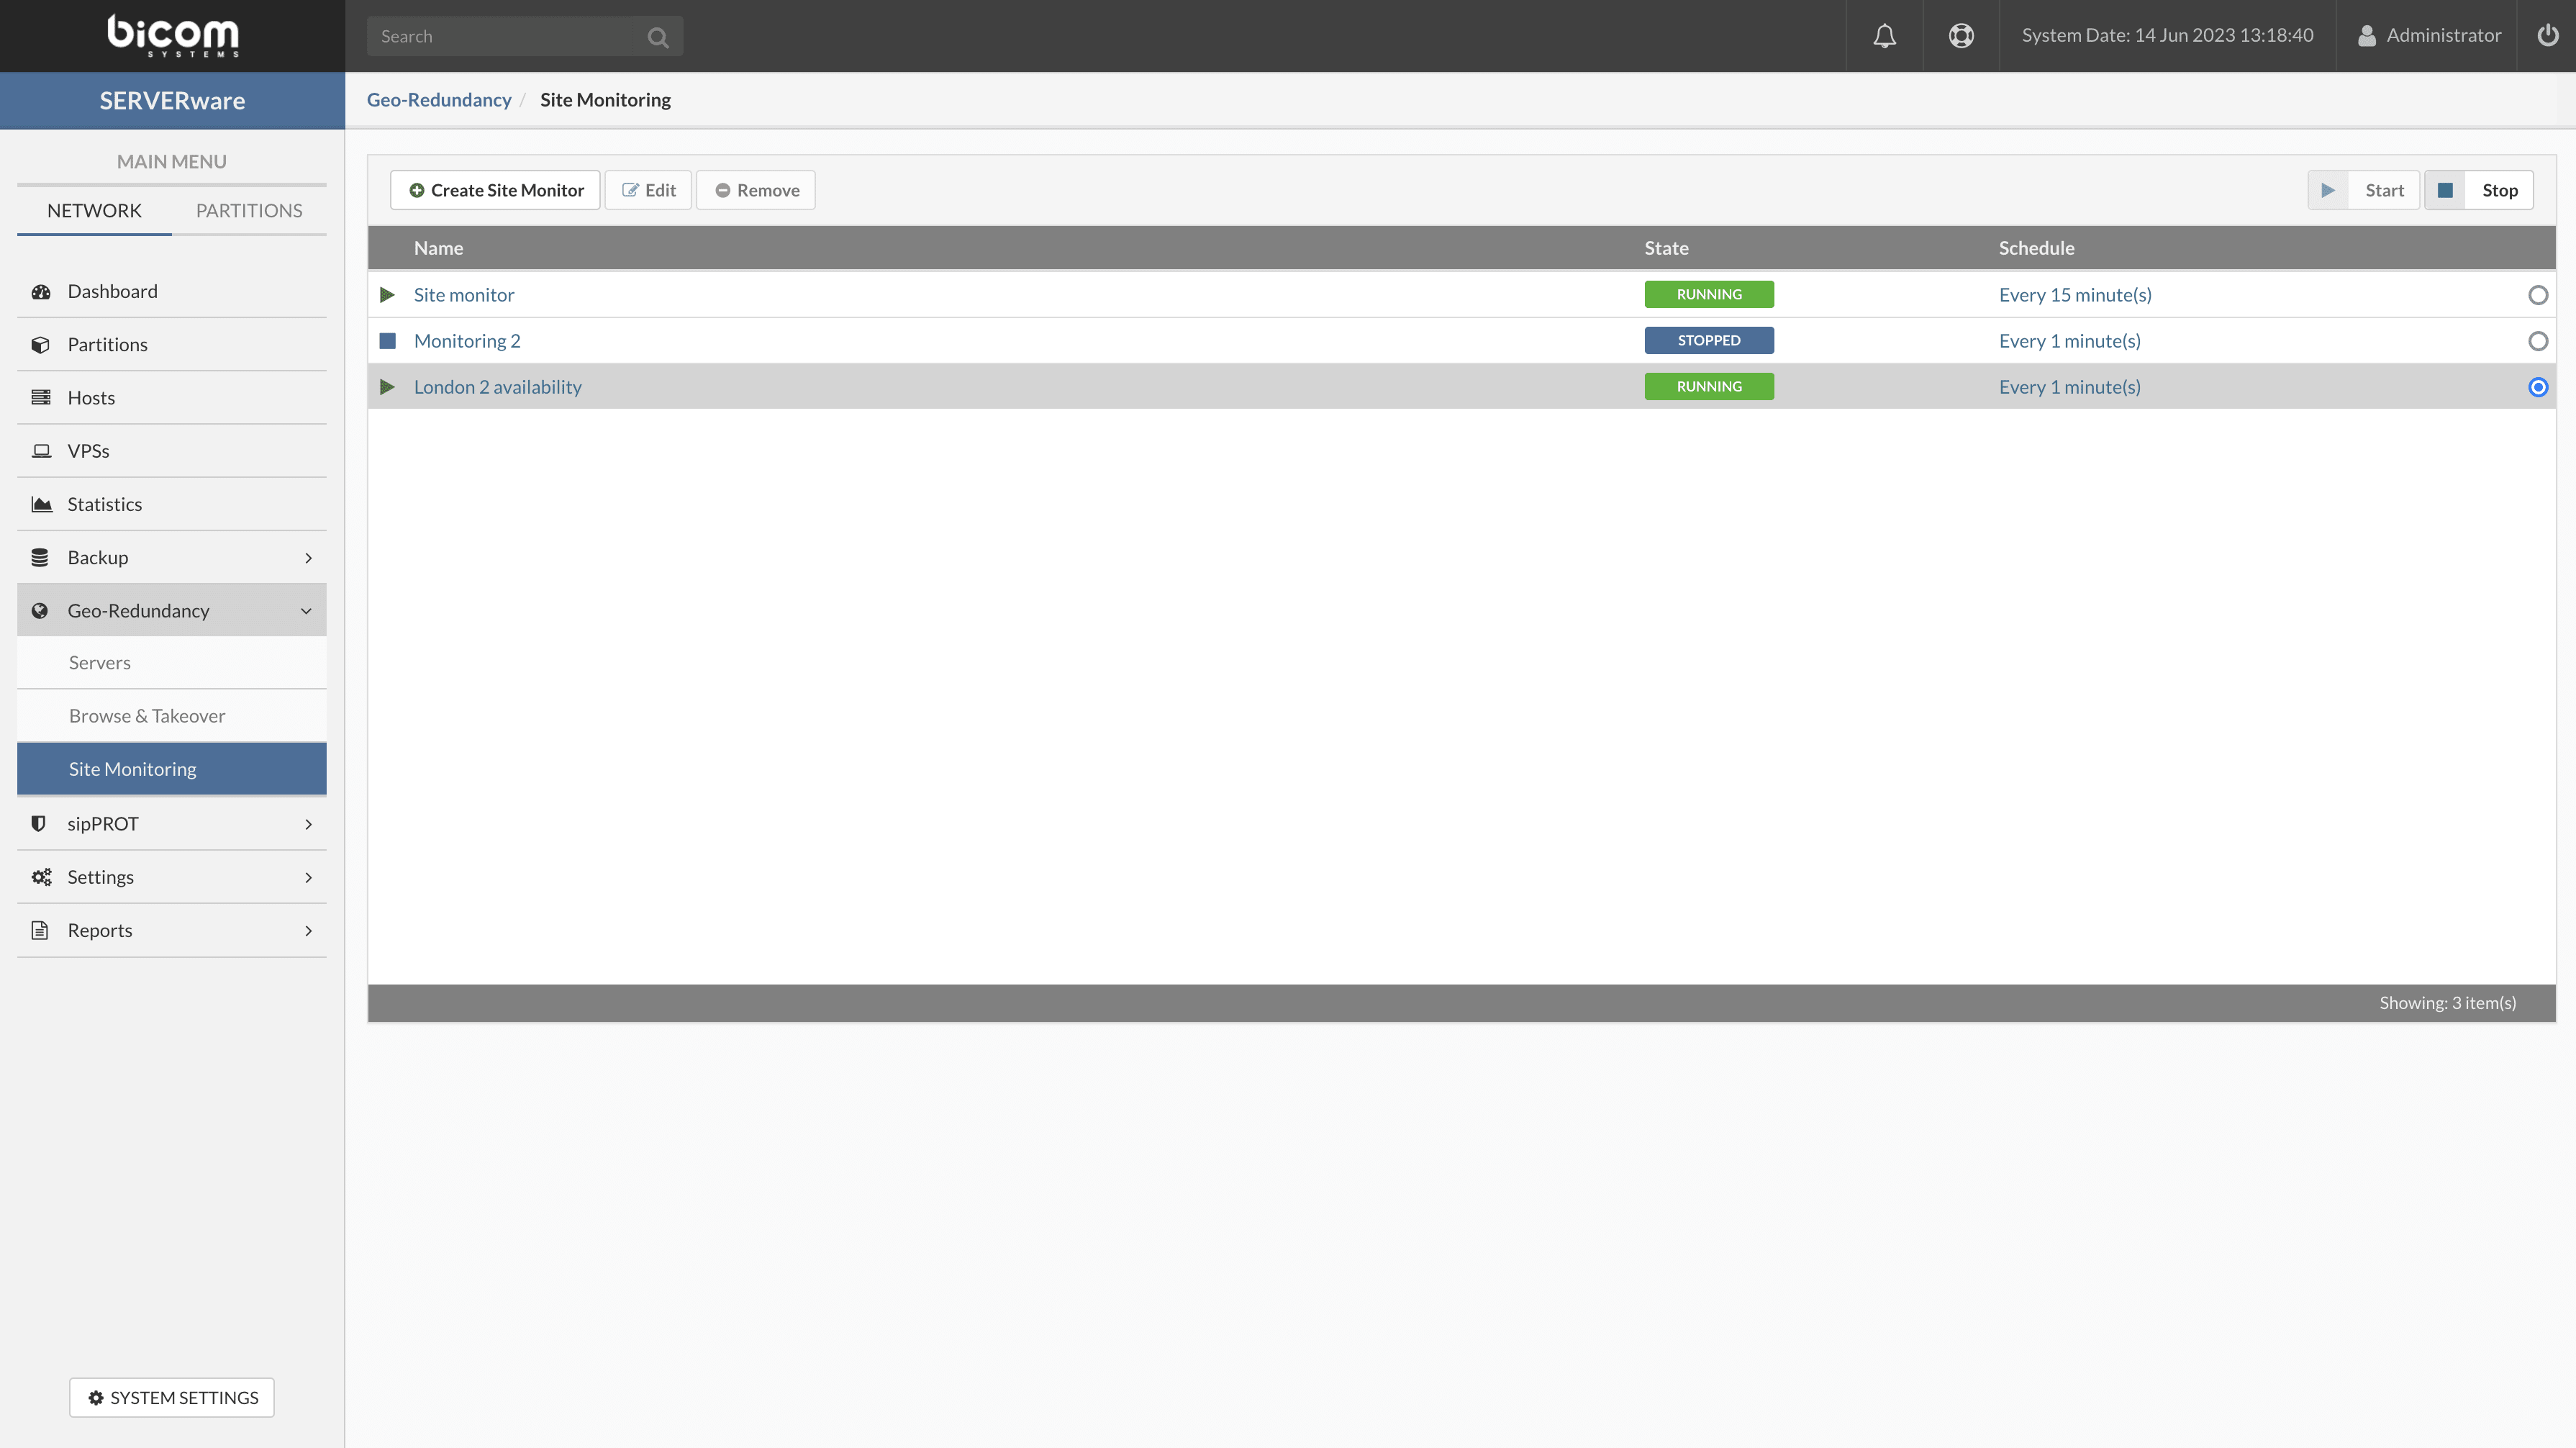
- Create a site monitor : This will open a new frame to create a new site monitor (create an empty set of tests to run and actions to trigger).
- Edit : Edit the existing site monitor (the site monitor must be stopped before editing).
- Remove : Delete the existing site monitor (the site monitor must be stopped before deleting it).
- Start : Start the site monitoring actions.
- Stop : Stop the site monitor actions.
When the button Create a site monitor is clicked, the site monitor edit view will open.
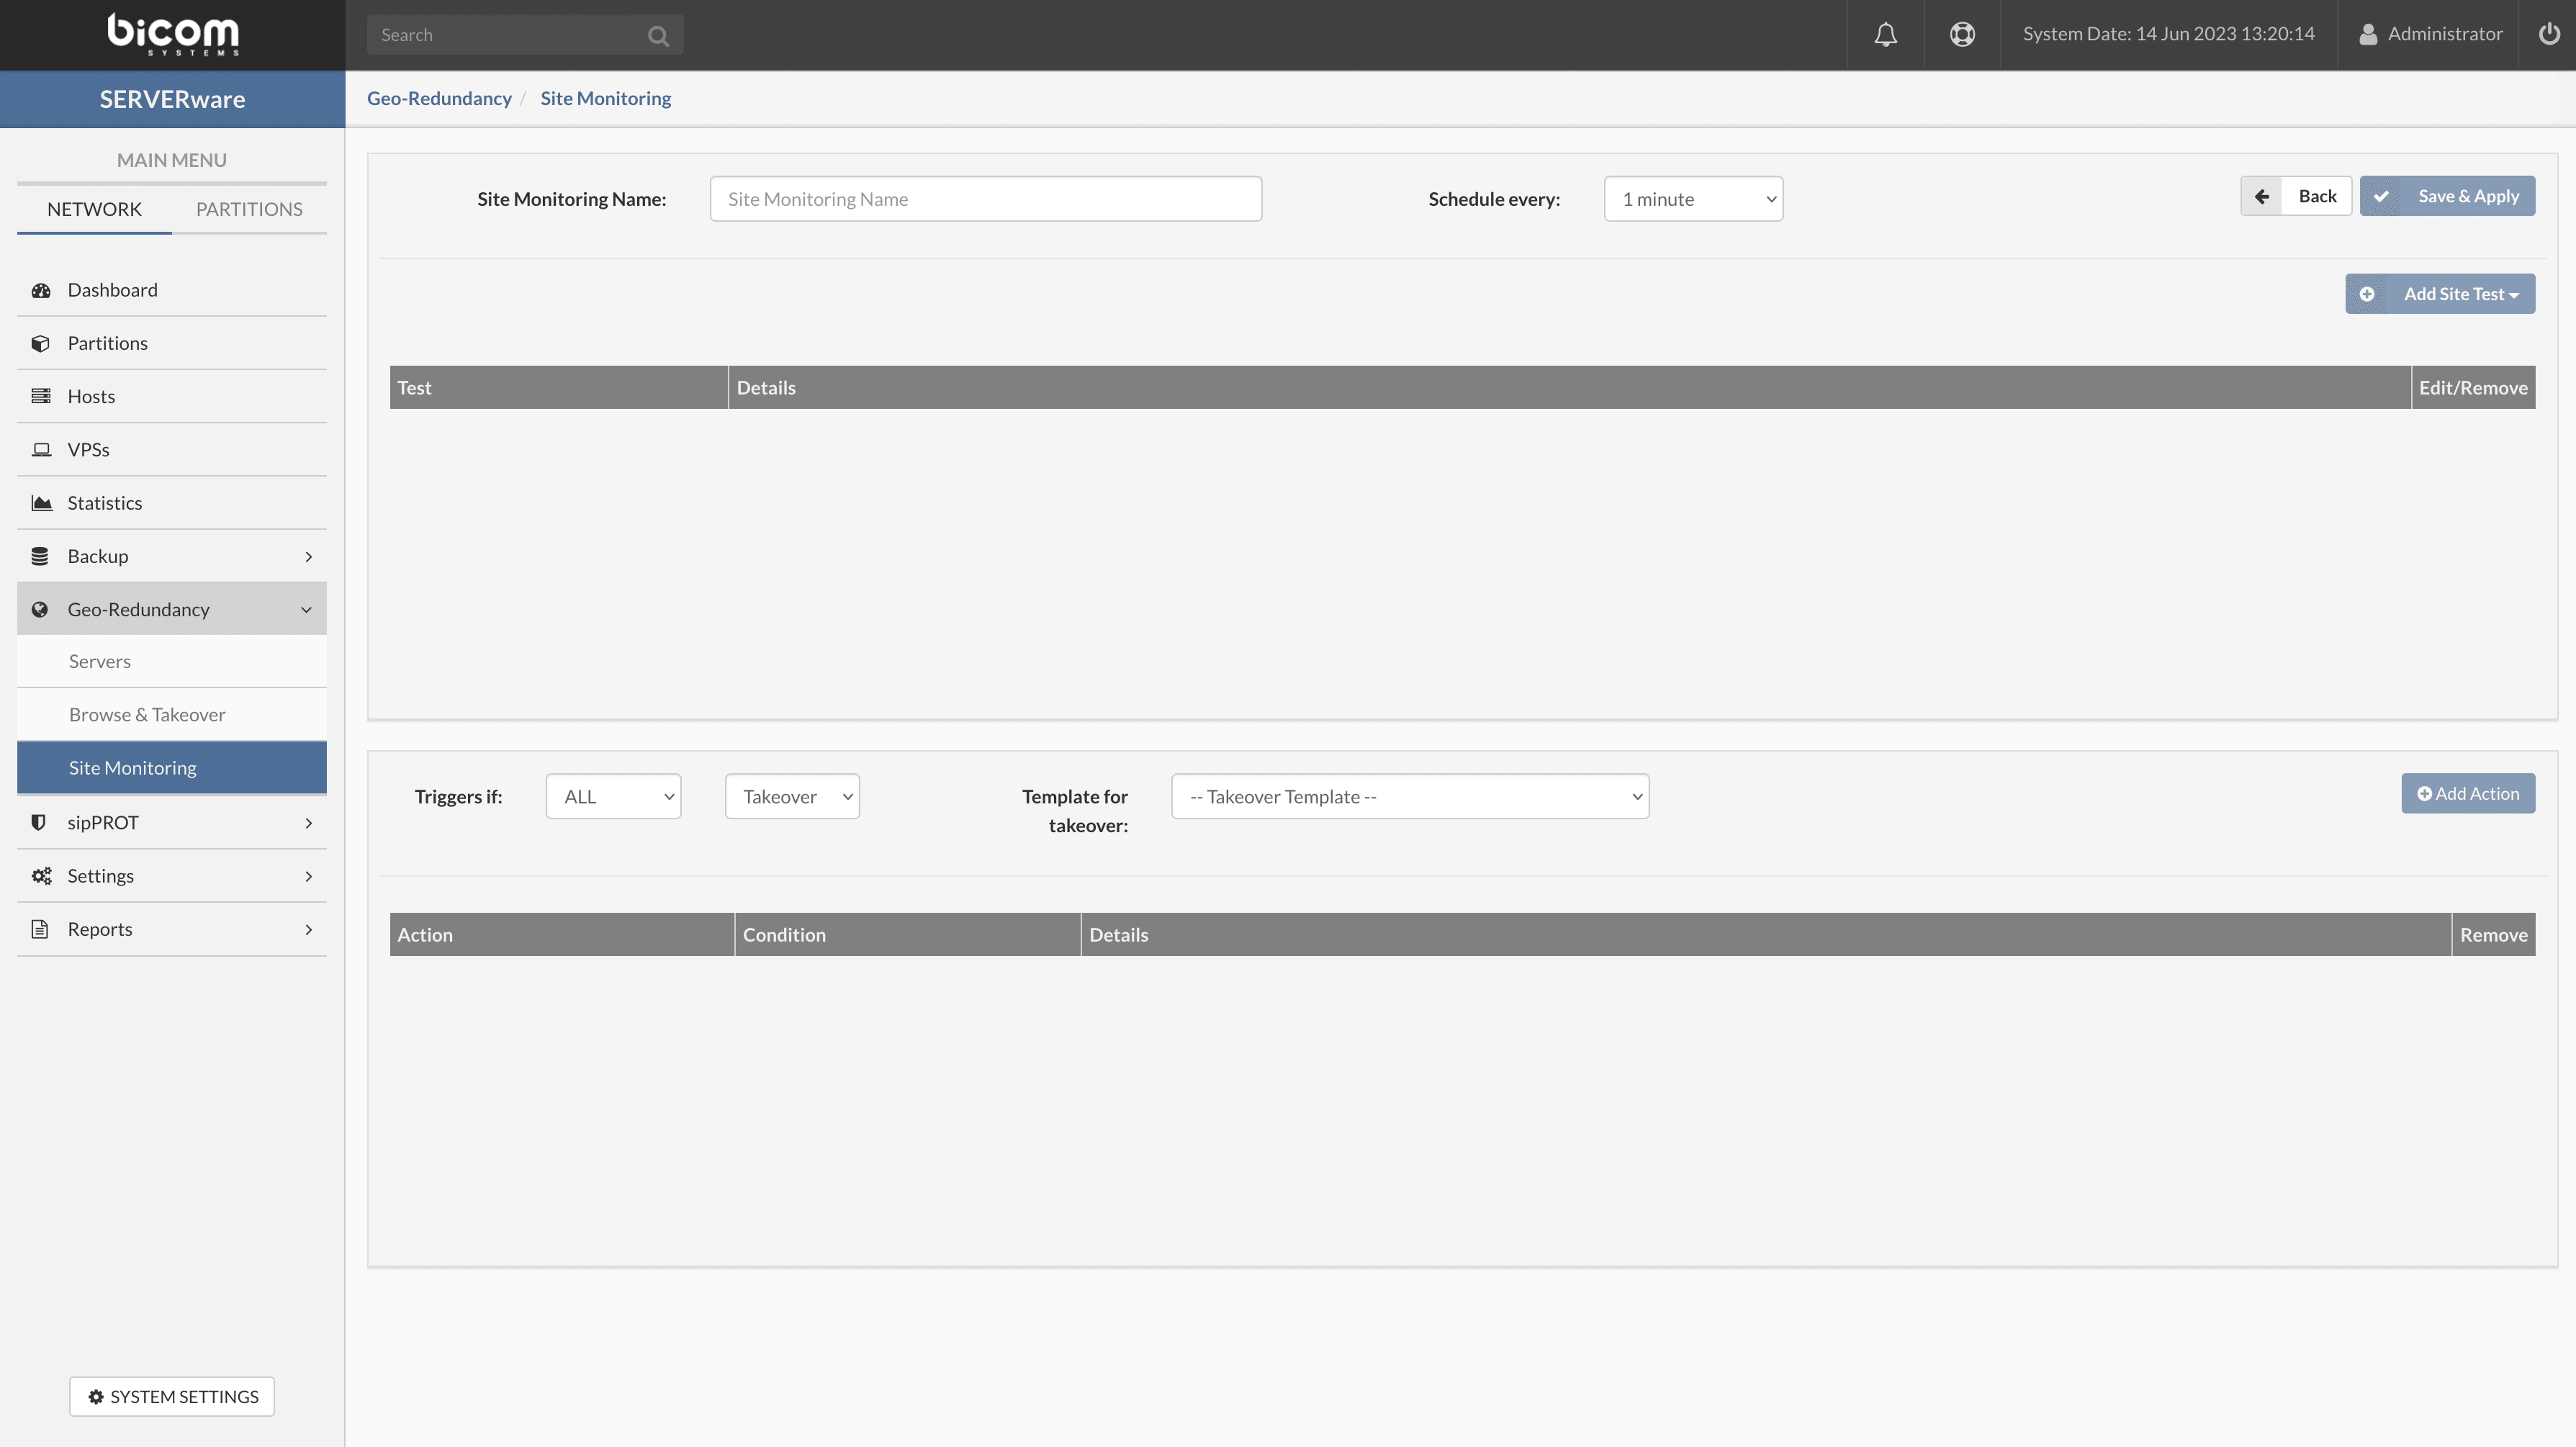
Here, you can add various tests to your new site monitor.
- Name : enter the name of the new site monitor. Make sure to set the name in a few words explaining which site you are monitoring or similar for a better overview.
- Interval : Select the period from the predefined drop-down list. This is the period during which all tests of this monitor will be repeated.
- Add a test : This will open a pop-up window with the test design settings.
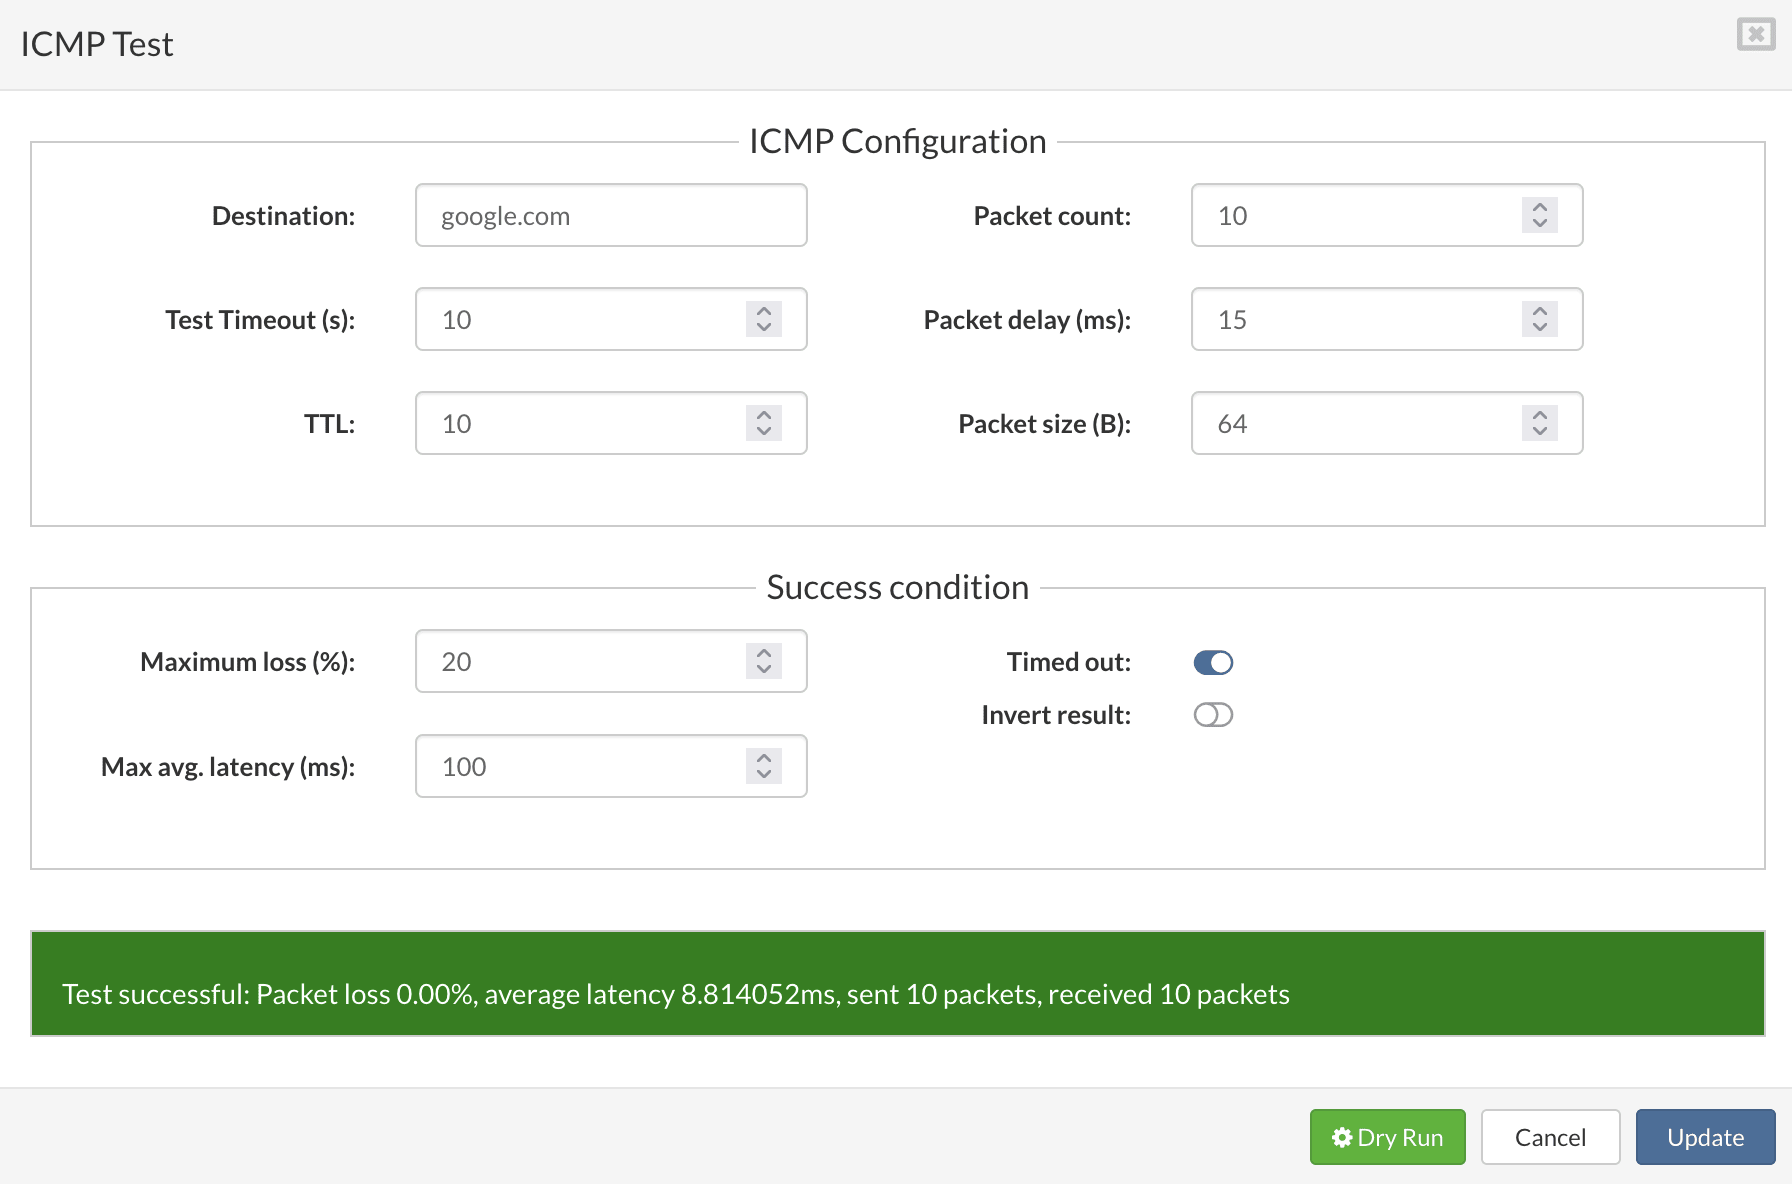
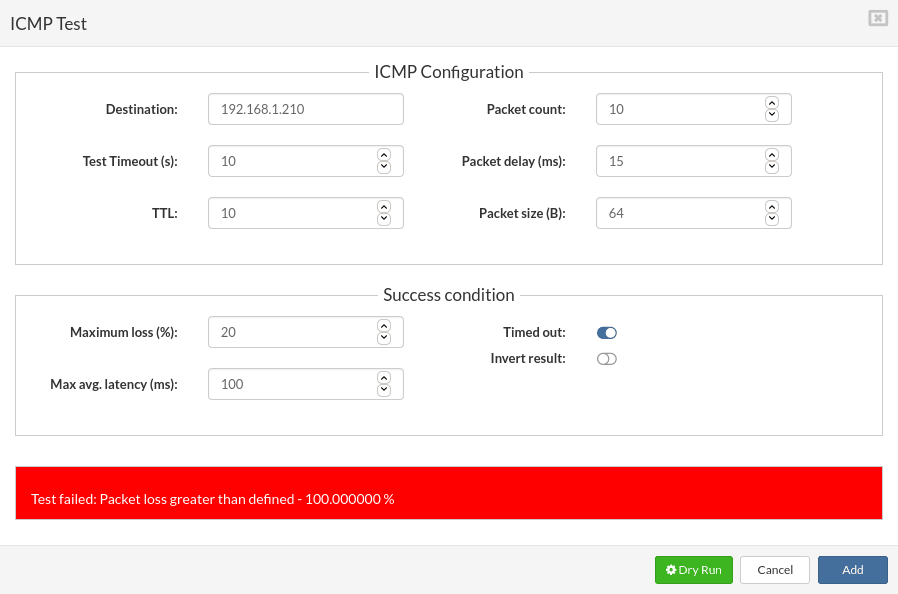
- ICMP test settings: the ICMP test is the set of standard ICMP commands and additional success conditions.
Example of a successful test:
Example of a failed test:
- HTTP test settings
The HTTP test uses the GET, HEAD, POST, PUT, DELETE standards, the set of requests, and additional success conditions.
The HTTP (Hypertext Transfer Protocol) is designed to enable communications between clients and servers. HTTP works as a request-response protocol between a client and a server. Example: A client (our test) sends an HTTP request to the server; then the server returns a response. The response contains status information about the request and may also contain the requested content.
| Field | Description |
|---|---|
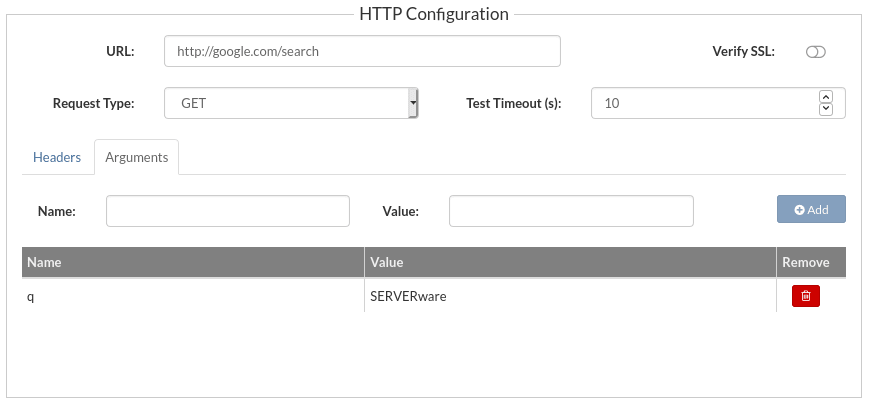
| URL | This will be the destination of our HTTP test, http:// or https:// are mandatory in the destination address. |
| Request type |
|
| Test timeout(s) | Indicates the maximum duration of the test length. Past this delay, the test will stop. |
| Check SSL | You can check the SSL certificate on your destination to make sure it is correctly installed, valid, trusted and does not give any error to any of your users. |
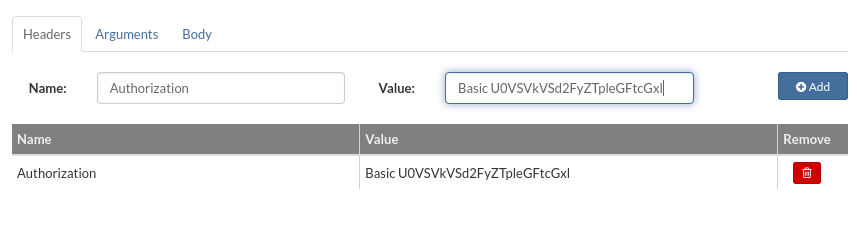
| Headers | HTTP headers allow the test server to pass additional information with an HTTP request or response. An HTTP header consists of its Name and Value.
|
| Arguments | HTTP arguments allow the test server to pass specific arguments with an HTTP request or response. An HTTP argument consists of its Name and Value.
|
| Body | The body is used to manually add a body to your request, based on your needs. JSON example: |
| Response code | HTTP response status codes indicate whether a specific HTTP request has been successfully completed. The test will fail if the requested code is not returned from the destination. Responses are grouped into five classes: Informational responses (100-199), Successful responses (200-299), Redirects (300-399), Client errors (400-499), Server errors (500 to 599). More details on response codes: here |
| RegEx reply | The regular expression is used to parse the response code. Example:
|
| Invert result | When enabled, the test results will be inverted: A failed test will pass and vice versa. |
| Launch Beta-test button | When you press it, you will run the Beta-test and display the results. (for a successful test, the GREEN information bar will be displayed, and a failed test will be a RED information bar). |
| Cancel button | Will cancel all changes and close the dialog. |
| Update | Will update the test configuration and close the dialog. |

- TCP test settings
The Transmission Control Protocol (TCP) is a transport protocol that runs on top of the Internet Protocol (IP). Together, these two protocols often form what is called the TCP/IP protocol stack. TCP is a protocol that enables reliable process-to-process communication in a multi-network environment. Unlike IP, which does not guarantee the delivery of packets in the correct order or their actual arrival, TCP detects these problems, retransmits lost data, eliminates duplicate data, and reorders data in the correct order.
As a result, TCP ensures reliable, ordered, and error-free data delivery between applications that communicate over an IP network.
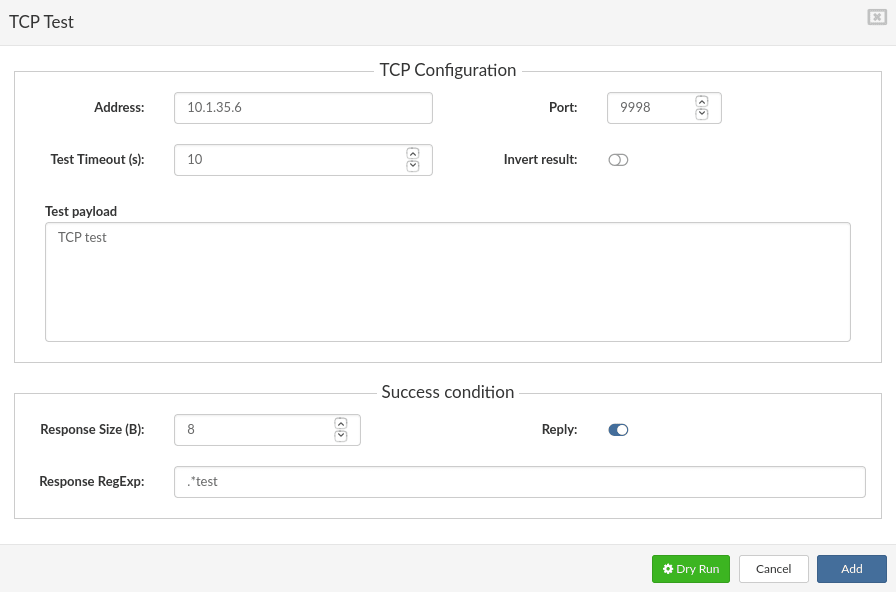
TCP test example:
- UDP test settings
The UDP (User Datagram Protocol) is a connectionless transport layer protocol (layer 4) belonging to the Internet protocol family. UDP mainly serves as an interface between IP and higher-layer processes. UDP protocol ports make it possible to distinguish between multiple applications running on a single device.
Unlike TCP, UDP adds no reliability, flow control, or error recovery features to IP. Due to its simplicity, UDP headers are shorter and consume less network bandwidth than those of TCP.
UDP is useful in situations where the reliability mechanisms of TCP are not needed, for example when the application layer handles error correction and flow control. UDP is the transport protocol for many well-known application protocols, including the Network File System (NFS), the Simple Network Management Protocol (SNMP), the Domain Name System (DNS) and the Trivial File Transfer Protocol (TFTP).
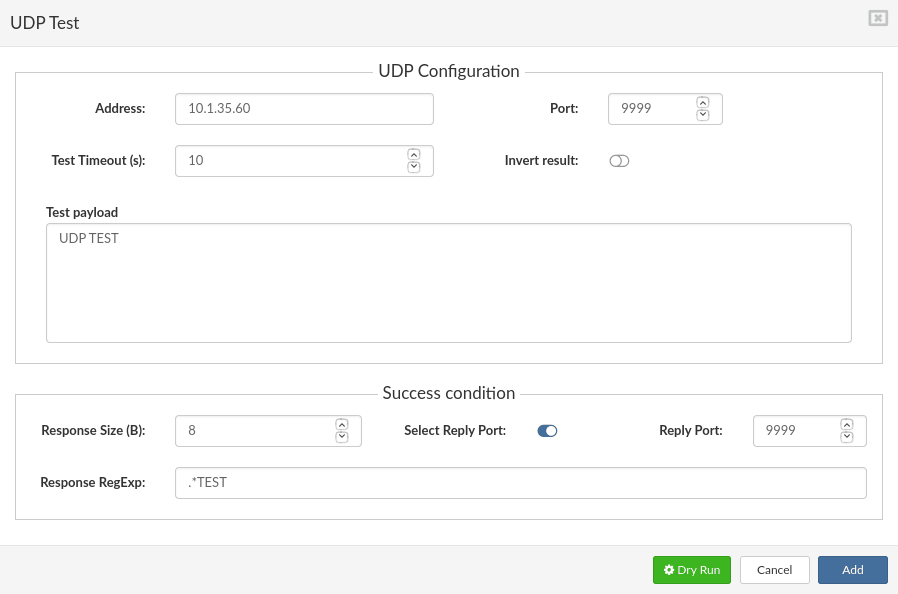
UDP test example :
- MMonit integration
M/Monit uses Monit as an agent and can manage and monitor all your hosts and services. The SERVERware 4.3.x version comes with M/Monit integrated, which can be used to monitor SERVERware systems.
A new option MMonit is added to the drop-down list Add a site test to facilitate the configuration of SERVERware site monitoring with the third-party monitoring tool MMONIT.
In the field Site monitoring name, enter the desired name for the monitor (in the example, we will use MMONIT). Set the schedule time (corresponding to the time at which the test will be triggered) and press Save and apply.
Then, add a new site test (in the drop-down list, select MMonit).
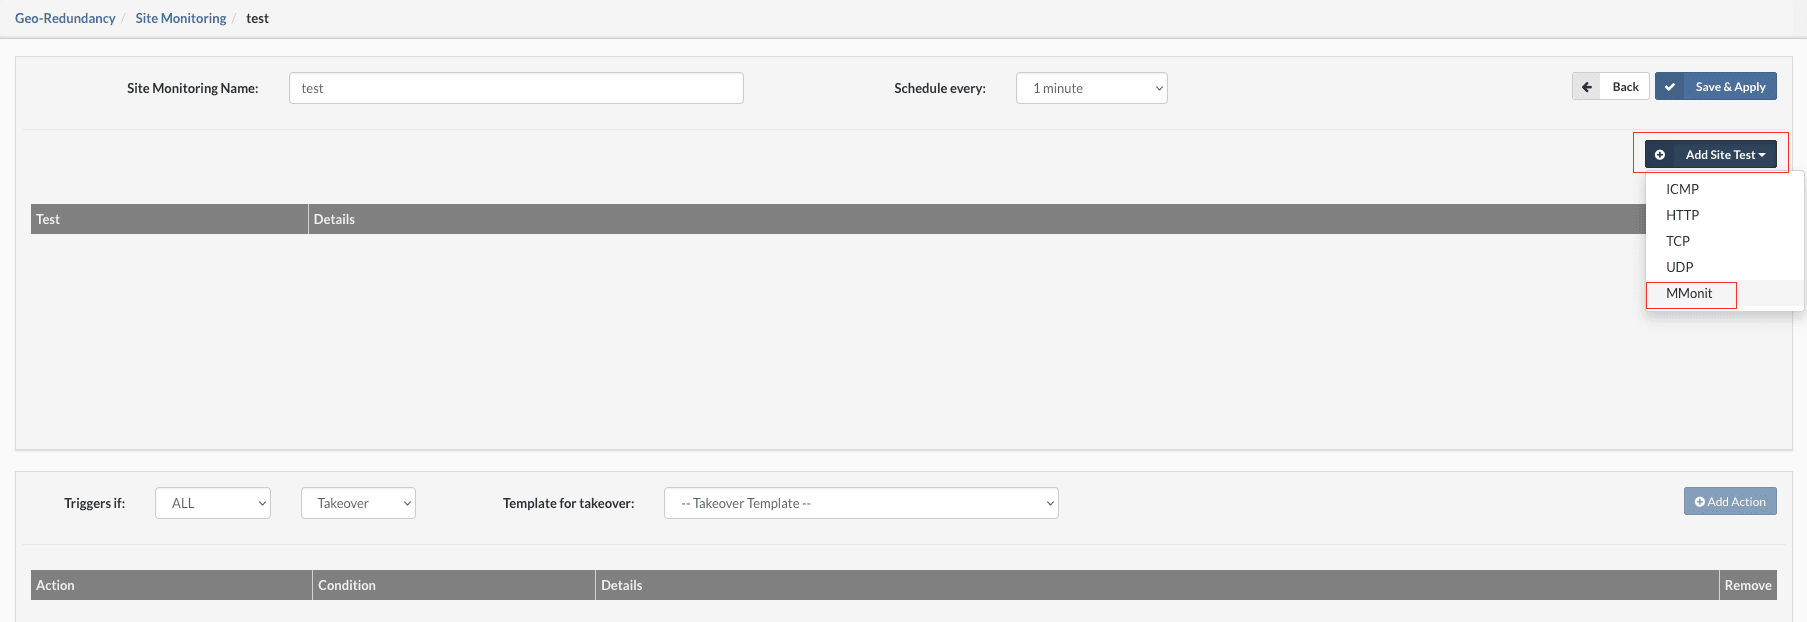 A pop-up window will appear:
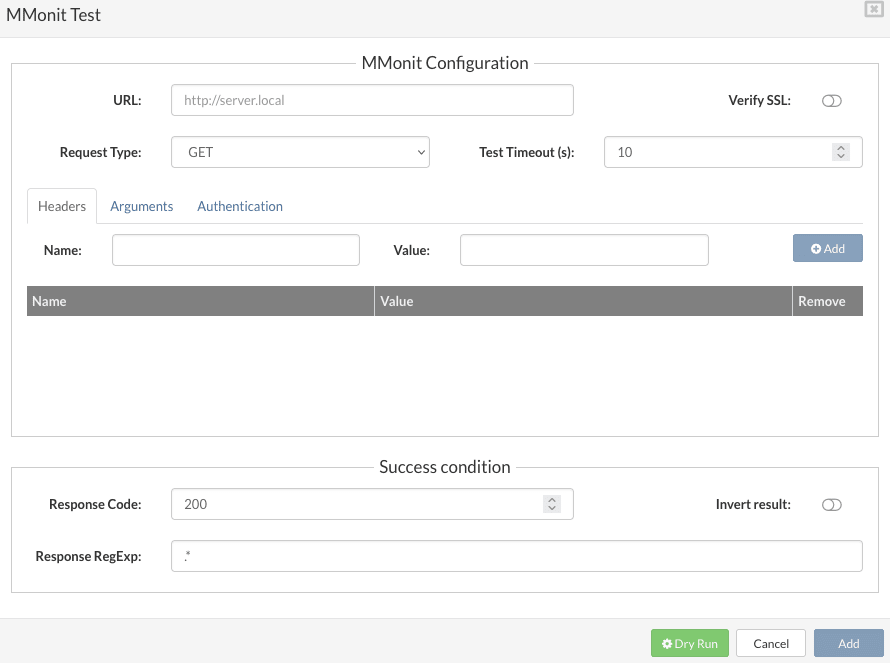
Fill in the fields as follows:
- URL: http://<MMONIT IP>:8080/api/1/reports/events/list
- Request type: GET (according to the MMonit API documentation)
- Test timeout in seconds: ten (the test will wait for a response for a maximum of 10 seconds)
- Arguments: z_csrf_protection with the value disabled
- Status with the value 1 (to filter failure events according to the MMonit API documentation)
- Authentication: Enter the MMonit username and password (those of the GUI)
- Success conditions: Response code: 200 (default),
- RegExp reply (to search for the previously defined hostname in MMonit)
You can now test your configuration by pressing the button Dry Run. The result should be Test successfuli (make sure your MMonit is not already experiencing failures). Press Updater to save the test in the list of tests.
Create actions to trigger if the conditions are met:
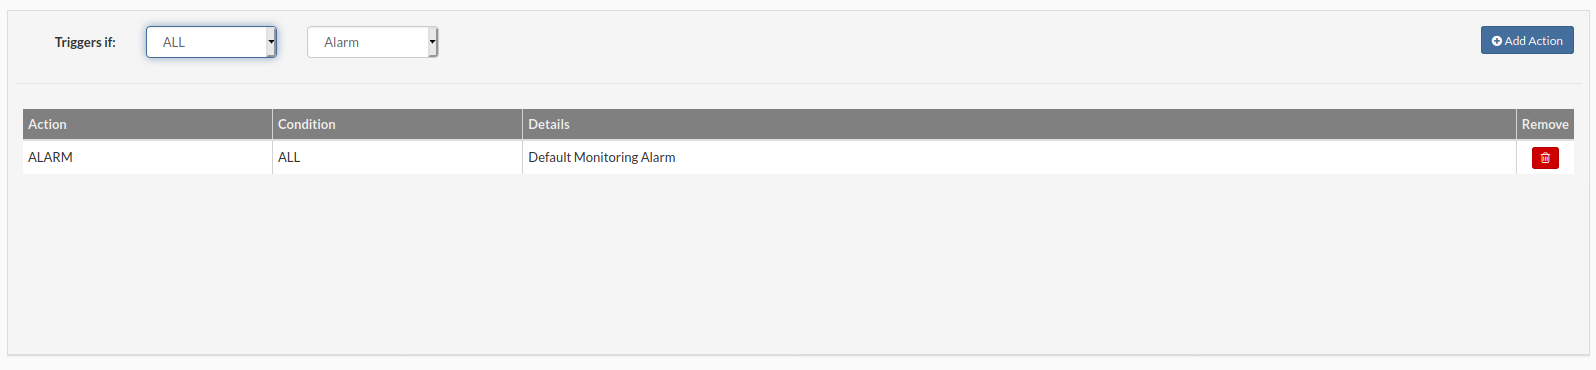
- The button Add action allows you to add an action to the action list, with the selected trigger option:
- Trigger if : Two conditions available (ALL and ANY) and an action (Alarm).
- ALL : Triggers the alarm only when all tests fail for this site.
- ANY : Triggers an alarm when any of the tests fail for this site.
Alarm : Select the action to trigger when the conditions are met. The alarm will be displayed on the dashboard, and an email notification will be sent to the administrator.
