


Supervisor panel
The Supervisor edition is expanded with the features of the Agent edition.
Now, the supervisor can enable/disable the agent's login information and additionally use all the features of Agent Edition.
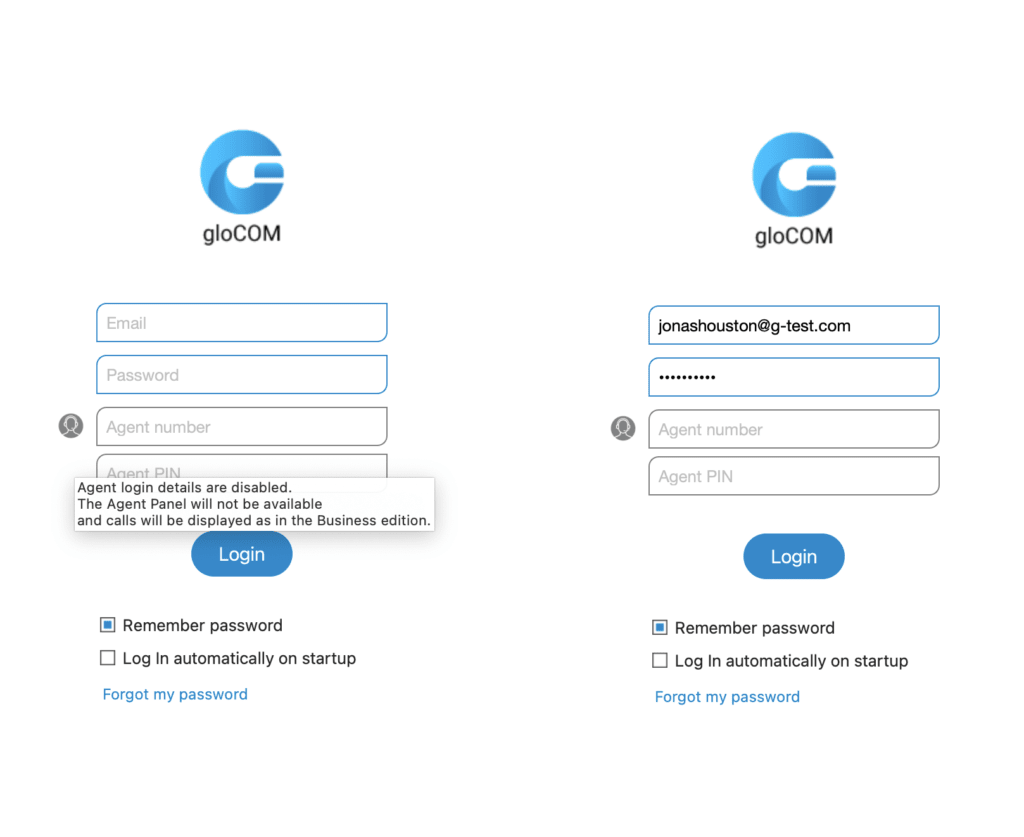
 By clicking on this icon, you will enable/disable the agent's login details.
Hovering over it displays a tooltip with the appropriate message.
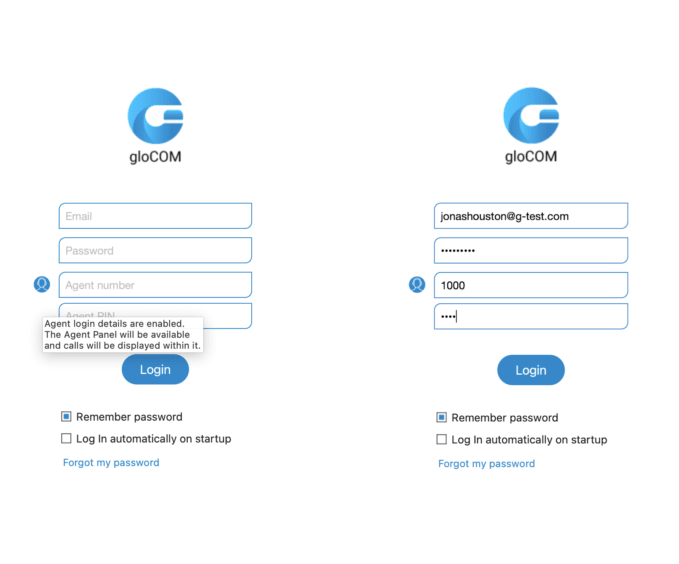
If the supervisor logs in as an agent, the Agent Panel window will be available and all calls will be displayed there.
Furthermore, the phone dialer and all phone-related settings will be placed in the agent panel.
If the agent login information is disabled, the Agent Panel window will not be available and the application will behave like the Business edition of Communicator.
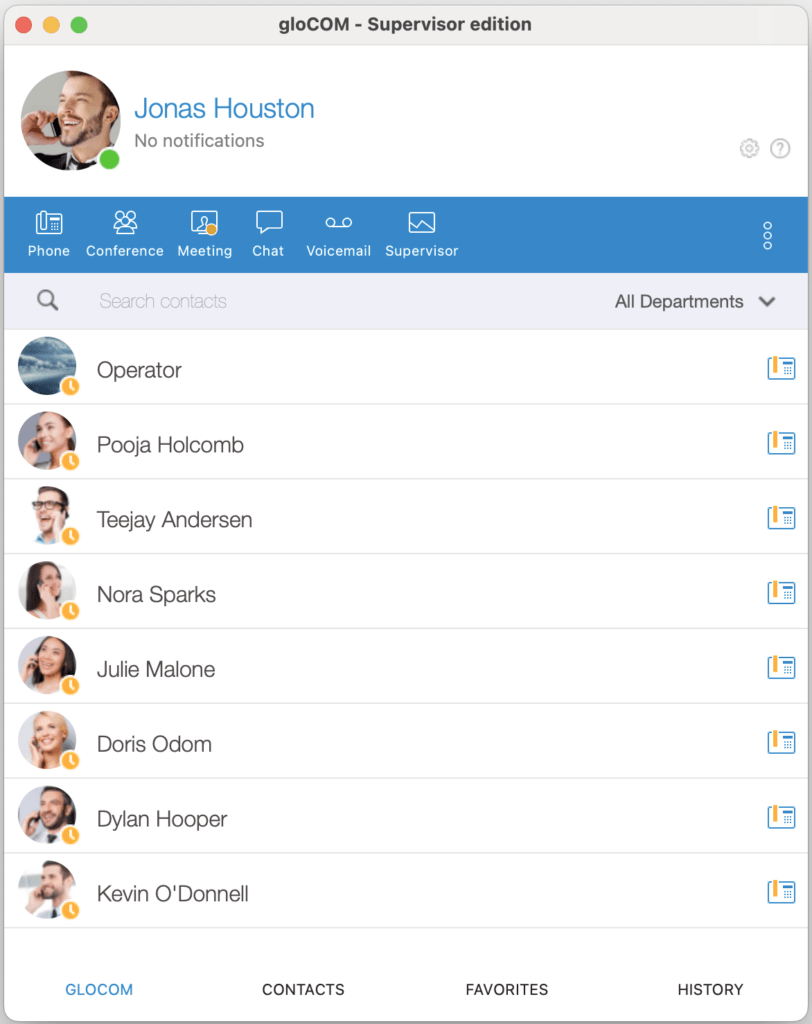
Supervision panel
An advanced and improved design of the supervision panel has been created.
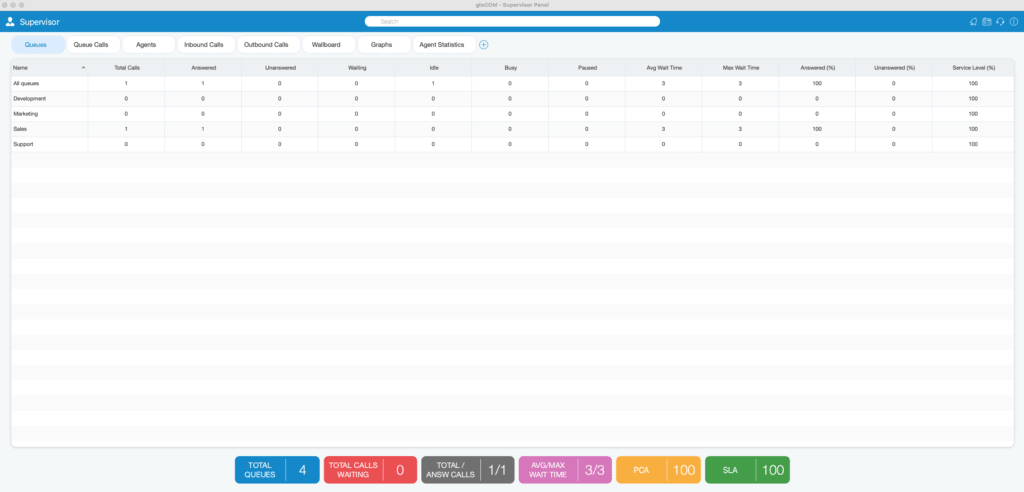
Search field
A search field has been added to the supervisor panel. It is possible to search for agents, queues, or campaigns.
When the user clicks on the Search field, the view with all agents/queues/campaigns should be displayed. This view is visible only if the Search field is selected. If the user clicks anywhere outside the search field or this view, it will close.
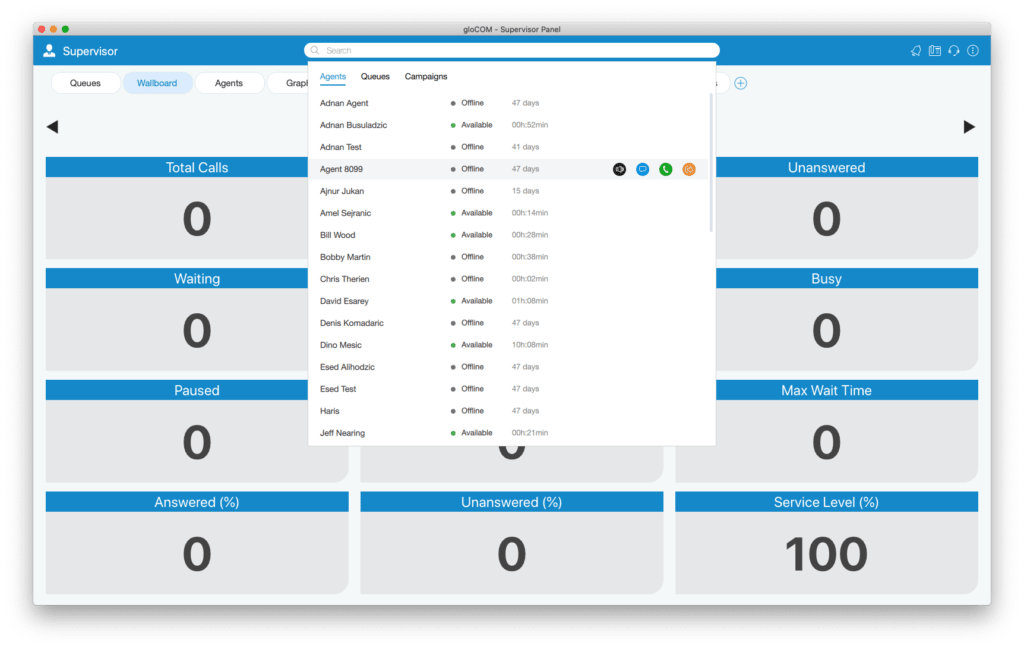
Agents are searched by name or number. Queues and campaigns are searched by name.
Some additional actions are provided when the user searches for agents with the mouse:
- Listen: The supervisor is allowed to listen to calls.
- Chat: the supervisor can chat with the agents.
- Call: the supervisor can take a call.
- Logout: the supervisor can log out a specific agent.
To exit Search mode, press the ESCkey or simply click anywhere outside the Search field.
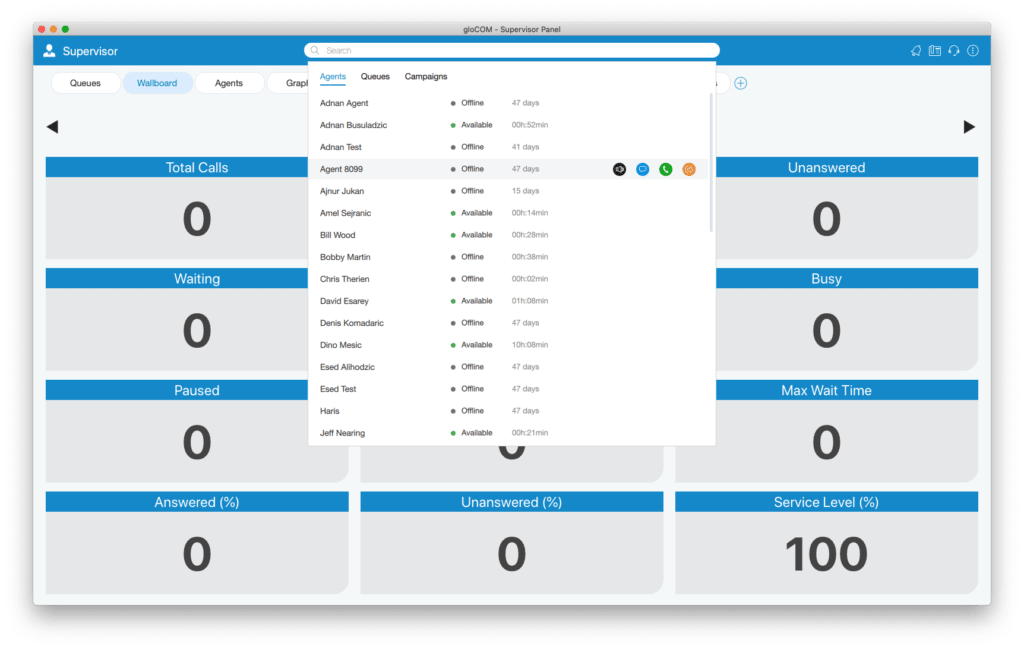
If the PBXware Contact Center license does not support the Dialer option, the search option for campaigns will not be available.
Supervisor toolbar
On the right side of the toolbar are icons that provide the following:
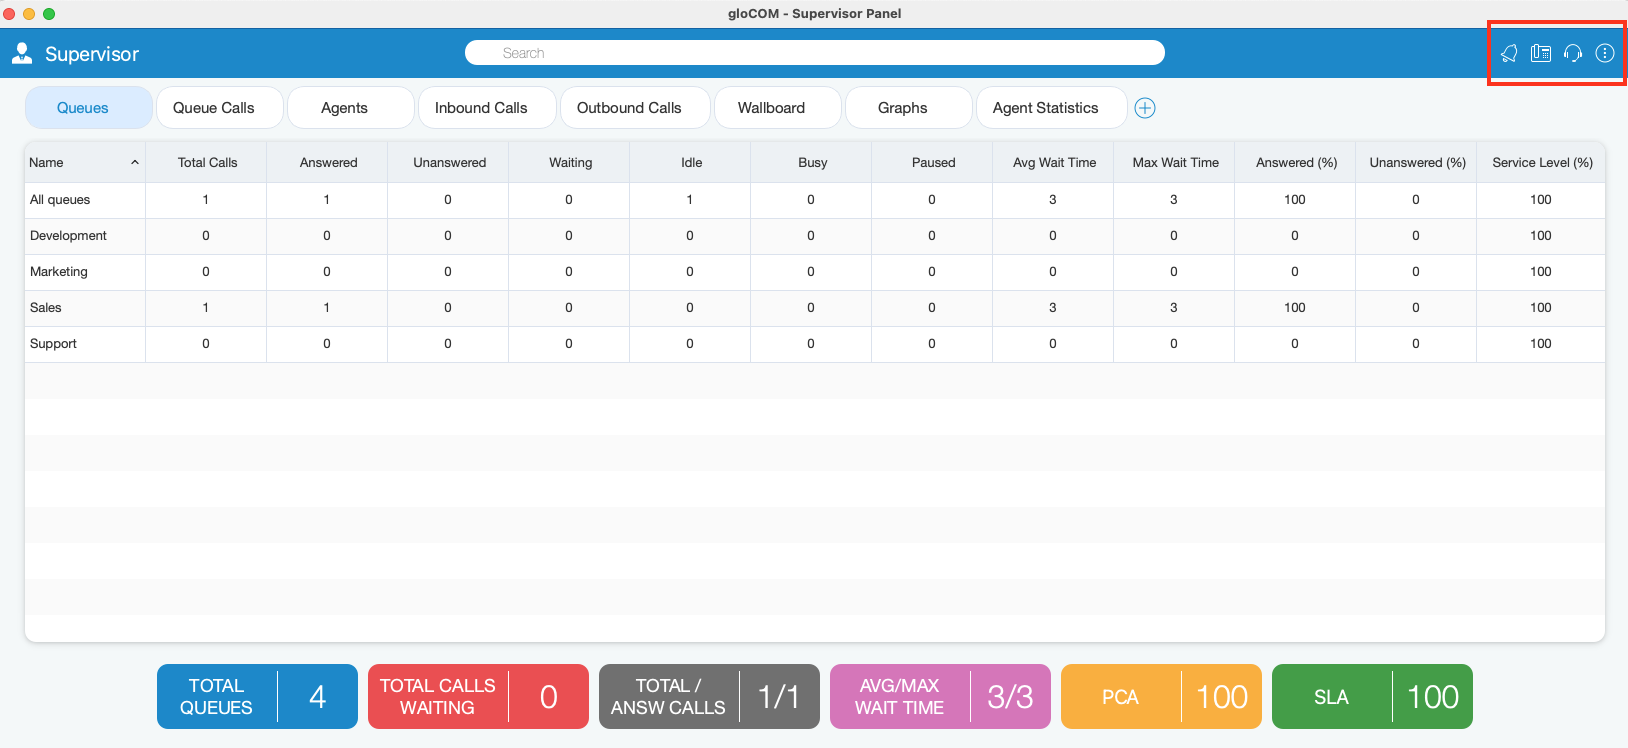
 Notification bell: click the bell icon to display a list of all alerts.
 Phone dialog box: displays the phone dial dialog.
 Agent panel: displays the agent panel.
 Preferences: when the user clicks on this action, an additional menu with the options appears.
Additional information about the icons is presented below.
Notifications
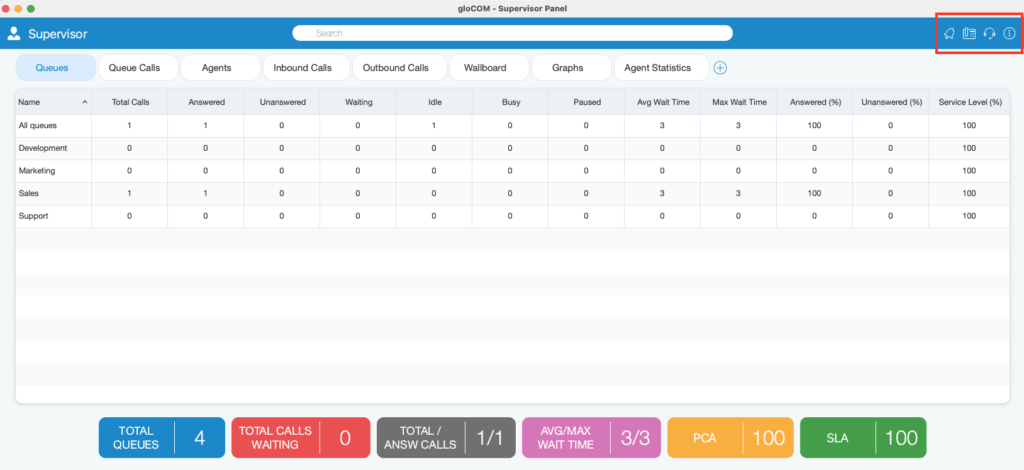
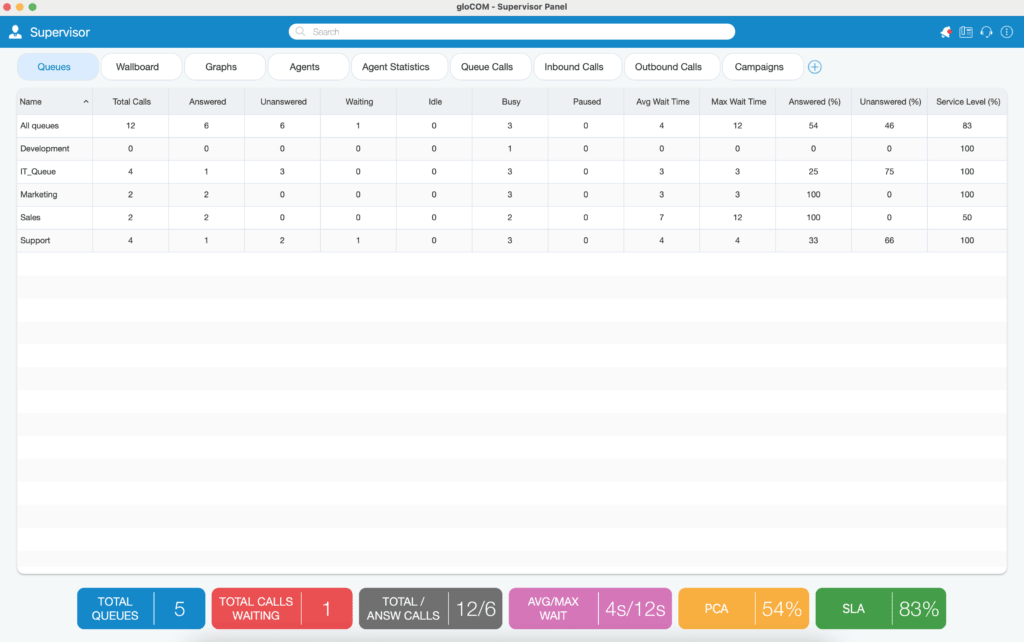
If there are new alerts, the notification bell icon changes.
- Each item in the notification list includes the message, the time at which the alert occurred and the alert status (read, unread).
- The unread message contains a blue circle on the right.
- To mark an alert as read, it is necessary to hover over the alert item.
- To close the notification list, click outside the notification area or simply click the notification bell icon again.
- To delete all notifications, click the icon in the top right (trash).
Phone
Clicking the phone tab displays the phone module area.
- The phone module area displays information about missed calls.
- From the phone module, users can configure a desk phone and a mobile phone.
- Allows users to select the device they want to use as the input/output device.
- Allows users to select the device they want to use as the ringing device.
- The drag-and-drop action is displayed in this area of the phone module.
- Microphone and speaker volume tuner.
- The phone module area displays the phone numbers of dialed contacts.
- Phone module dial pad – used to enter phone numbers.
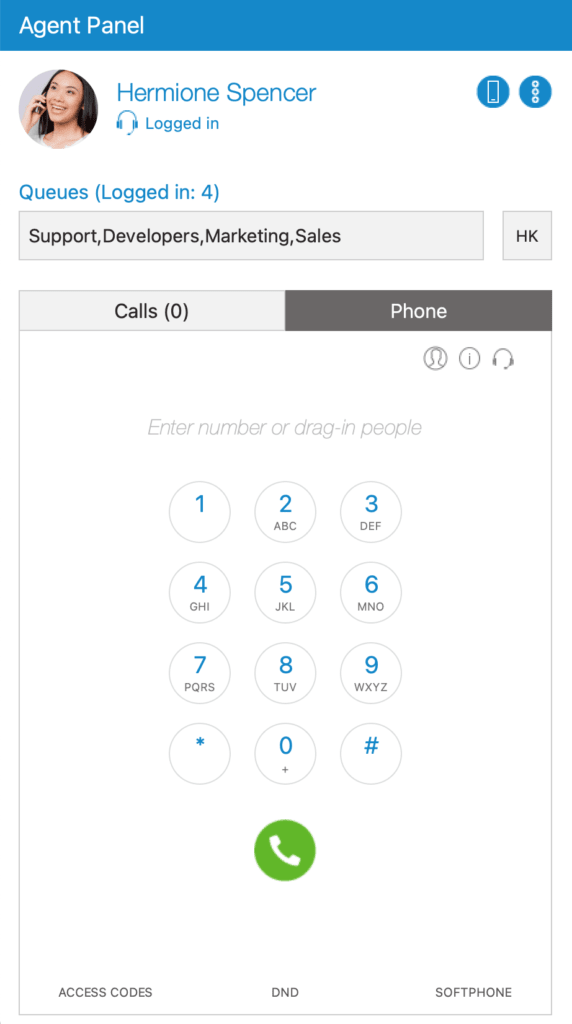
Agent panel
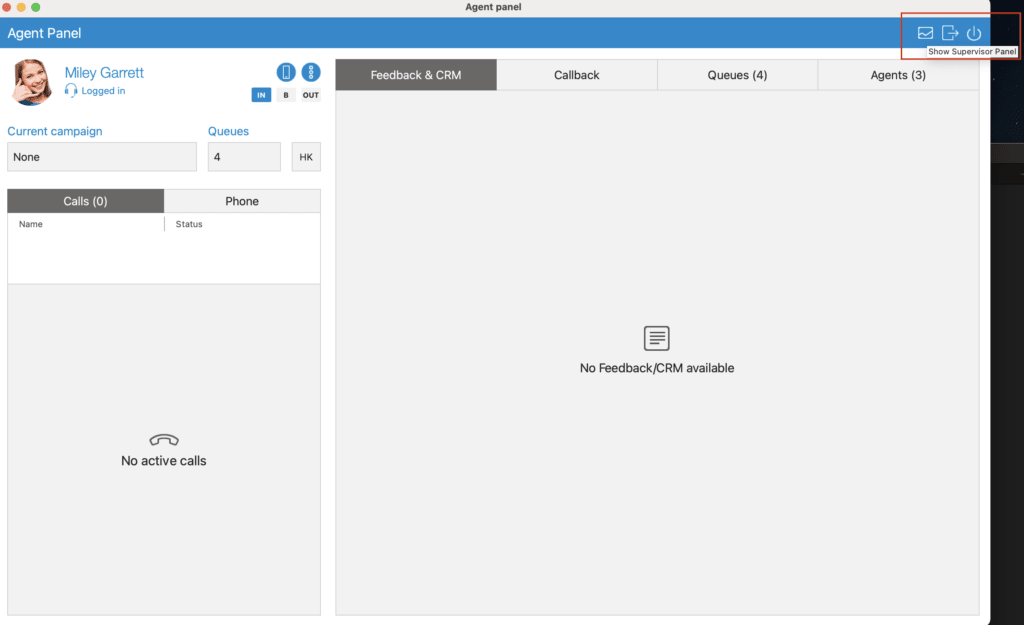
The agent panel window can be opened by clicking the module icon in the supervisor panel.
All agent-related features are found in this window (Agent Panel) and allow an agent to more easily manage multiple calls, feedback forms, CRM pop-ups, callbacks, other agents, and queues.
Furthermore, the phone dialer and all phone-related settings will be displayed in the Agent Panel window.
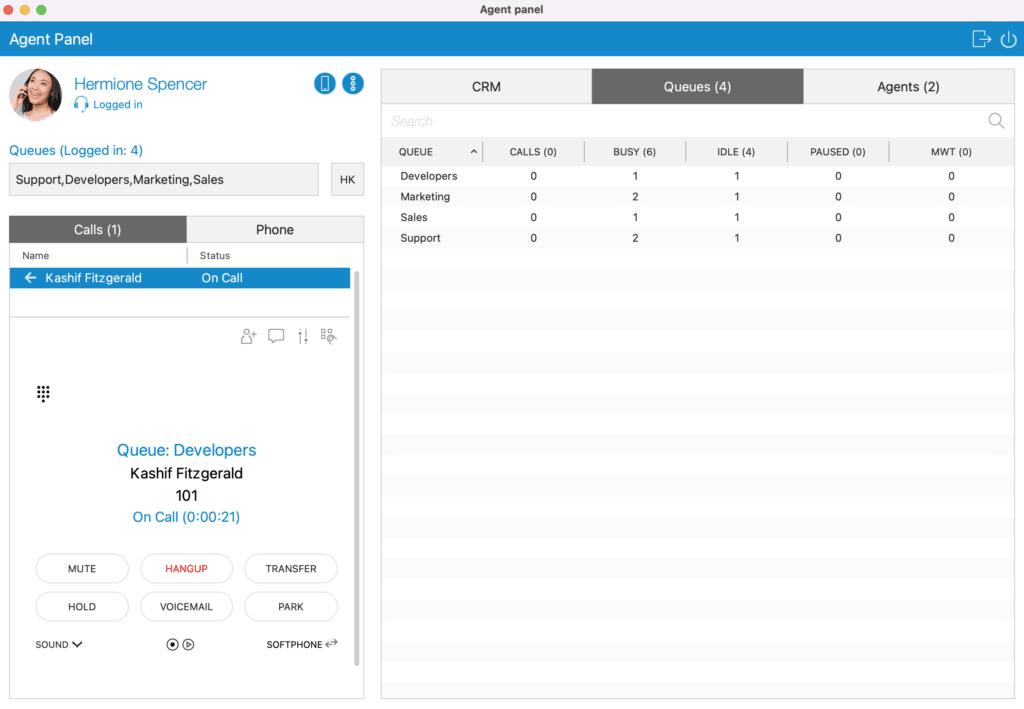
Preferences
By clicking on Preferences, users have additional options to:
- Preferences: open the Preferences dialog box in which users have configuration options for alerts, queues, agents, and threshold. More information about the preference options is shown below.
- Full screen: This option allows you to enter full-screen mode (the supervisor window occupies the entire computer screen). If the window is already in full-screen mode, click this option to restore the window size to its previous size.
- Slideshow: This option is used to start/stop the slideshow of the Wallboard module content.
- Zoom in/out: This option is used to increase/decrease the font size for the content of all modules except the Wallboard module.
- Default size: this option restores the font size to the default size.
- Show users: open the main gloCOM window.
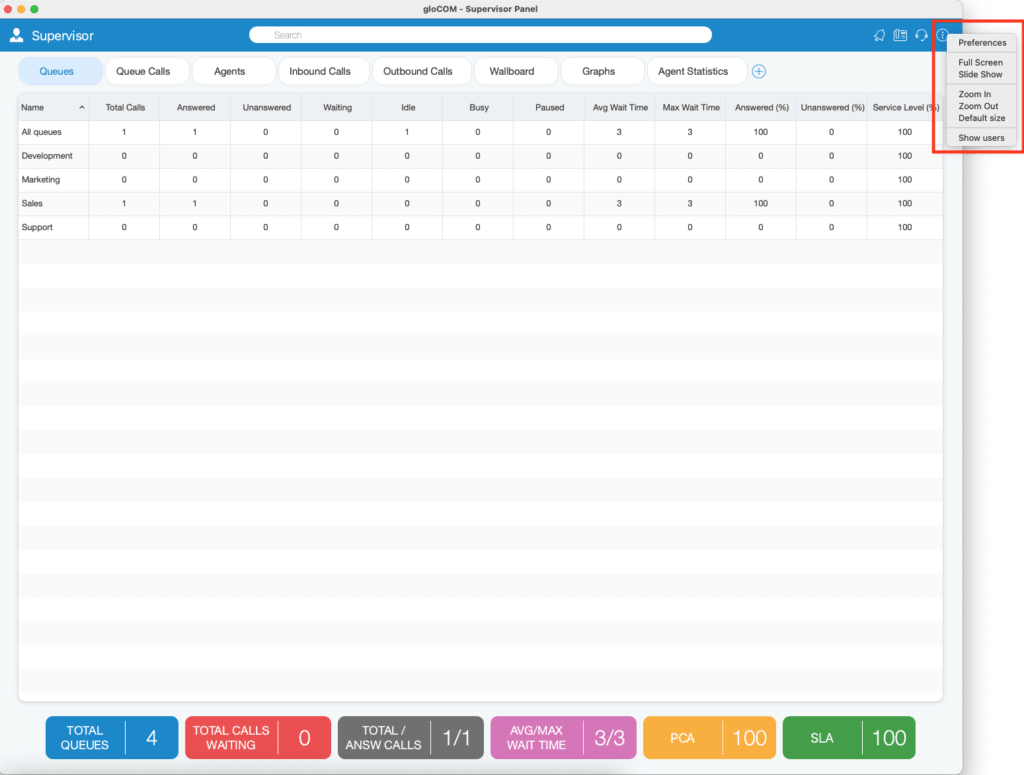
Preference options
General tab
- Service level: select the time in seconds. This is used to calculate the statistics in the supervision panel.
- Slideshow timeout: select the slideshow timeout (in seconds).
- Edit the font: edit the font and style of the content in the monitoring panel. It can be useful on large TV screens to set an appropriate font size.
- Set the default font: reset the supervision panel's default font and style.
- Automatically launch the supervisor panel when connecting to the application: If this option is checked, once the supervisor is logged in, the supervisor panel will be displayed automatically.
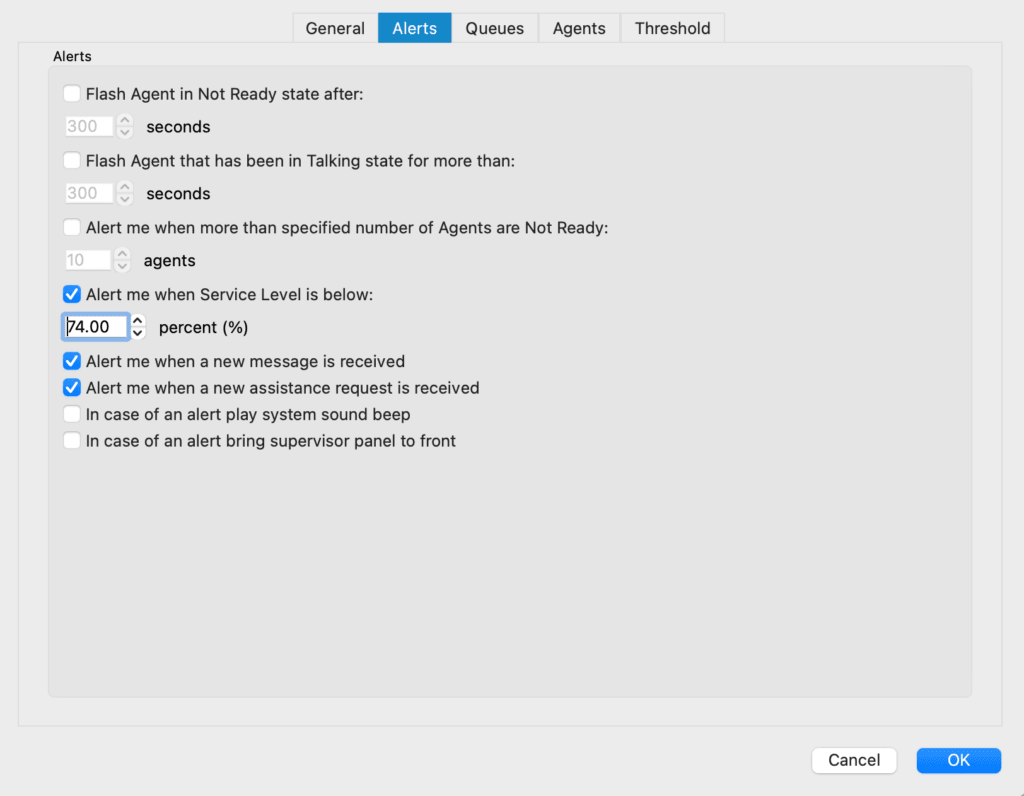
Alerts tab
- Flash Agent to the Not Ready state after: choose the duration in seconds during which an alert will flash if the agent is not ready.
- Flash an Agent who has been in the talking state for more than: choose the duration in seconds during which an alert will flash if the agent is in a talking state.
- Notify me when more agents than specified are not ready: choose the number of not-ready agents after which the alert will appear.
- Alert me when the service level is below: choose the percentage of the service level after which the alert appears.
- Notify me when a new message is received: Click the checkbox to enable this option.
- Notify me when a new support request is received: Click the checkbox to enable this option.
- In the event of a beep from the alert playback system: Click the checkbox to enable this option.
- In case of an alert, bring the application : Click the checkbox to enable this option.
Queues tab
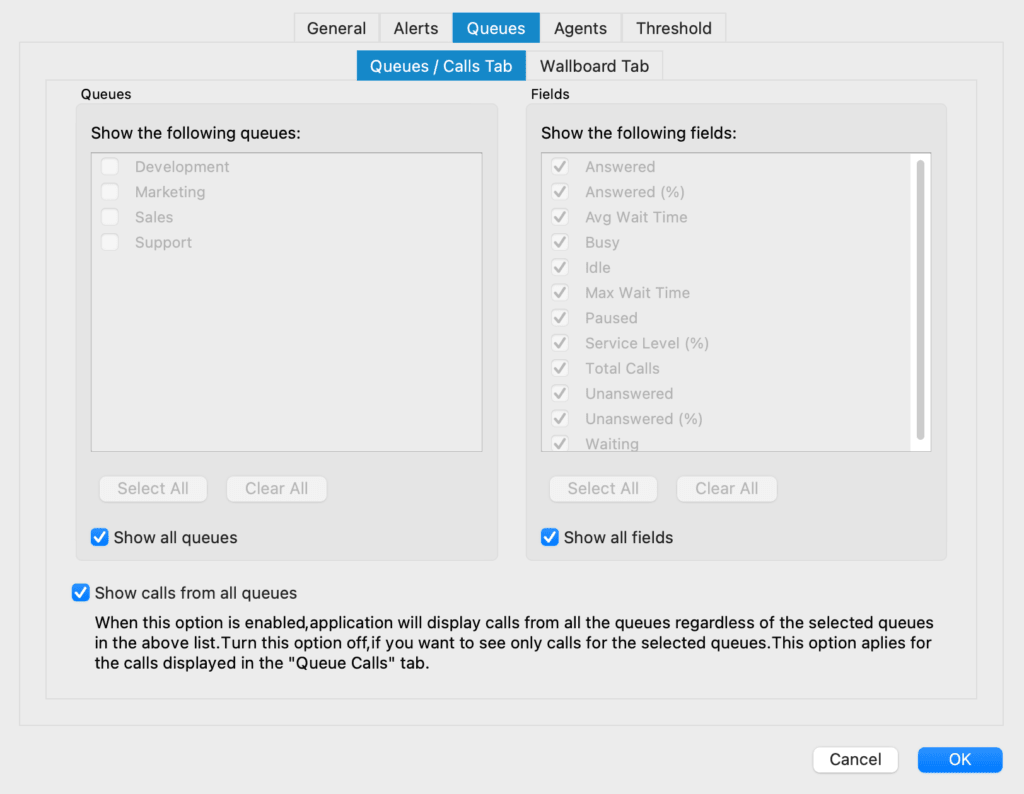
1. Queues/calls
In the Queues/Calls tab, you can select the queues or fields that will be visible in the supervisor panel, inside the Queues module.
- Select all: select all queues/fields in the list of visible queues/fields.
- Clear all: Clear the selection of all queues/fields in the list of visible queues/fields.
There are also Show all queues and Show all fields options if you want all queues/fields to be displayed in the Queues module.
- Show calls from all queues: if this option is selected, the application will display calls from all queues, regardless of the queues selected in the list above. Otherwise, you will only see calls for the selected queues. This option applies to calls displayed in the Queued Calls tab.
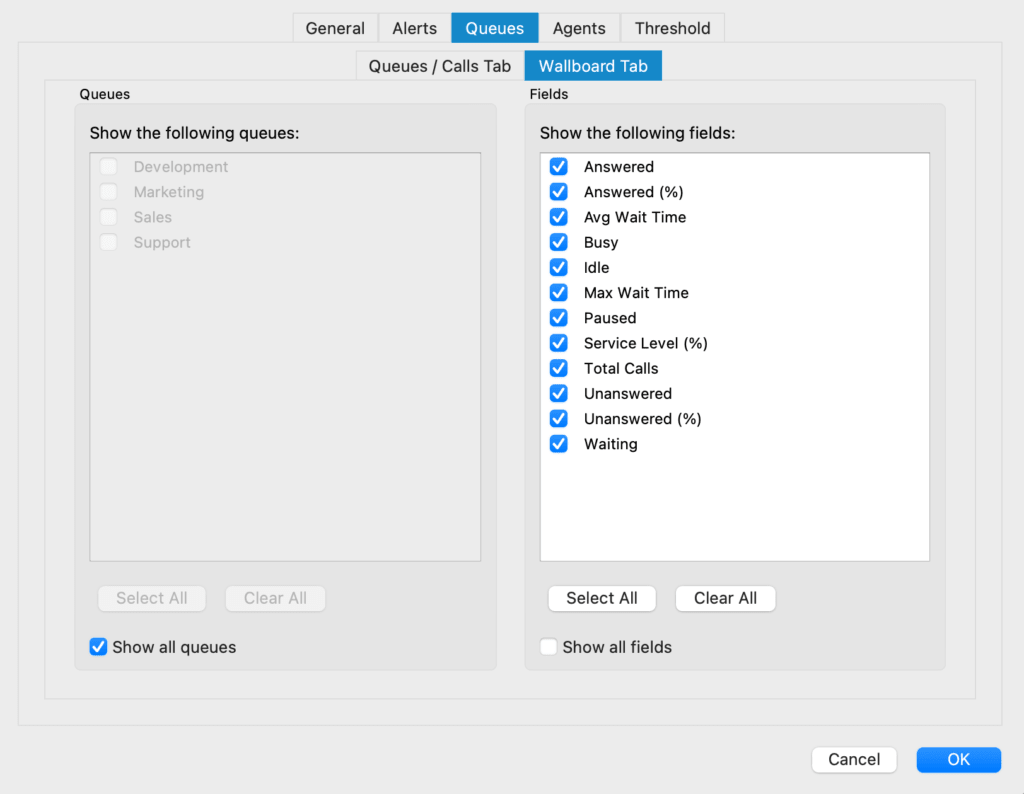
2. Wall panel
In the Wallboard tab, you can select the queues or fields that will be visible in the supervisor panel, in the Wallboard module.
- Select all: select all queues/fields in the list of visible queues/fields.
- Clear all: Clear the selection of all queues/fields in the list of visible queues/fields.
There are also Show all queues and Show all fields options if you want all queues/fields to be displayed in the Wallboard module.
Agents tab
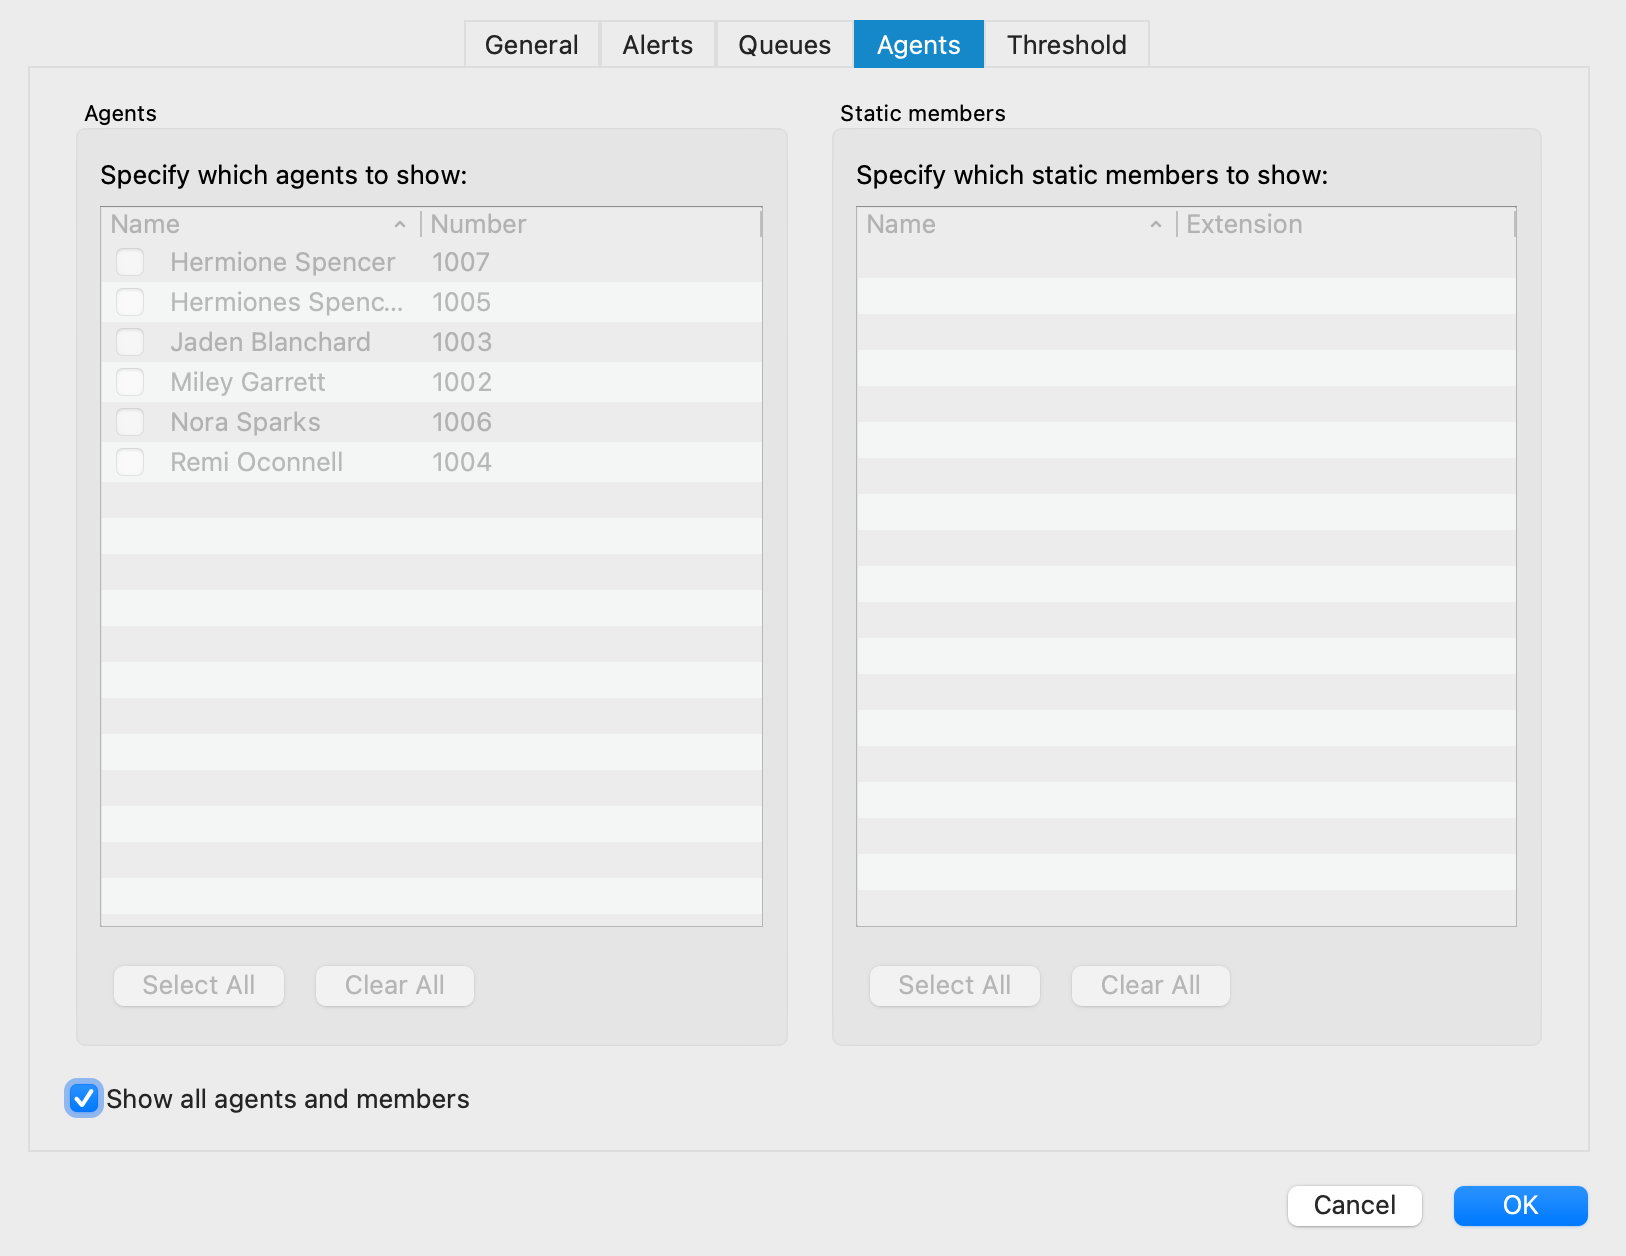
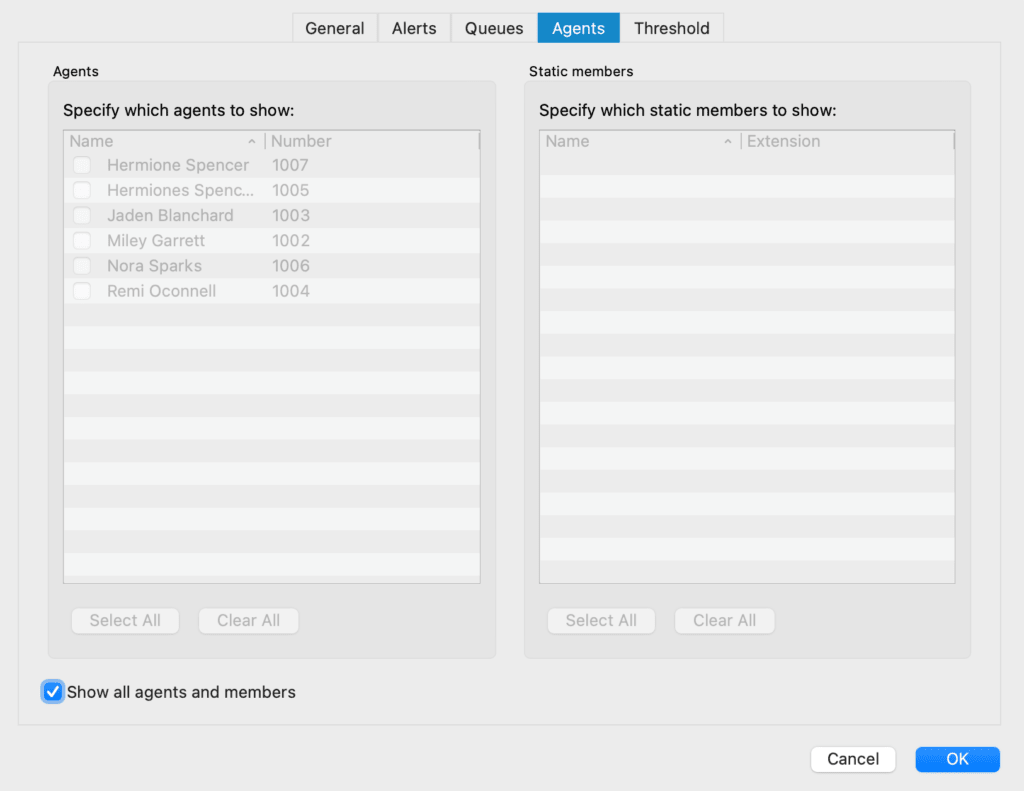
In the Agents tab, you can select which agents or static members will be visible in the supervisor panel, in the Agents module.
- Select all: select all static agents/members in the list of visible static agents/members.
- Clear all: Clear the selection of all static agents/members in the list of visible static agents/members.
There is also a Show all agents and members option if you want all agents/members to be displayed in the Agents module.
Threshold
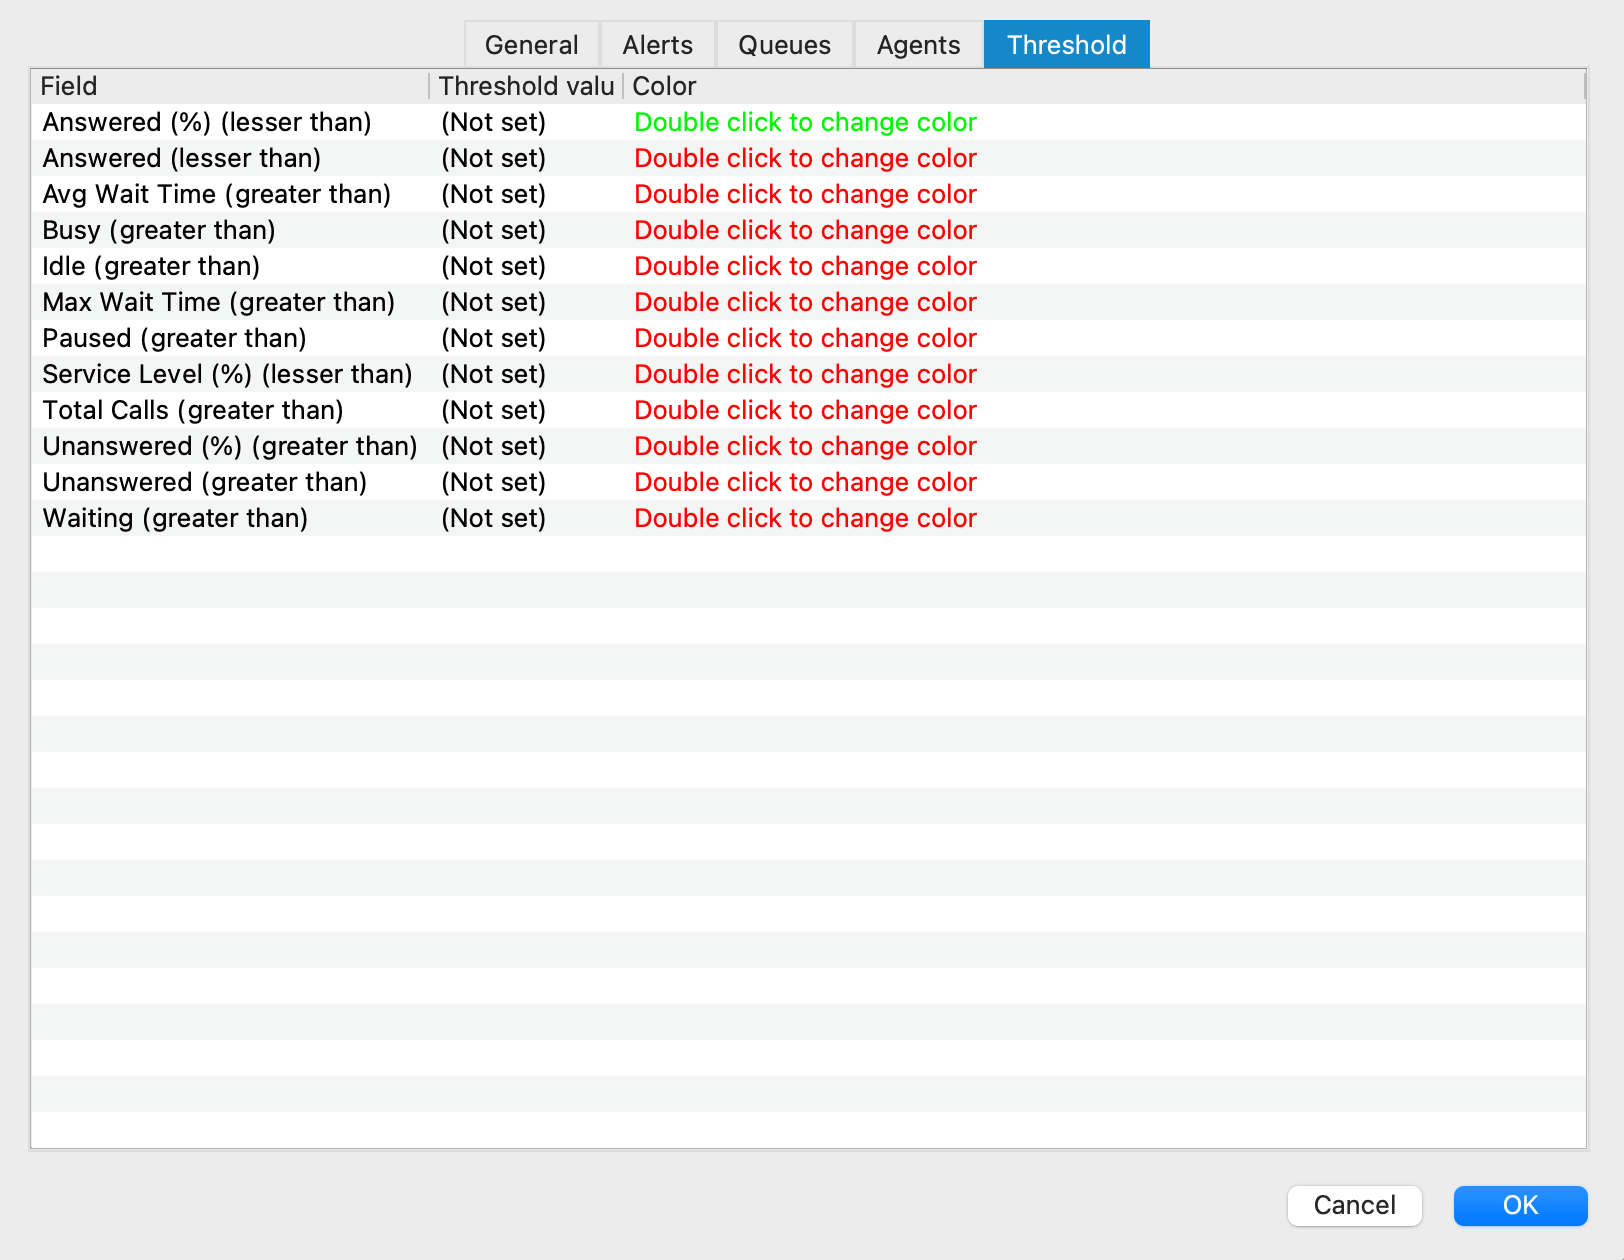
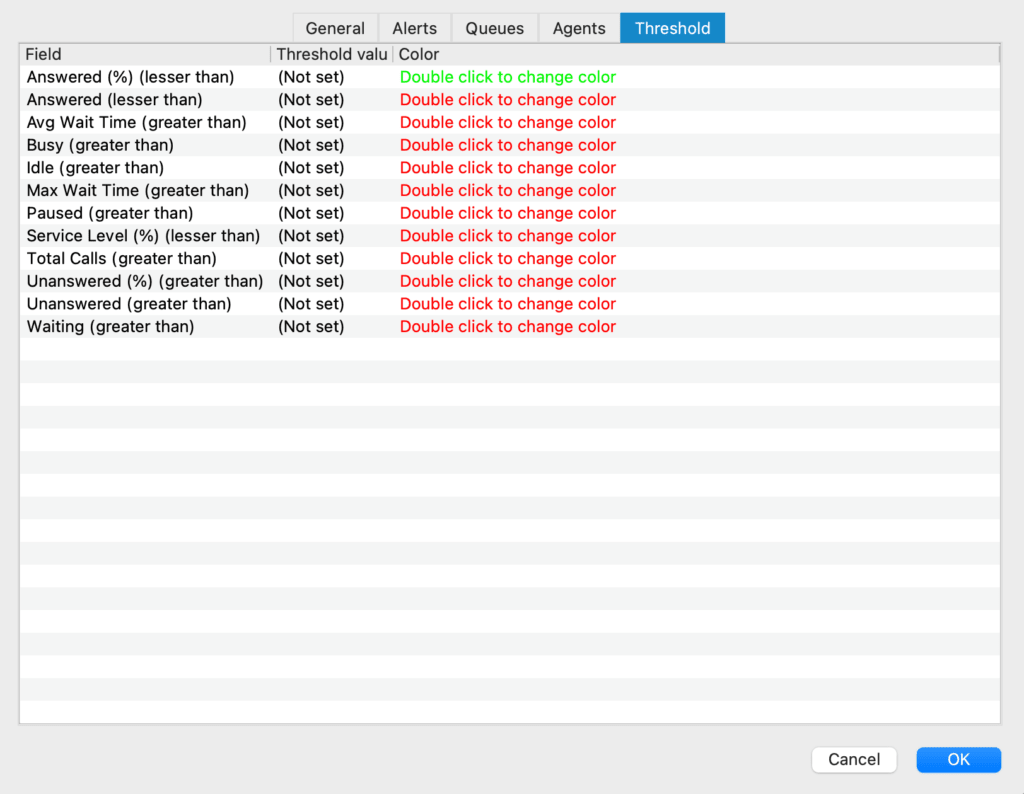
- Field: Various fields are displayed, such as Answered, Busy, Idle, Paused, Unanswered, On hold, Service level (%), etc.
- Threshold value: defines the value of a particular event.
- Color: defines the color that will be used for a particular event if the threshold value is set.
Monitoring modules
Users can decide which tabs they want to see in the supervision panel. All tabs are displayed by default, as before.
All tabs are stored on the server, so the user does not need to customize the tabs each time they log in.
Tabs are saved per account, and if the server does not support saving tabs, they will be saved locally.
After updating the server, when the user logs in for the first time, the locally saved tabs will be saved on the server so that the user does not have to customize the tabs again. Local storage is used only when the server does not support tab storage.
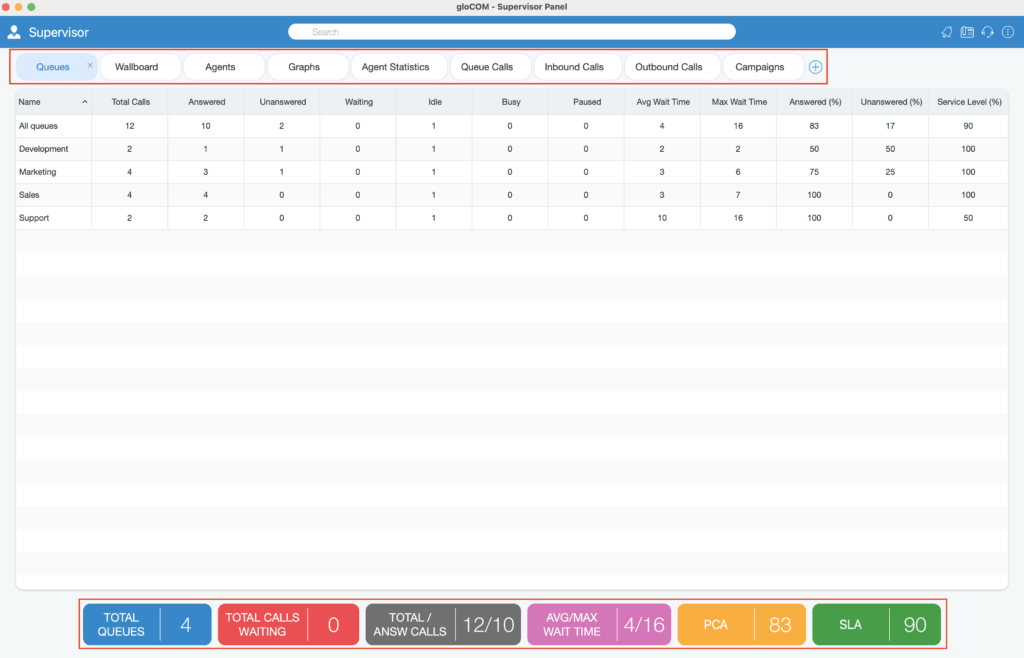
Add a new tab: a new option + has been added. It can be used to add a new tab. When the user clicks the + button, a new window with the following information is displayed:
- Type: Default dashboard.
- Subtype: the user can choose one of the subtypes from the drop-down menu.
- Tab name: The user can name the tab however they like, and if the user enters nothing, the tab will be named automatically by default. ( For a custom tab name, the maximum length is 100 characters )
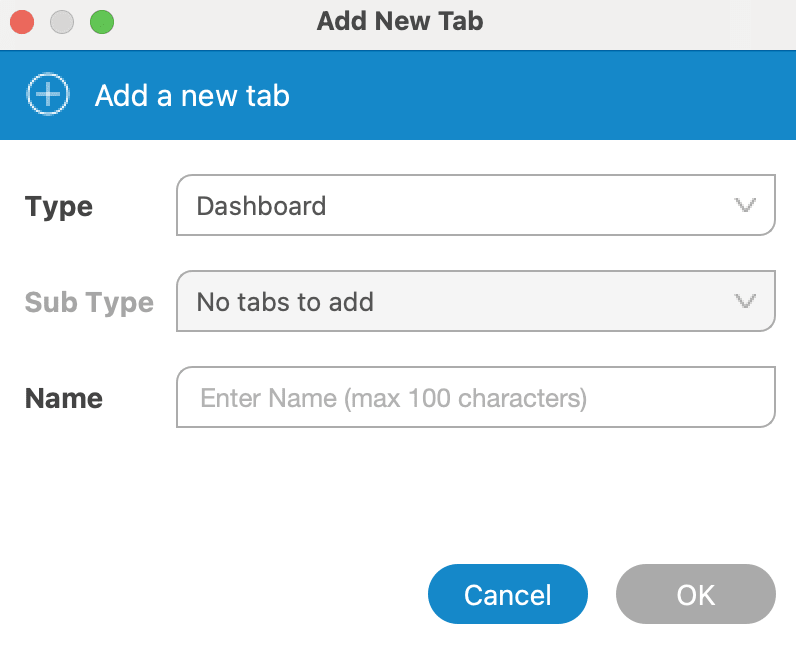
The user will not be able to add a new tab if the maximum number of tabs (9) has been reached.
- Rename tab: The user can rename the existing tab by right-clicking on the tab.
- Delete the existing tab: each tab can also be easily removed by clicking the X button.
- Reorder tabs: It is also possible to change the order of the tabs, simply by grabbing the tab and dragging it to another location.
If the user’s license does not support the Dialer option, the user will not be able to add the Campaigns tab.
Queues
Inside the queues module, the supervisor can monitor real-time information for all selected queues via the dialog box Preferences.
- Total calls: represents the total number of calls during the day (answered + unanswered).
- Answered calls: represents the total number of calls answered during the day.
- Unanswered calls: represents the total number of unanswered calls during the day.
- Calls on hold: represents the total number of calls waiting in the queue that a free agent must answer.
- Idle members: represents the total number of idle agents.
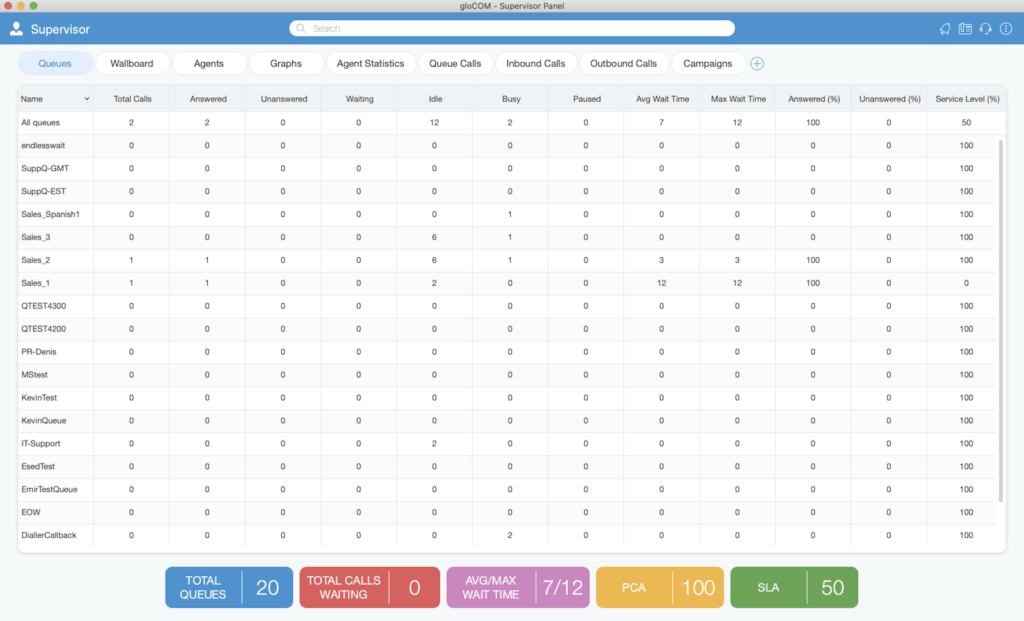
- Busy members: represents the total number of busy agents.
- Paused members: represents the total number of paused agents.
- Average wait time (AWT) (in seconds): represents the average time callers must wait to reach an agent.
- Maximum wait time (MWT) (in seconds): represents the maximum time callers must wait to reach an agent.
- Answered calls (%): represents the percentage of calls answered during the day.
- Unanswered calls (%): represents the percentage of unanswered calls during the day.
- Service level (%): represents the percentage of calls that received an answer within a specified time period. The service level can be configured in the Preferences window.
The Queues module displays queue statistics for the current day.
Wall panel
In the module Wall panel, the supervisor can monitor real-time information for all selected queues via the dialog box Preferences.
The Wall panel is displayed in a large format intended for use with televisions or other large screens.
For each queue, the following information is displayed:
- Total calls: represents the total number of calls during the day (answered + unanswered).
- Answered calls: represents the total number of calls answered during the day.
- Unanswered calls: represents the total number of unanswered calls during the day.
- Calls on hold: represents the total number of calls waiting in the queue that a free agent must answer.
- Idle agents: represents the total number of idle agents.
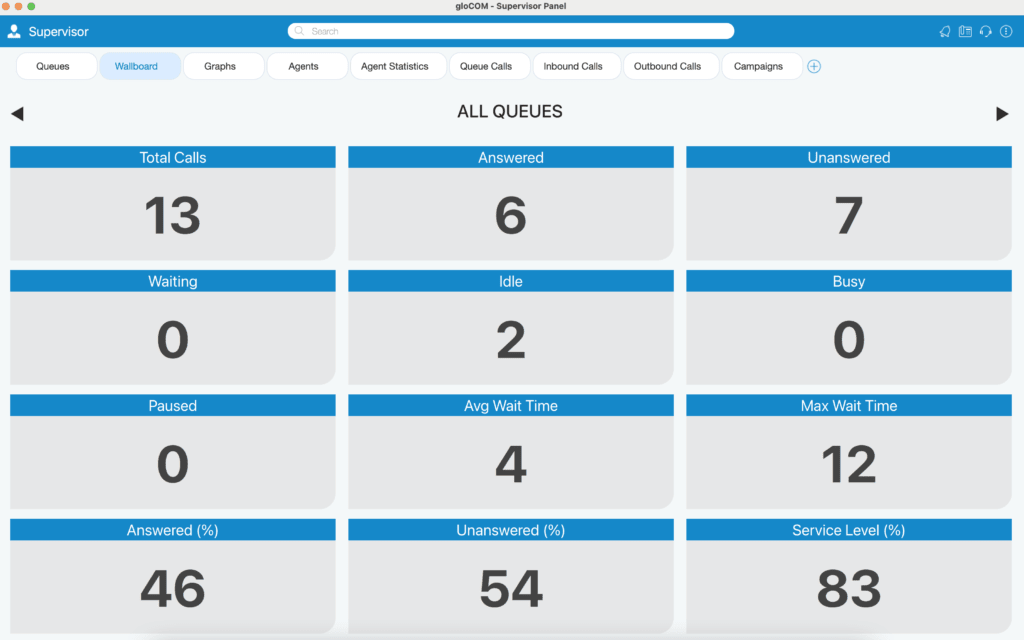
- Busy agents: represents the total number of busy agents.
- Agents on pause: represents the total number of paused agents.
- Average wait time (AWT) (in seconds): represents the average time callers must wait to reach an agent.
- Maximum wait time (MWT) (in seconds): represents the maximum time callers must wait to reach an agent.
- Answered calls (%): represents the percentage of calls answered during the day.
- Unanswered calls (%): represents the percentage of unanswered calls during the day.
- Service level (%): represents the percentage of calls that received an answer within a specified time period. The service level can be configured in the Preferences window.
Agents
In the Agents module, the supervisor can monitor the information of all selected logged-in agents via the Preferences dialog box.
For each agent, the following information is displayed:
- Agent name: represents the agent's name. If the supervisor clicks on the agent's name, the Agent Information dialog box will be displayed.
- Agent ID: represents the agent number.
- Agent status: represents the current state of an agent (idle, paused, busy, etc.).
- Time in state: represents the duration for which the agent has been in the current state.
- Unique call ID: represents the unique identification number of a call.
- Call direction: outbound, inbound.
- Call type: regular call, queue call, campaign call.
- Call information: represents the call information (call number, project code, etc.).
- Connection duration: represents the duration for which the agent is logged in.
- Connection type: the agent's connection type.
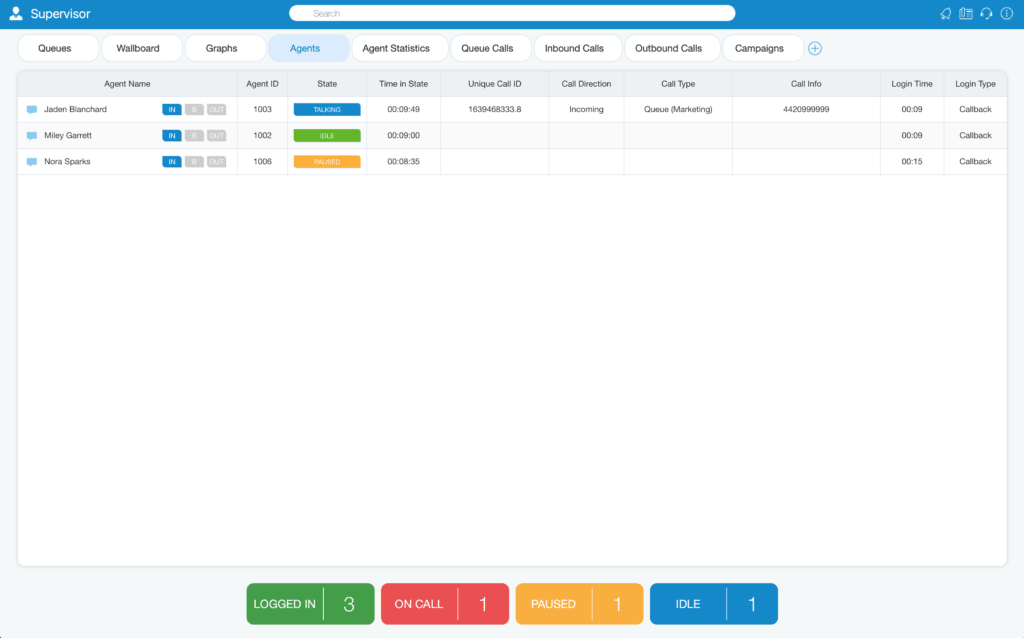
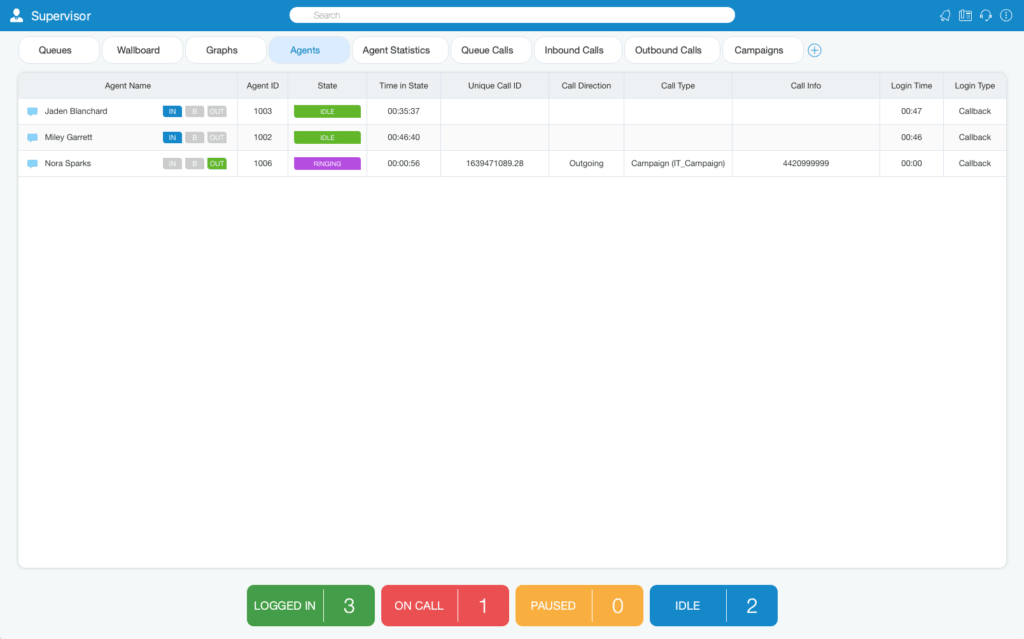
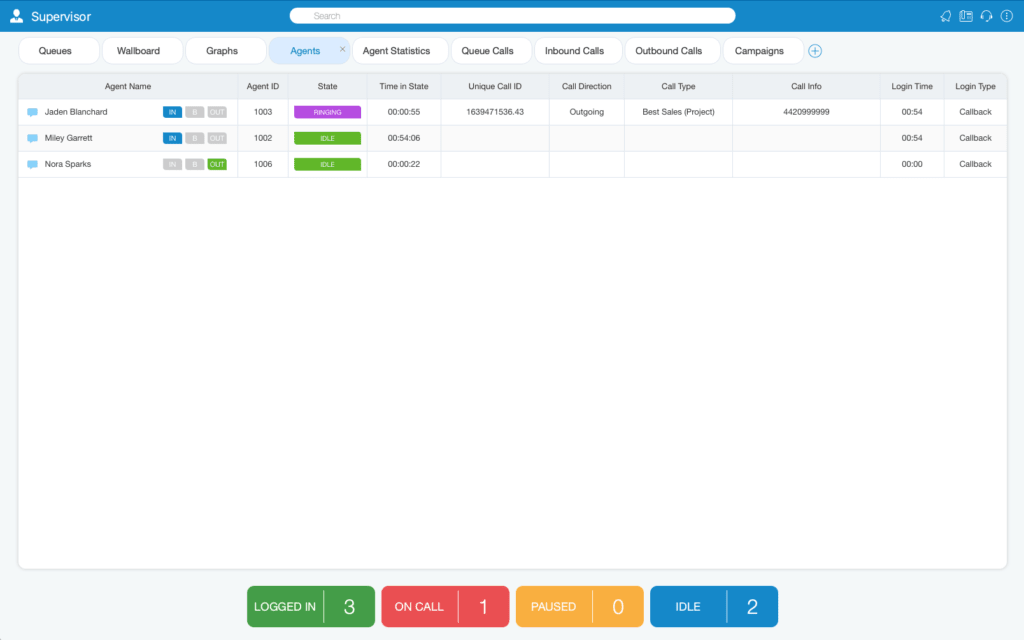
As of version 6.0, it is possible to see the agent's direction and the merge option in real time. The supervisor can change the direction of any agent by clicking the direction buttons. In addition, the supervisor can see which project code each agent is using for their ongoing calls, and it is possible to monitor dialer calls and campaigns from the Agents module.
Charts
The Charts module displays real-time call statistics in the form of charts.
The following information is displayed:
- Total calls: represents the total number of calls during the day.
- Answered calls: represents the total number of calls answered during the day.
- Unanswered calls: represents the total number of unanswered calls during the day.
- Maximum/average wait time (in seconds): represents the maximum/average wait time callers must wait to reach an agent.
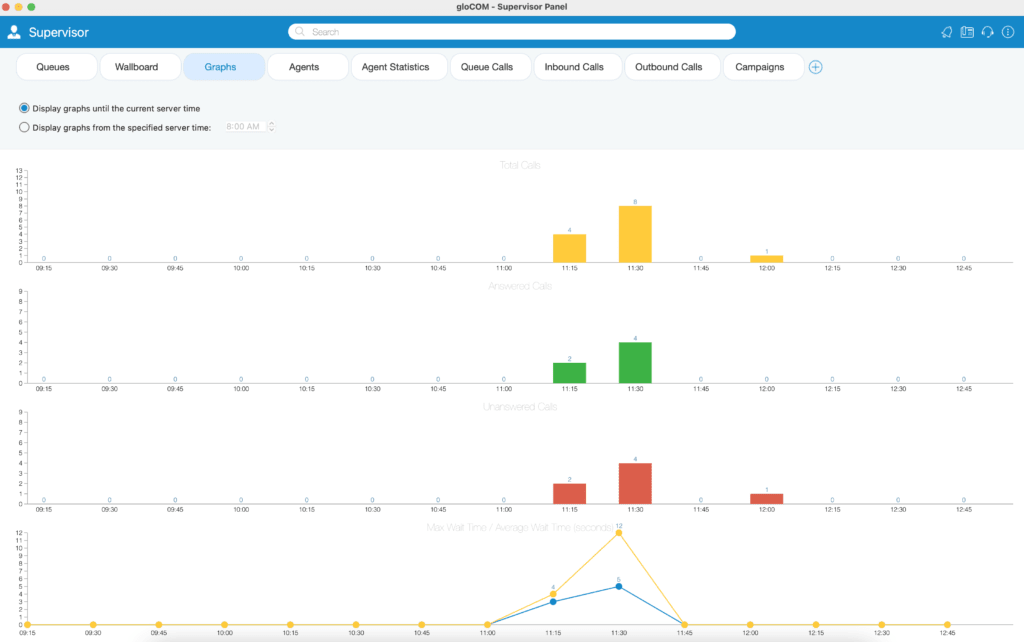
In addition, the user can choose whether to display the charts up to the current server time or display the charts starting from the specified server time.
Agent statistics
Before version 6.0, only inbound agent statistics (in real time) were available.
The Agent Statistics module now displays the agent's incoming and outgoing statistics that include all of the agent's calls (incoming, outgoing, direct in/out) in the calculations. The calculations are reset every day starting from midnight.
For each agent, the following information is displayed:
- Agent name and number: this section displays the agent's name and number.
- Calls: all calls answered by the agent.
- Total: represents the total number of calls.
- Answered: represents the total number of answered calls.
- No answer: represents the total number of unanswered calls.
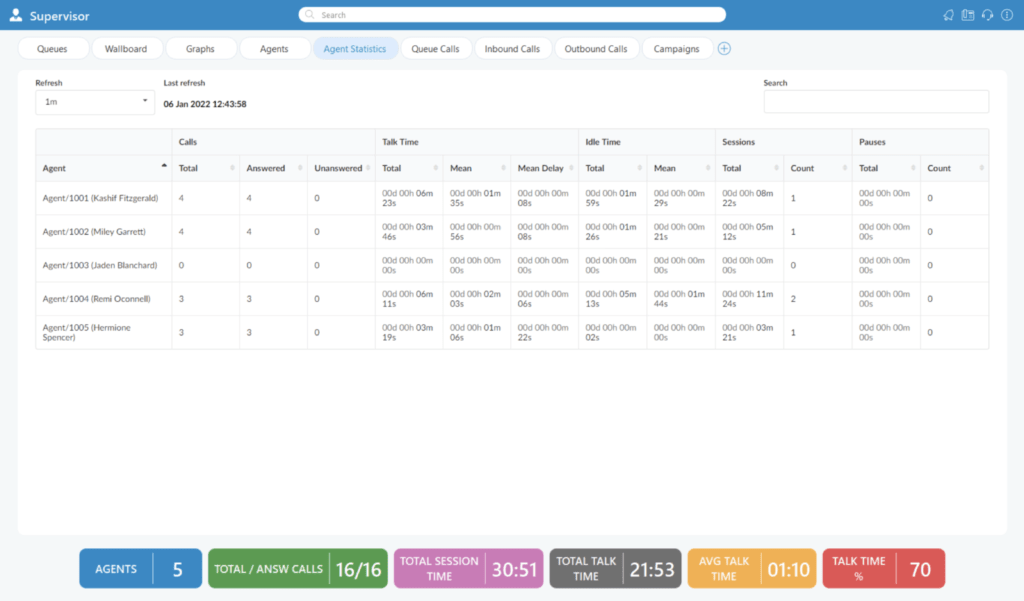
- Talk time: agent talk time.
- Total: represents the total talk time.
- Average: average/mean agent talk time.
- Average delay: average/mean caller wait time before the agent answers.
- Idle time: agent idle time (callback agents only).
- Total: total agent idle time (when the agent is not busy).
- Average: average/mean agent idle time.
- Sessions: Time the Agent was logged in to the queue.
- Total: total agent connection duration.
- Number: number of agent sessions.
- Pauses: represents the time spent by the agent on pause
- Total: total time during which the agent was on pause.
- Account: Number of pauses.
It is possible to set the refresh time to the desired value to keep the statistics up to date.
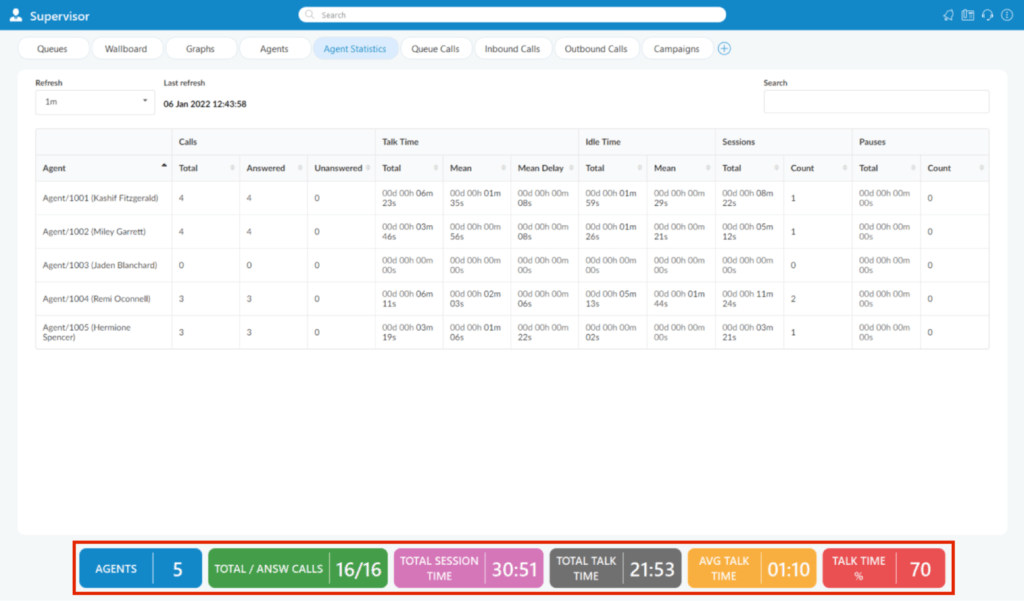
Furthermore, the labels at the bottom of the page indicate the total number of agents, the total number of calls/answered, the total session duration, the total talk duration, the average talk duration, and the talk duration (%).
More information about these labels can be found in the tab Agent statistics.
Queued calls
In the Queue Calls module, the supervisor can monitor the call information of all the queues they select to be visible via the Preferences dialog box.
For each call, the following information is displayed:
- Call ID: represents the call identification number.
- Queue name: displays the queue name.
- Queue number: displays the queue number.
- Caller ID: represents the caller's DID number.
- Status: represents the current state of the call.
- Time in state: total time in the current state.
- Position in the queue: represents the position number in the queue.
- Estimated response time: displays the estimated answer time.
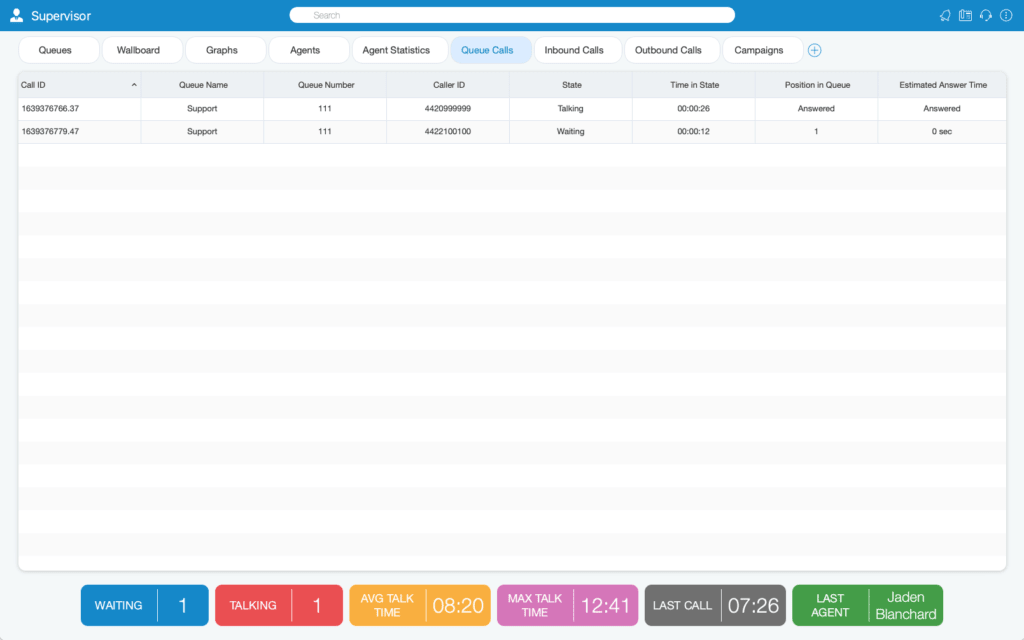
The supervisor can perform the following operations for each call if they have the permissions:
- Transfer the call: the supervisor can transfer the selected call.
- Answer a call: the supervisor can take the selected call.
- Monitor the call: the supervisor can monitor the selected call.
Outbound calls
In the Outbound Calls module, the supervisor can monitor the information on all calls going out of the system.
For each call, the following information is displayed:
- Call author: displays the call sender (agent, dialer, project).
- Network line: displays the network lines used for calls.
- Destination number: displays the DID number of the outbound call.
- Location: displays the location type.
- Location name: represents the location name.
- Location number: represents the location number.
- Call duration: represents the total call duration.
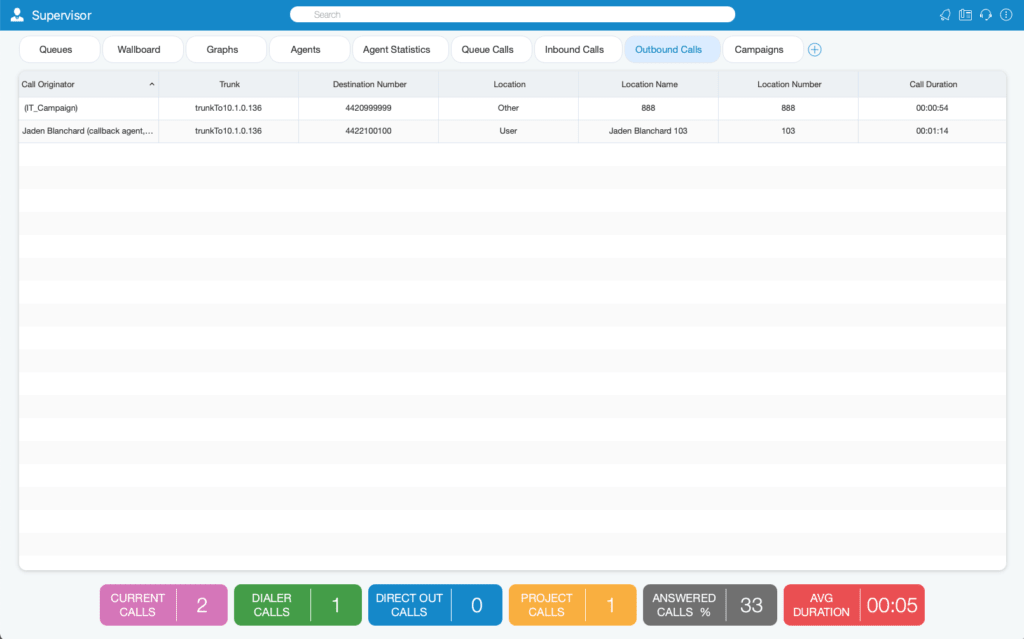
The supervisor can perform the following operations for each call if they have the permissions:
- Transfer the call: the supervisor can transfer the selected call.
- Answer a call: the supervisor can take the selected call.
- Monitor the call: the supervisor can monitor the selected call.
- Hang up the call: the supervisor can hang up the selected call.
Campaigns
The Campaigns module displays campaign statistics for the current day.
For each campaign, the following information is displayed:
- Campaign name: displays the campaign name.
- Calls: represents the number of calls dialed, connecting, and connected.
- Dialing: displays the number of dialed calls.
- Login: displays the number of calls currently connecting.
- Connected: displays the number of connected calls.
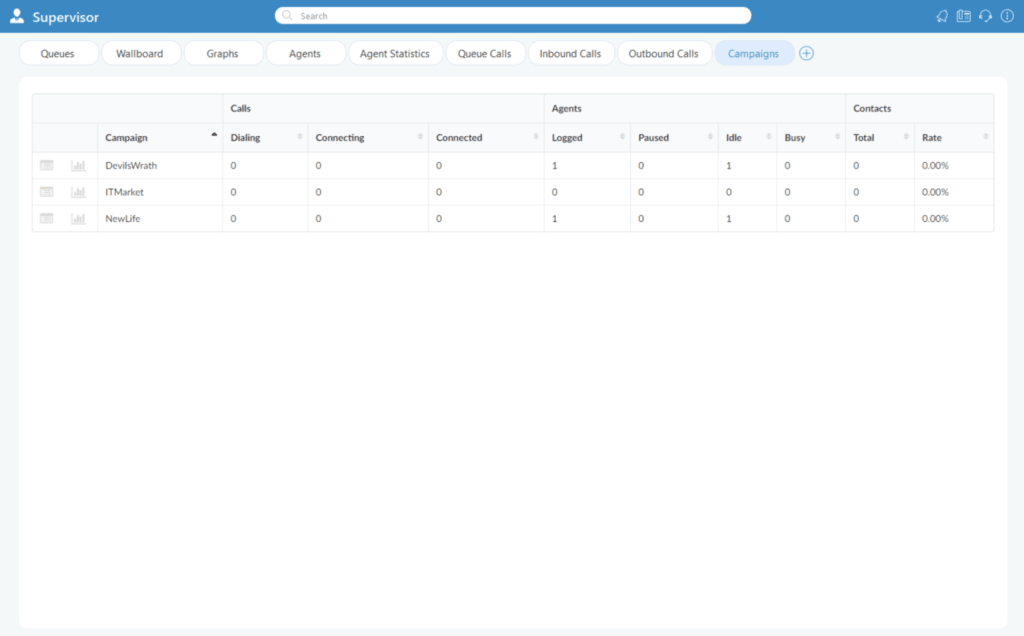
- Agents: displays the number of agents in ongoing campaigns.
- Connected: displays the number of logged-in agents.
- Paused: displays the paused agents.
- Inactive: displays the currently idle agents.
- Busy: displays the number of busy agents.
- Contacts: indicates the successful contacts in the campaigns.
- Total: indicates the total number of successful contacts in the campaigns.
- Rate: refers to the percentage of workload completed in the campaigns.
Real-time statistics
With the current new supervisor design, advanced global statistics have been introduced. These statistics include all system, queue, and agent statistics in real time and can be displayed in different tabs.
For the tabs selected in the supervision panel, specific areas (at the bottom of the panel) display real-time statistics for each tab separately.
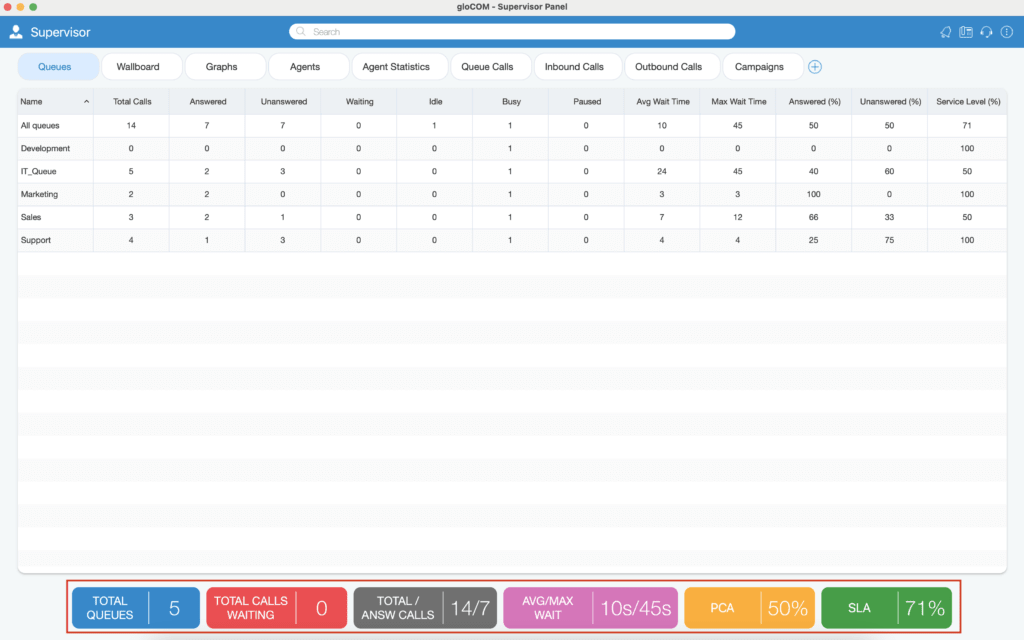
Queues
In the Queues tab, the supervisor can monitor real-time information for all the queues selected via the Preferences dialog box.
For the Queues tab, the following statistics are displayed:
- Total queues: represents the total number of queues on the system.
- Total calls waiting: represents the total number of calls waiting in the queue.
- Total/Answered calls: represents the total number of calls that entered the system and the total number of calls answered by all queues.
- Average wait time (AWT) (in seconds): represents the average time callers must wait to reach an agent.
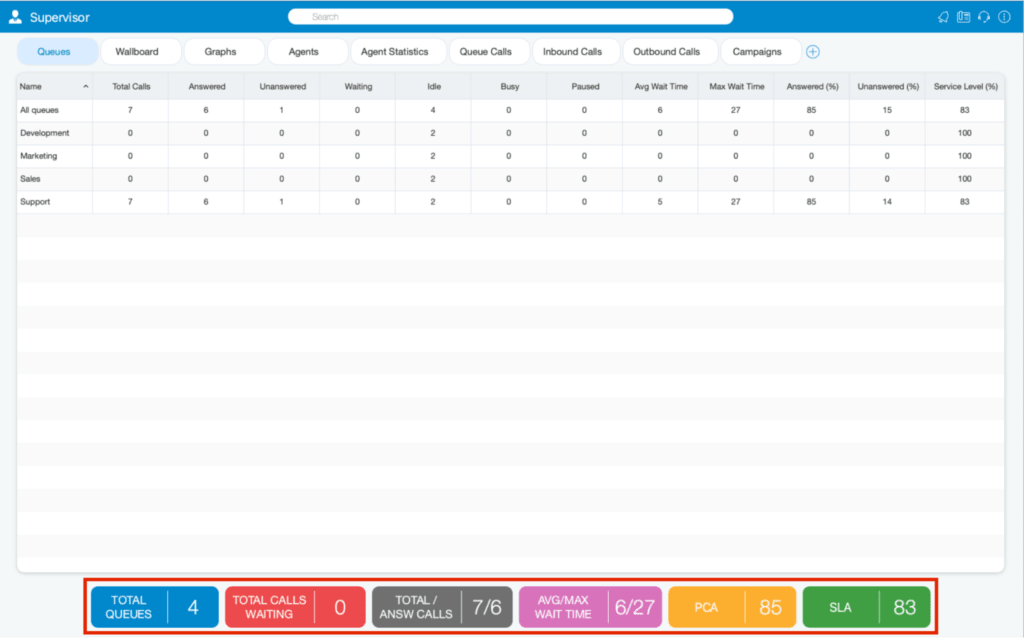
- Maximum wait time (MWT) (in seconds): represents the maximum time callers must wait to reach an agent.
- PCA: represents the percentage of calls answered across all queues.
- SLA (%): represents the percentage of calls that received an answer within a specified time period. The service level can be configured in the Preferences window.
Agents
In the Agents tab, the supervisor can monitor the information of all selected logged-in agents via the Preferences dialog box.
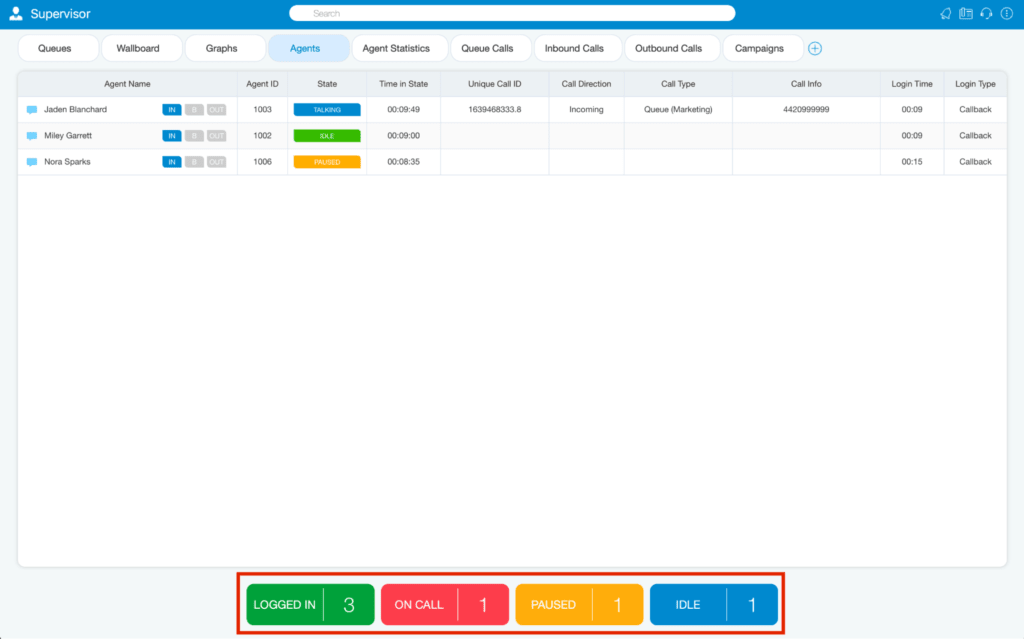
For the Agents module tab, the following statistics are displayed:
- Connected: represents the total number of logged-in agents.
- On call: represents a certain number of on-call agents.
- Paused: represents the total number of paused agents.
- Inactive: represents the total number of idle agents.
Agent statistics
The Agent Statistics tab displays the inbound and outbound agent statistics that include all of the agent's calls (inbound, outbound, direct, ins/outs) in the calculations.
For the Incoming Calls tab, the following statistics are displayed:
- Queued calls: displays the number of all queued calls.
- Conference calls: displays the number of all conference calls.
- IVR calls: displays the number of all IVR calls.
- Extension calls: displays the number of all extension calls.
- Direct input: displays the number of all direct inbound calls.
- Ring groups: displays the number of all ring group calls.
Queued calls
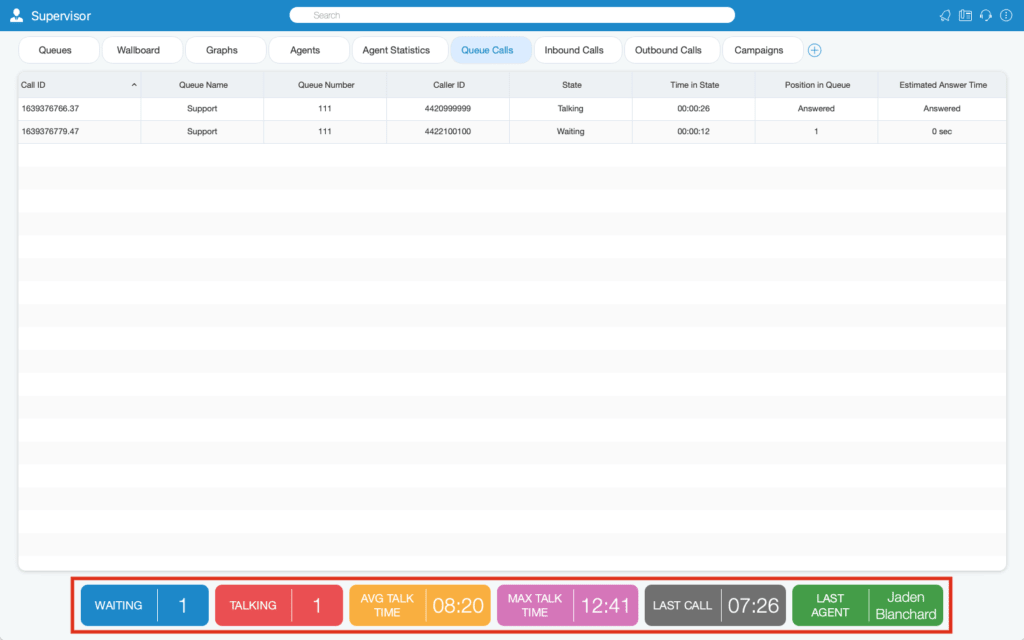
In the Queue Calls tab, the supervisor can monitor the call information of all the queues they select to be visible via the Preferences dialog box.
- On hold: represents the number of callers in the queues.
- In conversation: represents the number of agents currently talking.
- Average talk time: represents the average talk time of all agents.
- Maximum talk time: represents the longest call in the queue.
- Last call: displays the time at which the last call took place.
- Last agent: displays the name of the agent who received the last call.
Inbound calls
In the Queue Calls tab, the supervisor can monitor the call information of all the queues they select to be visible via the Preferences dialog box.
For the Queued Calls tab, the following statistics are displayed:
- On hold: represents the number of callers in the queues.
- Talk: represents the number of agents currently talking.
- Average talk time: represents the average talk time of all agents.
- Maximum talk time: represents the longest call in the queue.
- Last call: displays the time at which the last call took place.
- Last agent: displays the name of the agent who received the last call.
Inbound calls
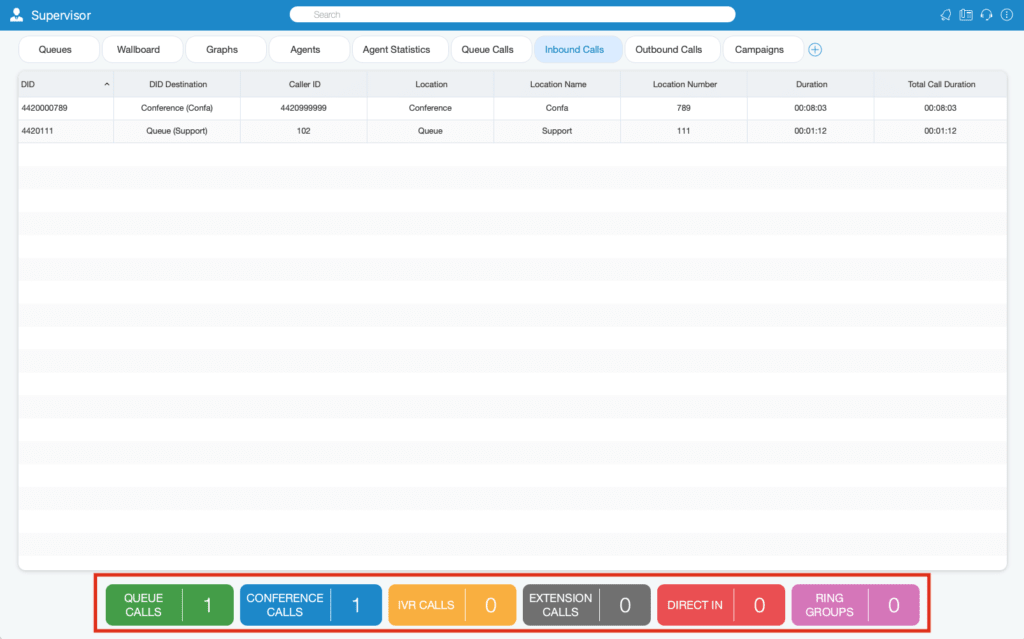
In the Inbound Calls module, the supervisor can monitor the information on all calls coming into the system.
For the Incoming Calls tab, the following statistics are displayed:
- Queued calls: displays the number of all queued calls.
- Conference calls: displays the number of all conference calls.
- IVR calls: displays the number of all IVR calls.
- Extension calls: displays the number of all extension calls.
- Direct input: displays the number of all direct inbound calls.
- Ring groups: displays the number of all ring group calls.
Outbound calls
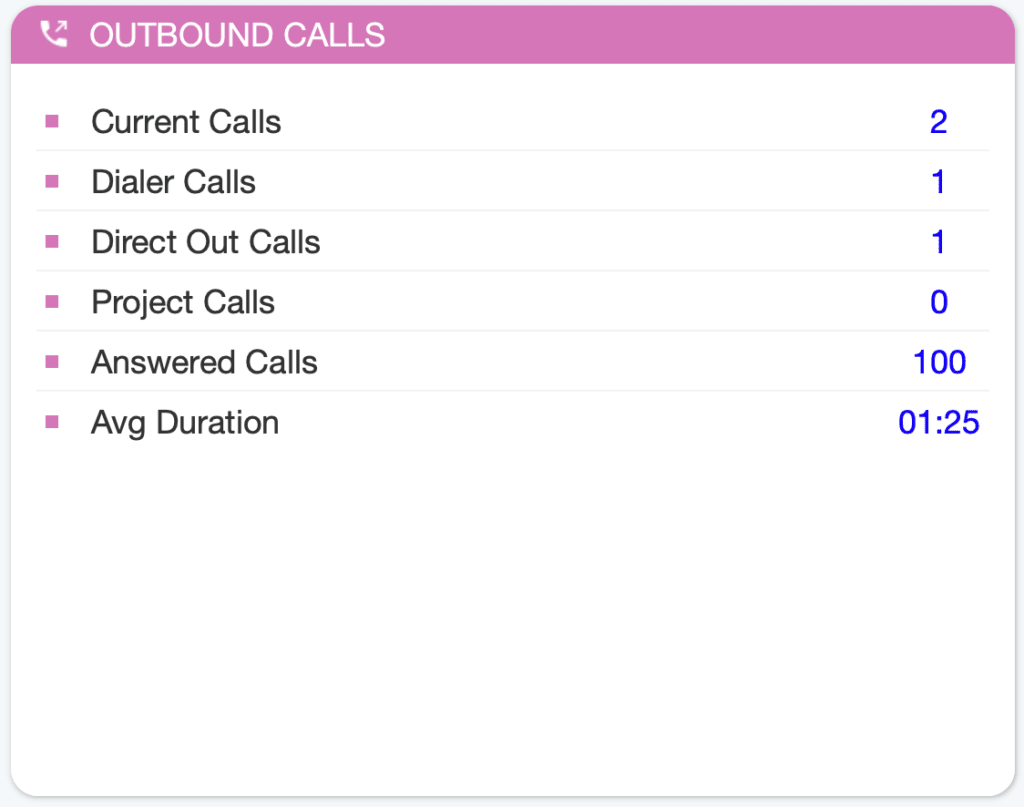
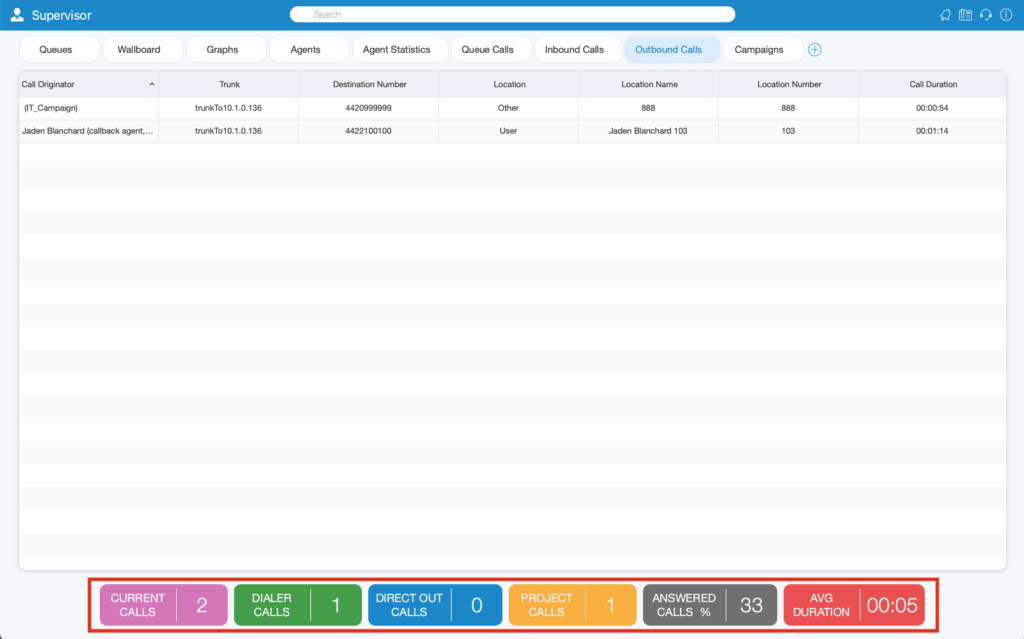
In the Outbound Calls module, the supervisor can monitor the information on all calls going out of the system.
For the Outgoing Calls tab, the following statistics are displayed:
- Calls in progress: displays the number of ongoing calls.
- Dialer calls: displays the number of dialer calls.
- Direct calls: displays the number of direct calls.
- Project calls: displays the number of project calls.
- Answered calls (%): represents the percentage of calls answered during a day (from midnight).
- Average duration: represents the average call duration.
Supervisor overview
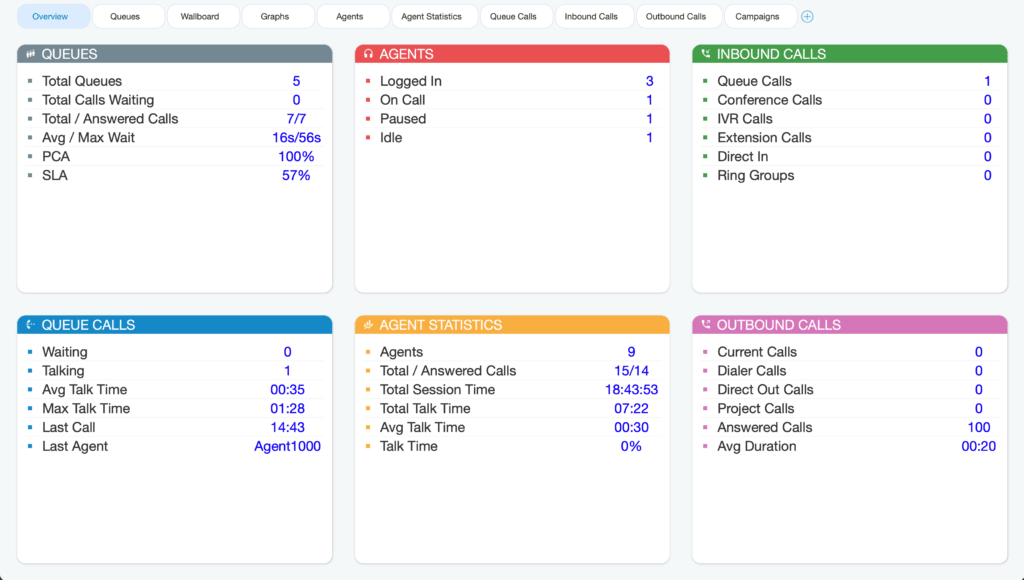
The user can get an overview of all the supervisor agent tabs inside the Overview tab in a single place, organized as a dashboard where all the information is easily accessible in one place.
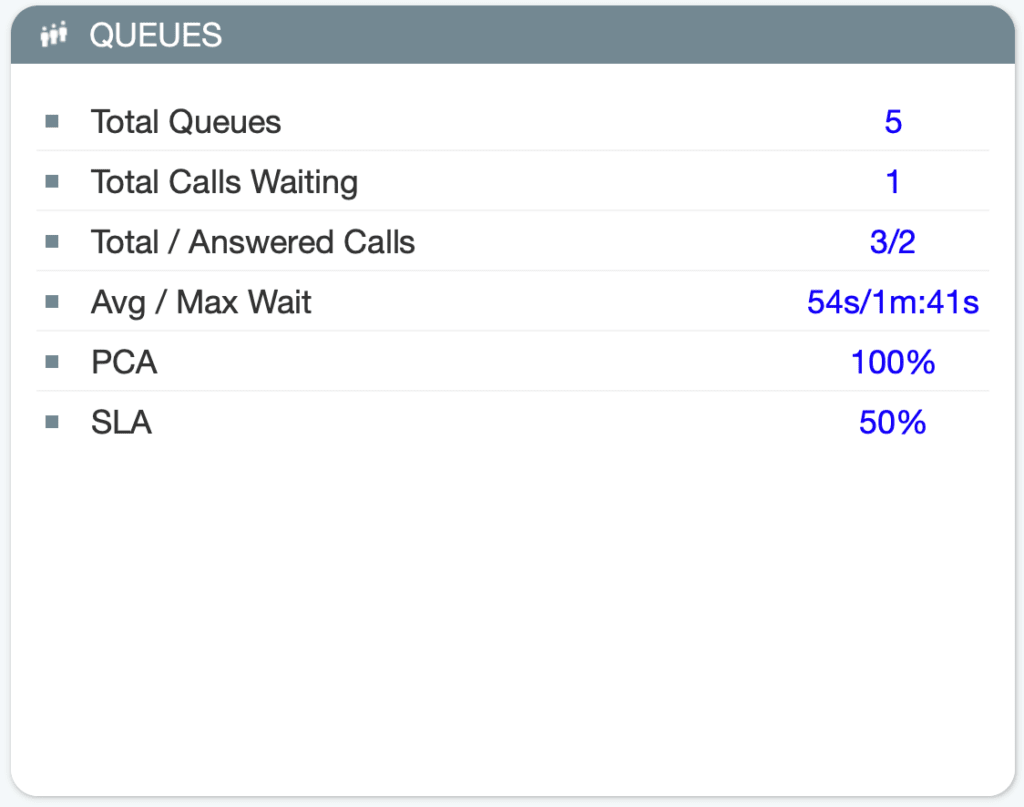
Overview of queues
- Total queues: represents the total number of queues on the system.
- Total calls waiting: represents the total number of calls waiting in the queue.
- Total/Answered calls: represents the total number of calls that entered the system and the total number of calls answered by all queues.
- Avg/Max Wait: represents the average time callers must wait to reach an agent.
- PCA: represents the percentage of calls answered across all queues.
- SLA: represents the percentage of calls that received an answer within a specified time period. The service level can be configured in the Preferences window.
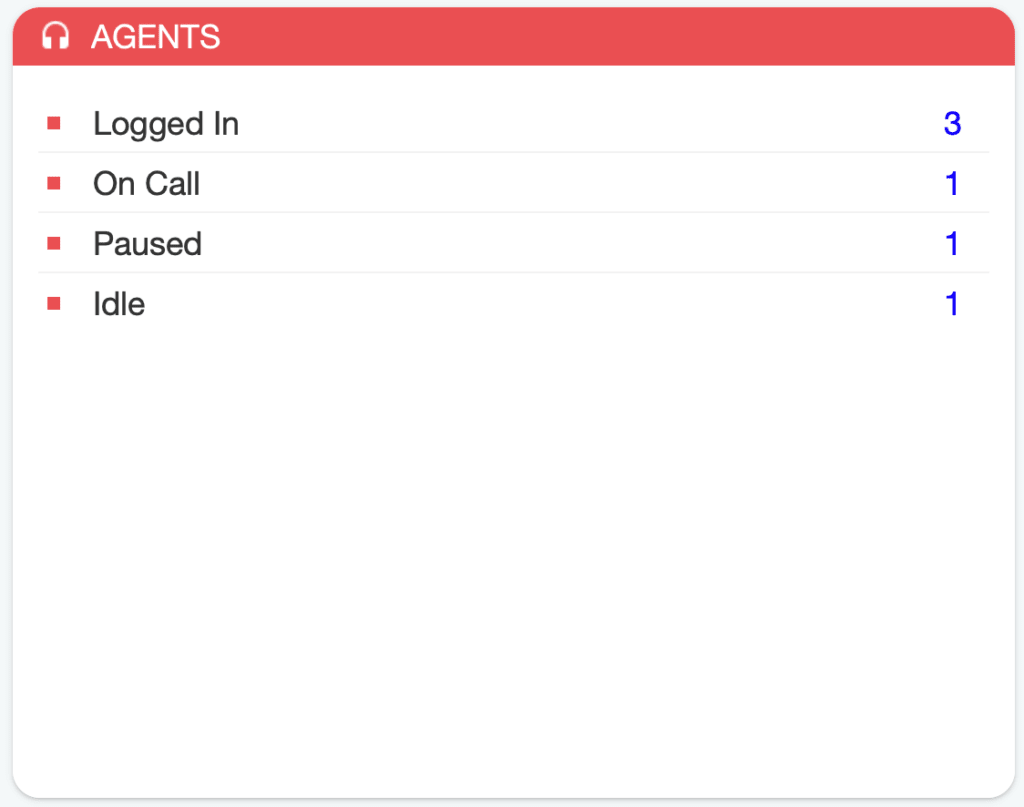
Agents overview
- Connected: represents the total number of logged-in agents.
- On call: represents a certain number of on-call agents.
- Paused: represents the total number of paused agents.
- Inactive: represents the total number of idle agents.
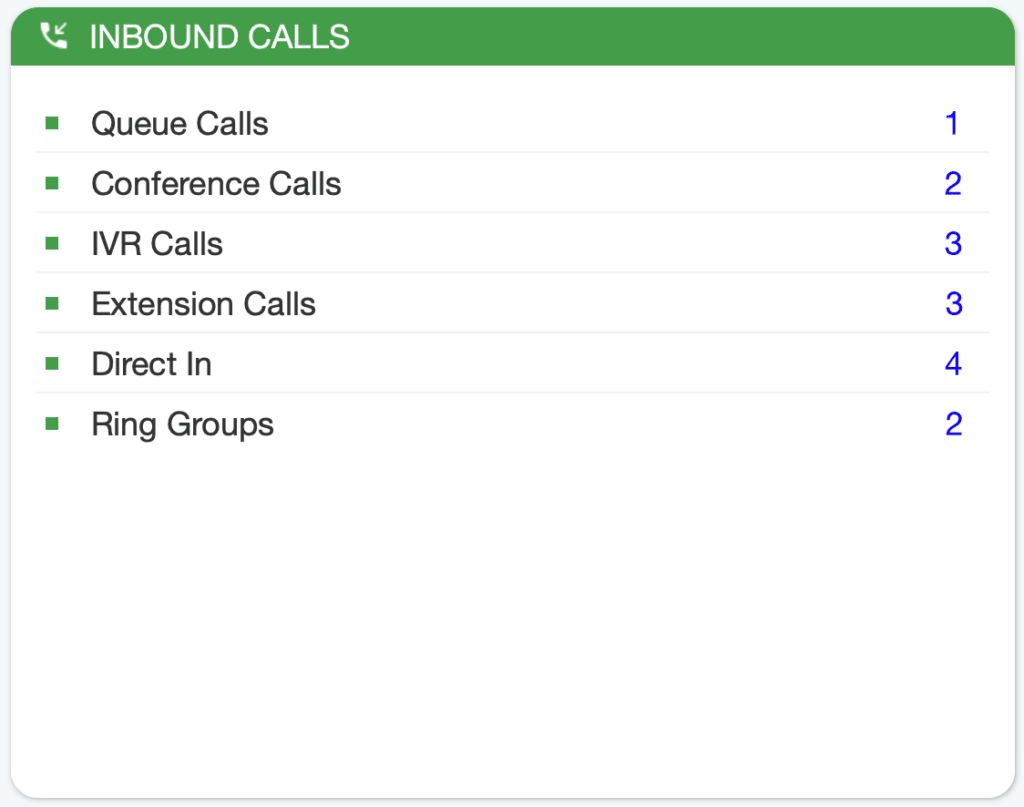
Overview of incoming calls
- Queue calls: represents the total number of simultaneous inbound calls per queue.
- Conference calls: represents the total number of simultaneous inbound conference calls.
- IVR calls: represents the total number of simultaneous inbound calls per IVR.
- Extension calls: represents the total number of simultaneous inbound calls per extension.
- Direct inbound: represents the total number of simultaneous inbound calls per agent.
- Call groups: represents the total number of simultaneous inbound calls per ring group.
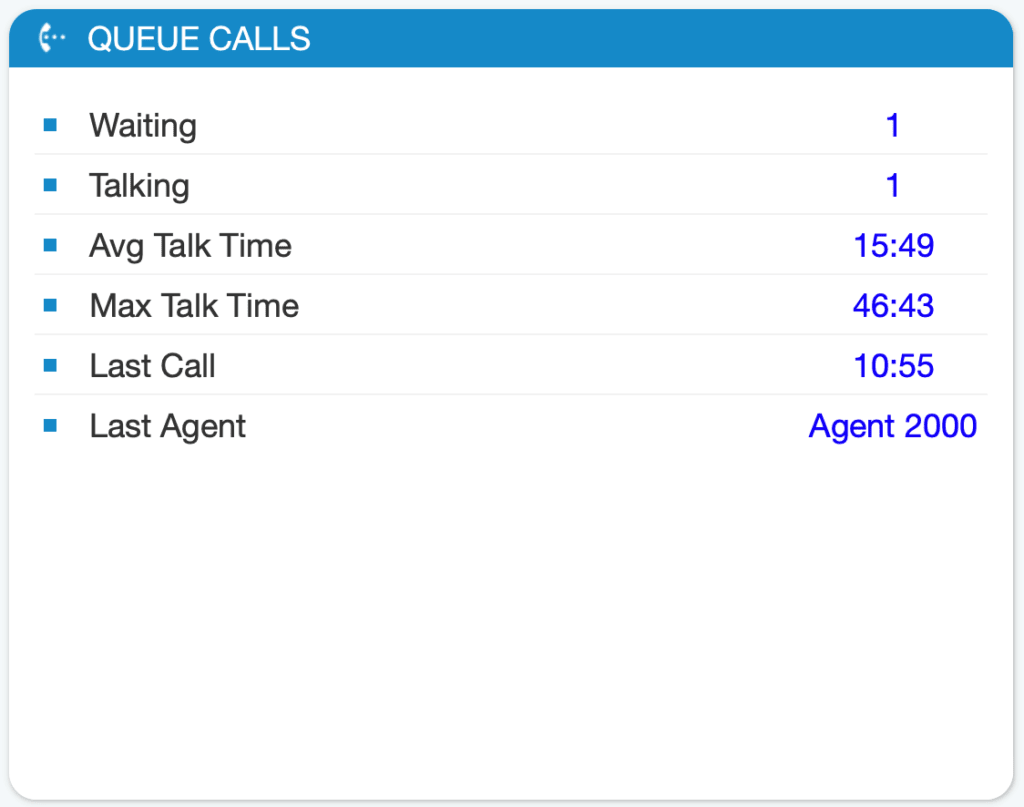
Overview of queued calls
- On hold: represents the total number of simultaneous calls waiting to be answered in the queue.
- Talk: represents the number of agents currently talking.
- Average talk time: represents the average talk time for all queues.
- Maximum talk time: represents the longest call in the queue.
- Last call: displays the time at which the last call took place.
- Last agent: displays the name of the agent who received the last call.
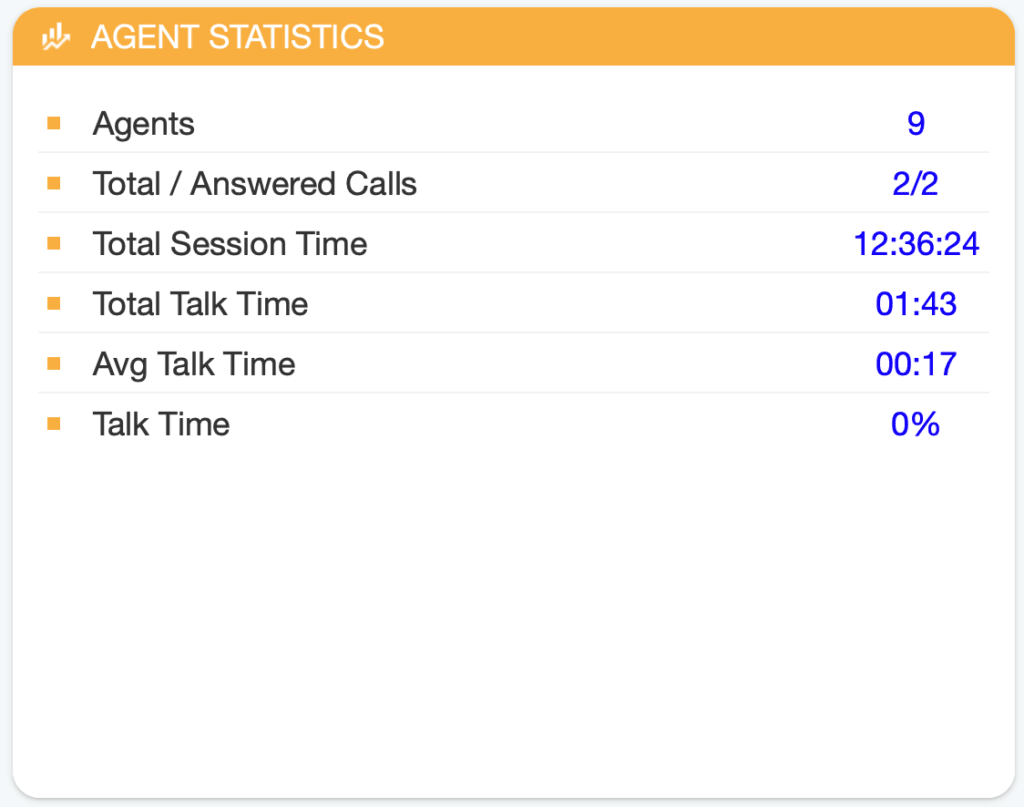
Overview of agent statistics
- Agents: represents the total number of agents on the system.
- Total/Answered calls: represents the total number of all answered agent calls.
- Total session duration: represents the total login duration of all agents.
- Total talk time: represents the total talk time of all agents.
- Average talk time: represents the agent's average talk time.
- Talk time: represents the talk-time percentage of all agents.
Overview of outgoing calls
- Calls in progress: displays the number of ongoing calls.
- Dialer calls: displays the number of dialer calls.
- Direct calls: represents the total number of direct calls.
- Project calls: represents the total number of simultaneous calls per project code.
- Answered calls: represents the percentage of calls answered during a day (from midnight).
- Average duration: represents the average call duration.