



5. Dashboard
The SERVERware network dashboard is a visual interface displaying the most important performance indicators of a SERVERware network. Since the storage server is a critical element of a SERVERware network, most of the dashboard's performance indicators (widgets) reflect the state of the storage server itself.
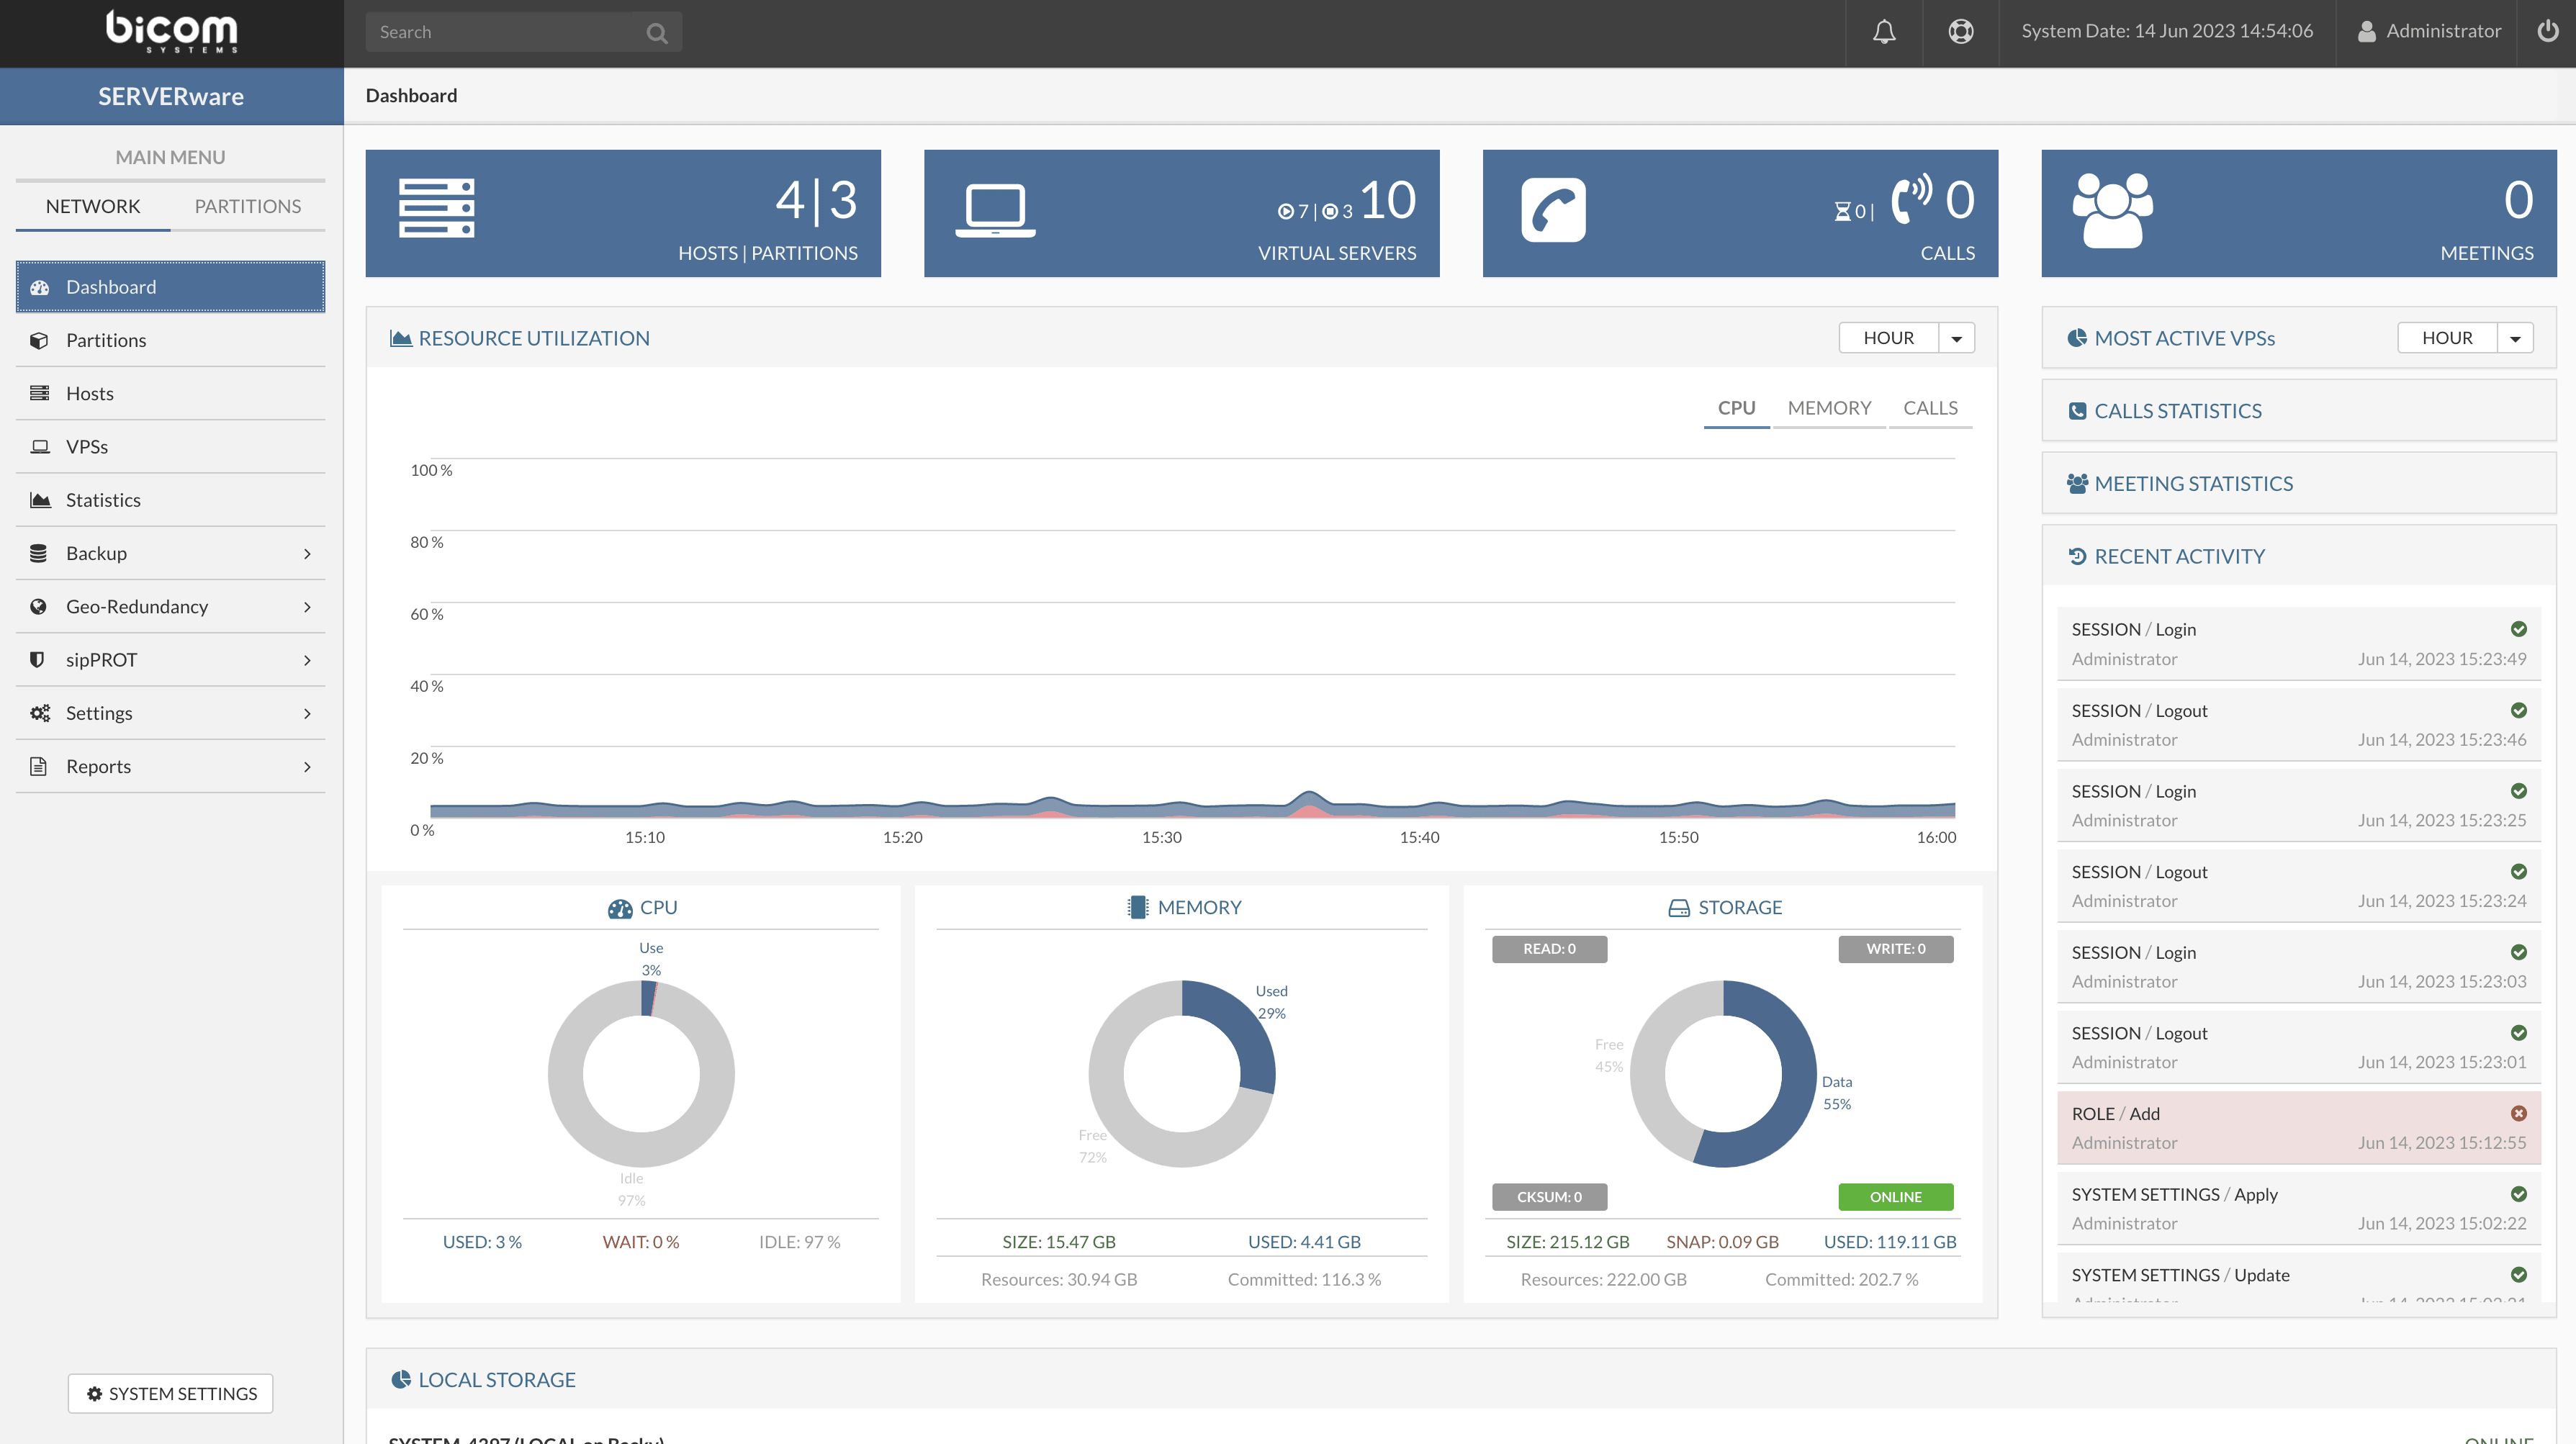
Here is a list of dashboard widgets:
- Running VPS indicator – Displays the total number of VPS as well as the number of running VPS.
- Active calls indicators – Displays the total number of simultaneous calls across all running VPS within the SERVERware network.
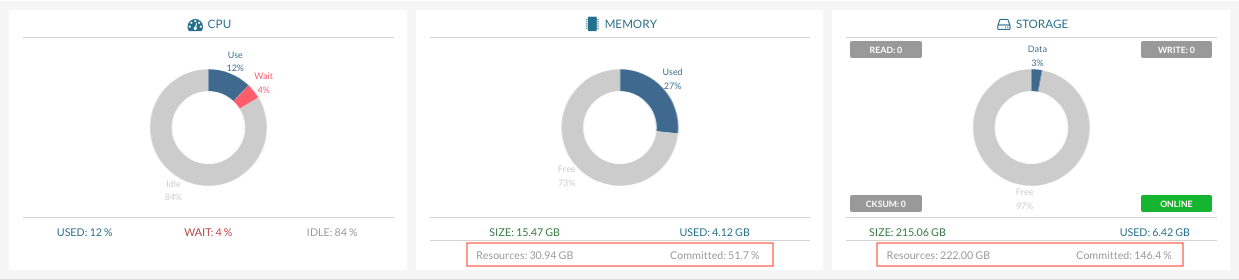
- CPU usage indicator – Displays CPU usage on the main storage host.
- Memory usage indicator – Displays memory usage on the main storage host.
- Storage usage indicator – Displays the storage usage of a NETSTOR pool.
- Resource monitor – Displays resource usage over time (CPU/MEMORY/CALLS). The period can be selected (HOUR/DAY/WEEK).
- Recent activity list – Displays recent activity on SERVERware.
- List of triggered alarms – Displays the list of currently active alarms.
- Most active VPS – Displays the pie chart of resource usage per VPS.
- Local storage – Displays the local storage status for all hosts in the cluster.
The "Most active VPS” helps an administrator quickly identify a VPS that generates a high I/O load on the system.
Most widgets can be viewed over multiple time periods:
- Time
- Day
- Week
There is also a filter by resources used:
- CPU
- Disk space
- Calls
The "Call statistics” displays the total number of calls made across all VPS combined on SERVERware over different time periods.
Call statistics are displayed over several periods:
- Current time
- Today
- Yesterday
- This week
- Current month
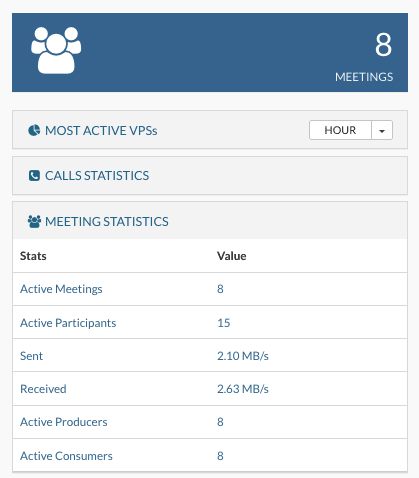
The "Meeting statistics” displays combined information for the meetings held across all VPS combined on SERVERware over different time periods.
The "Memory and storage" dashboard shows over-commitment of resources:
Processing hosts with local storage are excluded from the calculation.
- Memory : Resources represent the total memory available across all hosts. The memory allocated to all VPSs is displayed under “Committed”, as a percentage of the resources.
- Storage : Resources represent the total storage available across all hosts. The storage allocated to all VPSs is displayed under “Committed”, as a percentage of the resources.
LOCAL STORAGE displays the local storage allocation for the storage of all processing hosts.

There are two bars for each storage pool Used and Logical used:
- Used : the sum of the logical used and all other reserved space on the displayed pool.
- Logical used : the space actually used on the displayed pool.
