


10. Statistics
Displaying host/VPS performance graphs
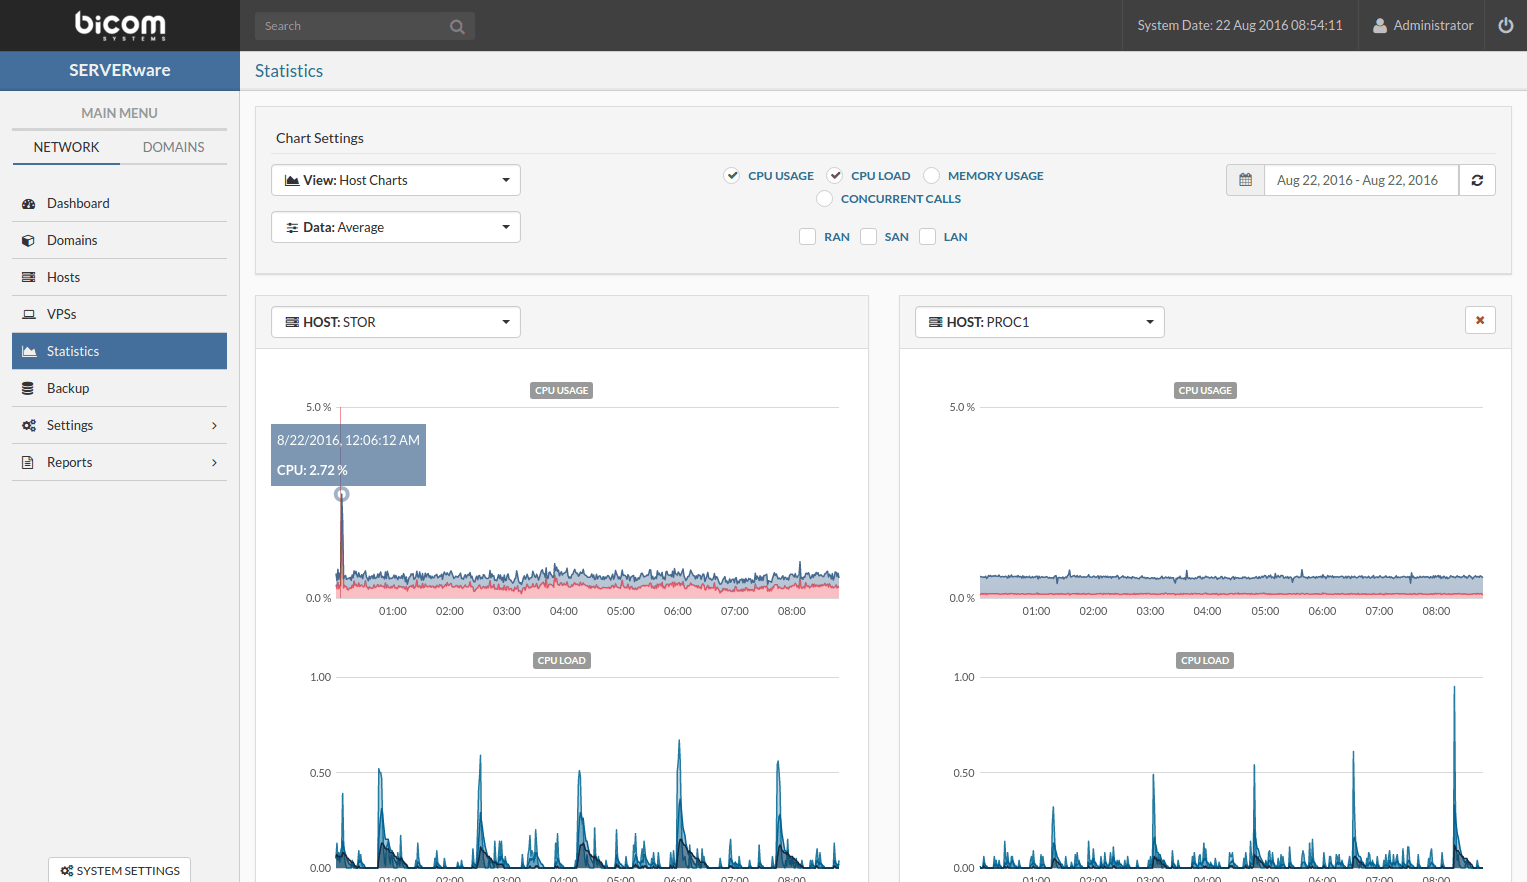
The menu item "Statistics” provides access to a graphical view of the statistics. The Statistics view consists of a graph parameters pane and a graph display pane.
On this statistical view, you can consult the performance graphs of the hosts and VPS, as well as compare the performance between the hosts/VPS. The following metrics are available in the graph settings:
- CPU usage (usage/IO wait)
- CPU load
- Memory usage
- Network bandwidth usage
- Simultaneous calls
- Pool usage
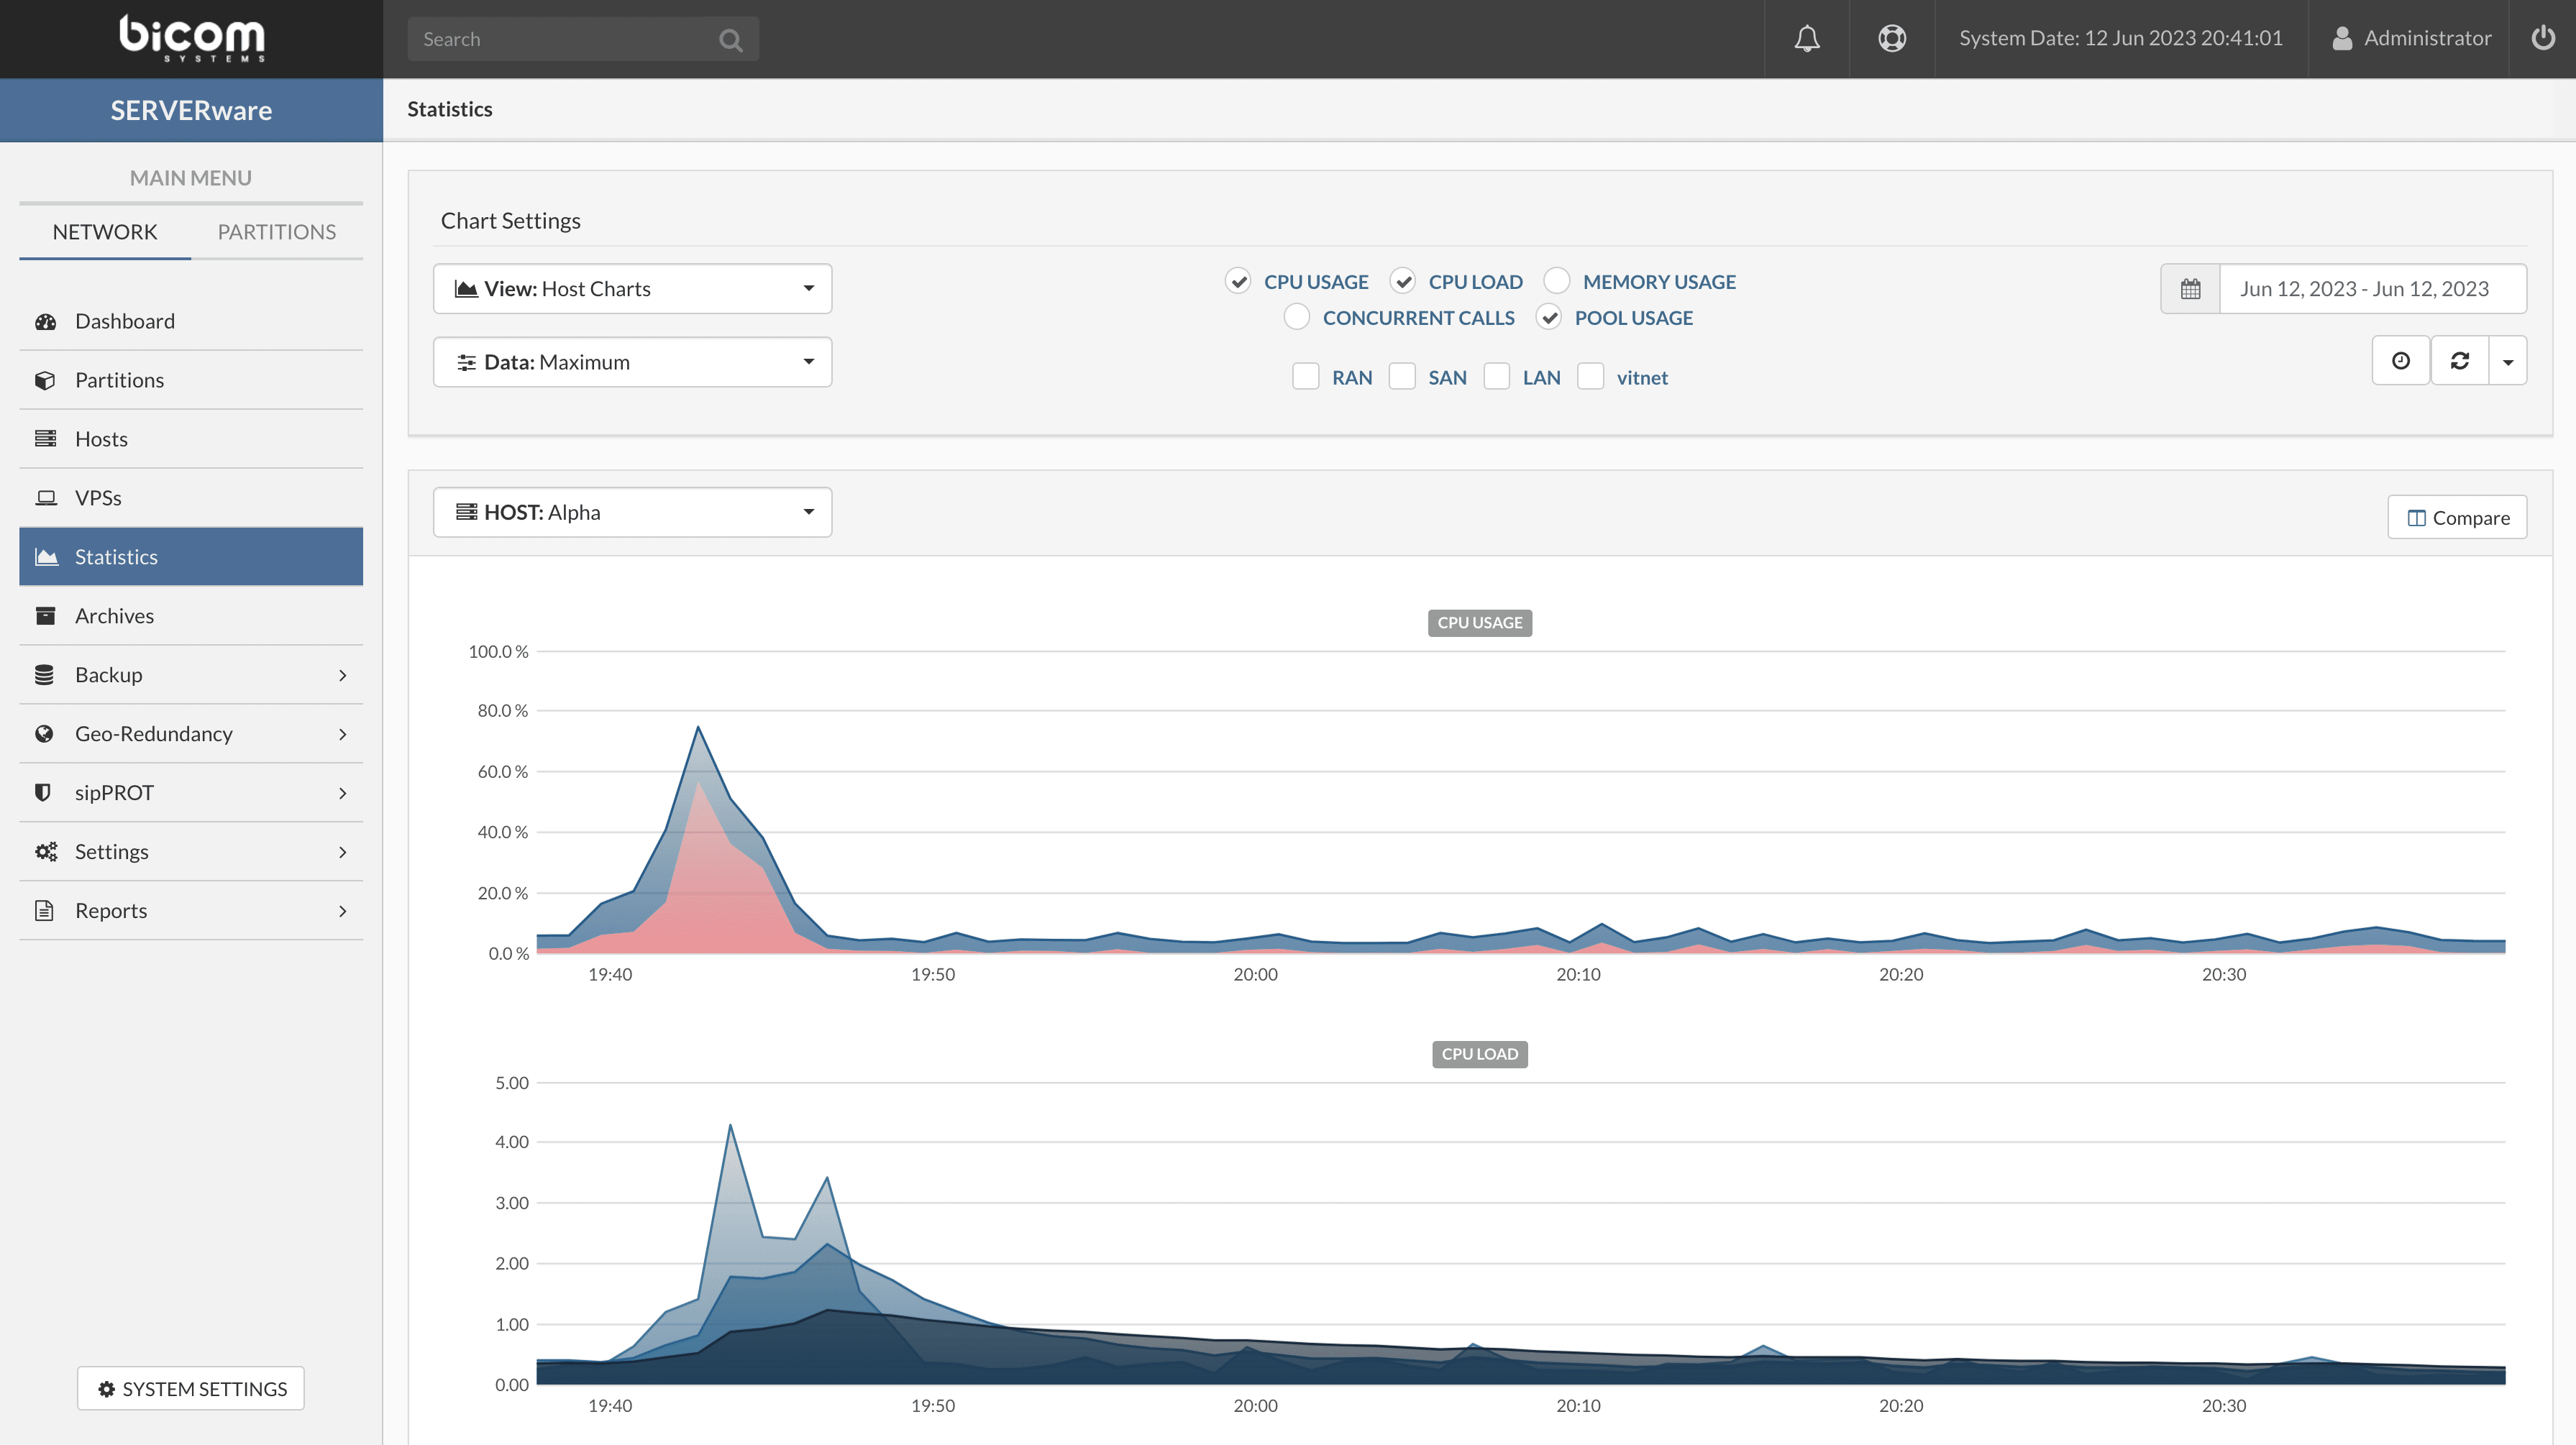
Follow this procedure to display the host/VPS performance graphs:
- In the Statistics, select a view category. Choose between Host charts or VPS charts depending on the statistics you want to view.
- Select the data series you want to display: Average or Maximum.
- Choose the metrics you want to display in the chart display pane.
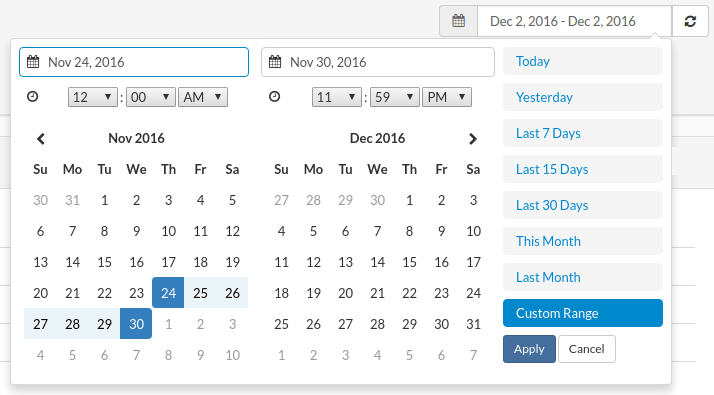
Select a period for which you want to display the performance graphs.
- Select a host/VPS for which you want to display the performance graphs.
- Click on Compare if you want to compare the performance of different hosts/VPS.