



Voicemail statistics
Agent availability
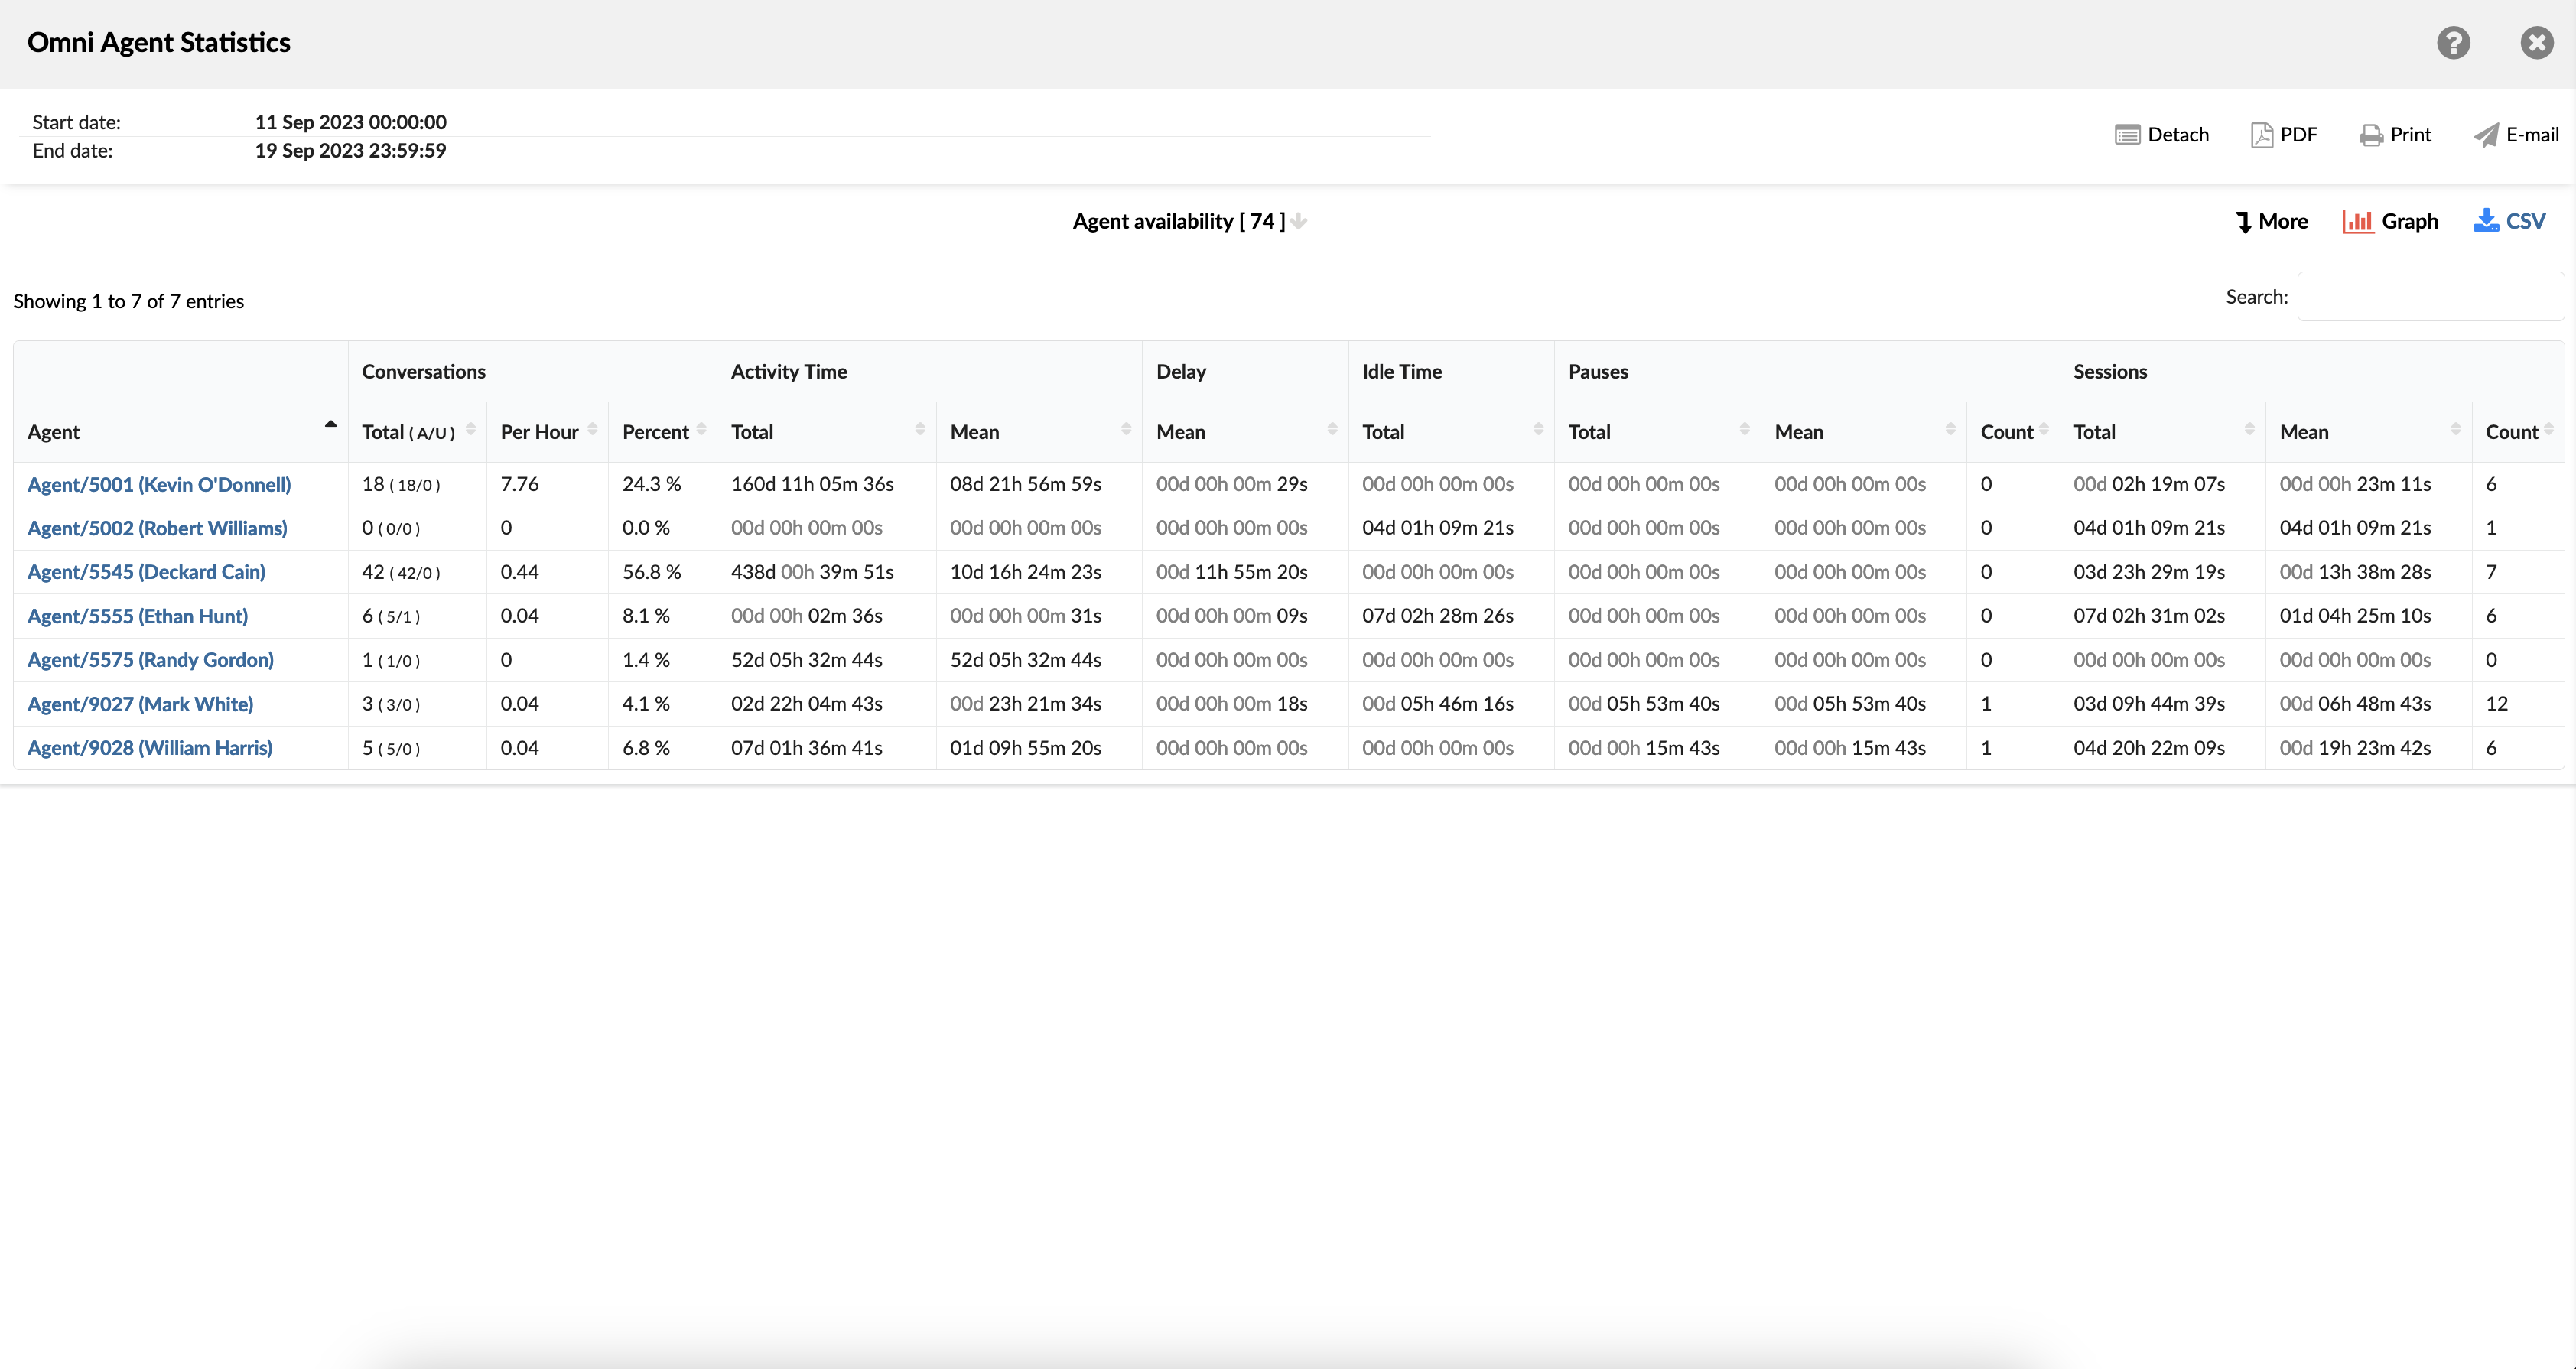
The agent availability report is a tool that helps supervisors closely monitor the performance of their customer service agents. The report provides various information about the time each agent spends on conversations, the number of answered or unanswered conversations, and the time agents spend on actual customer calls/conversations compared to the time they spend waiting for calls/conversations or taking breaks.
Distribution of agent availability
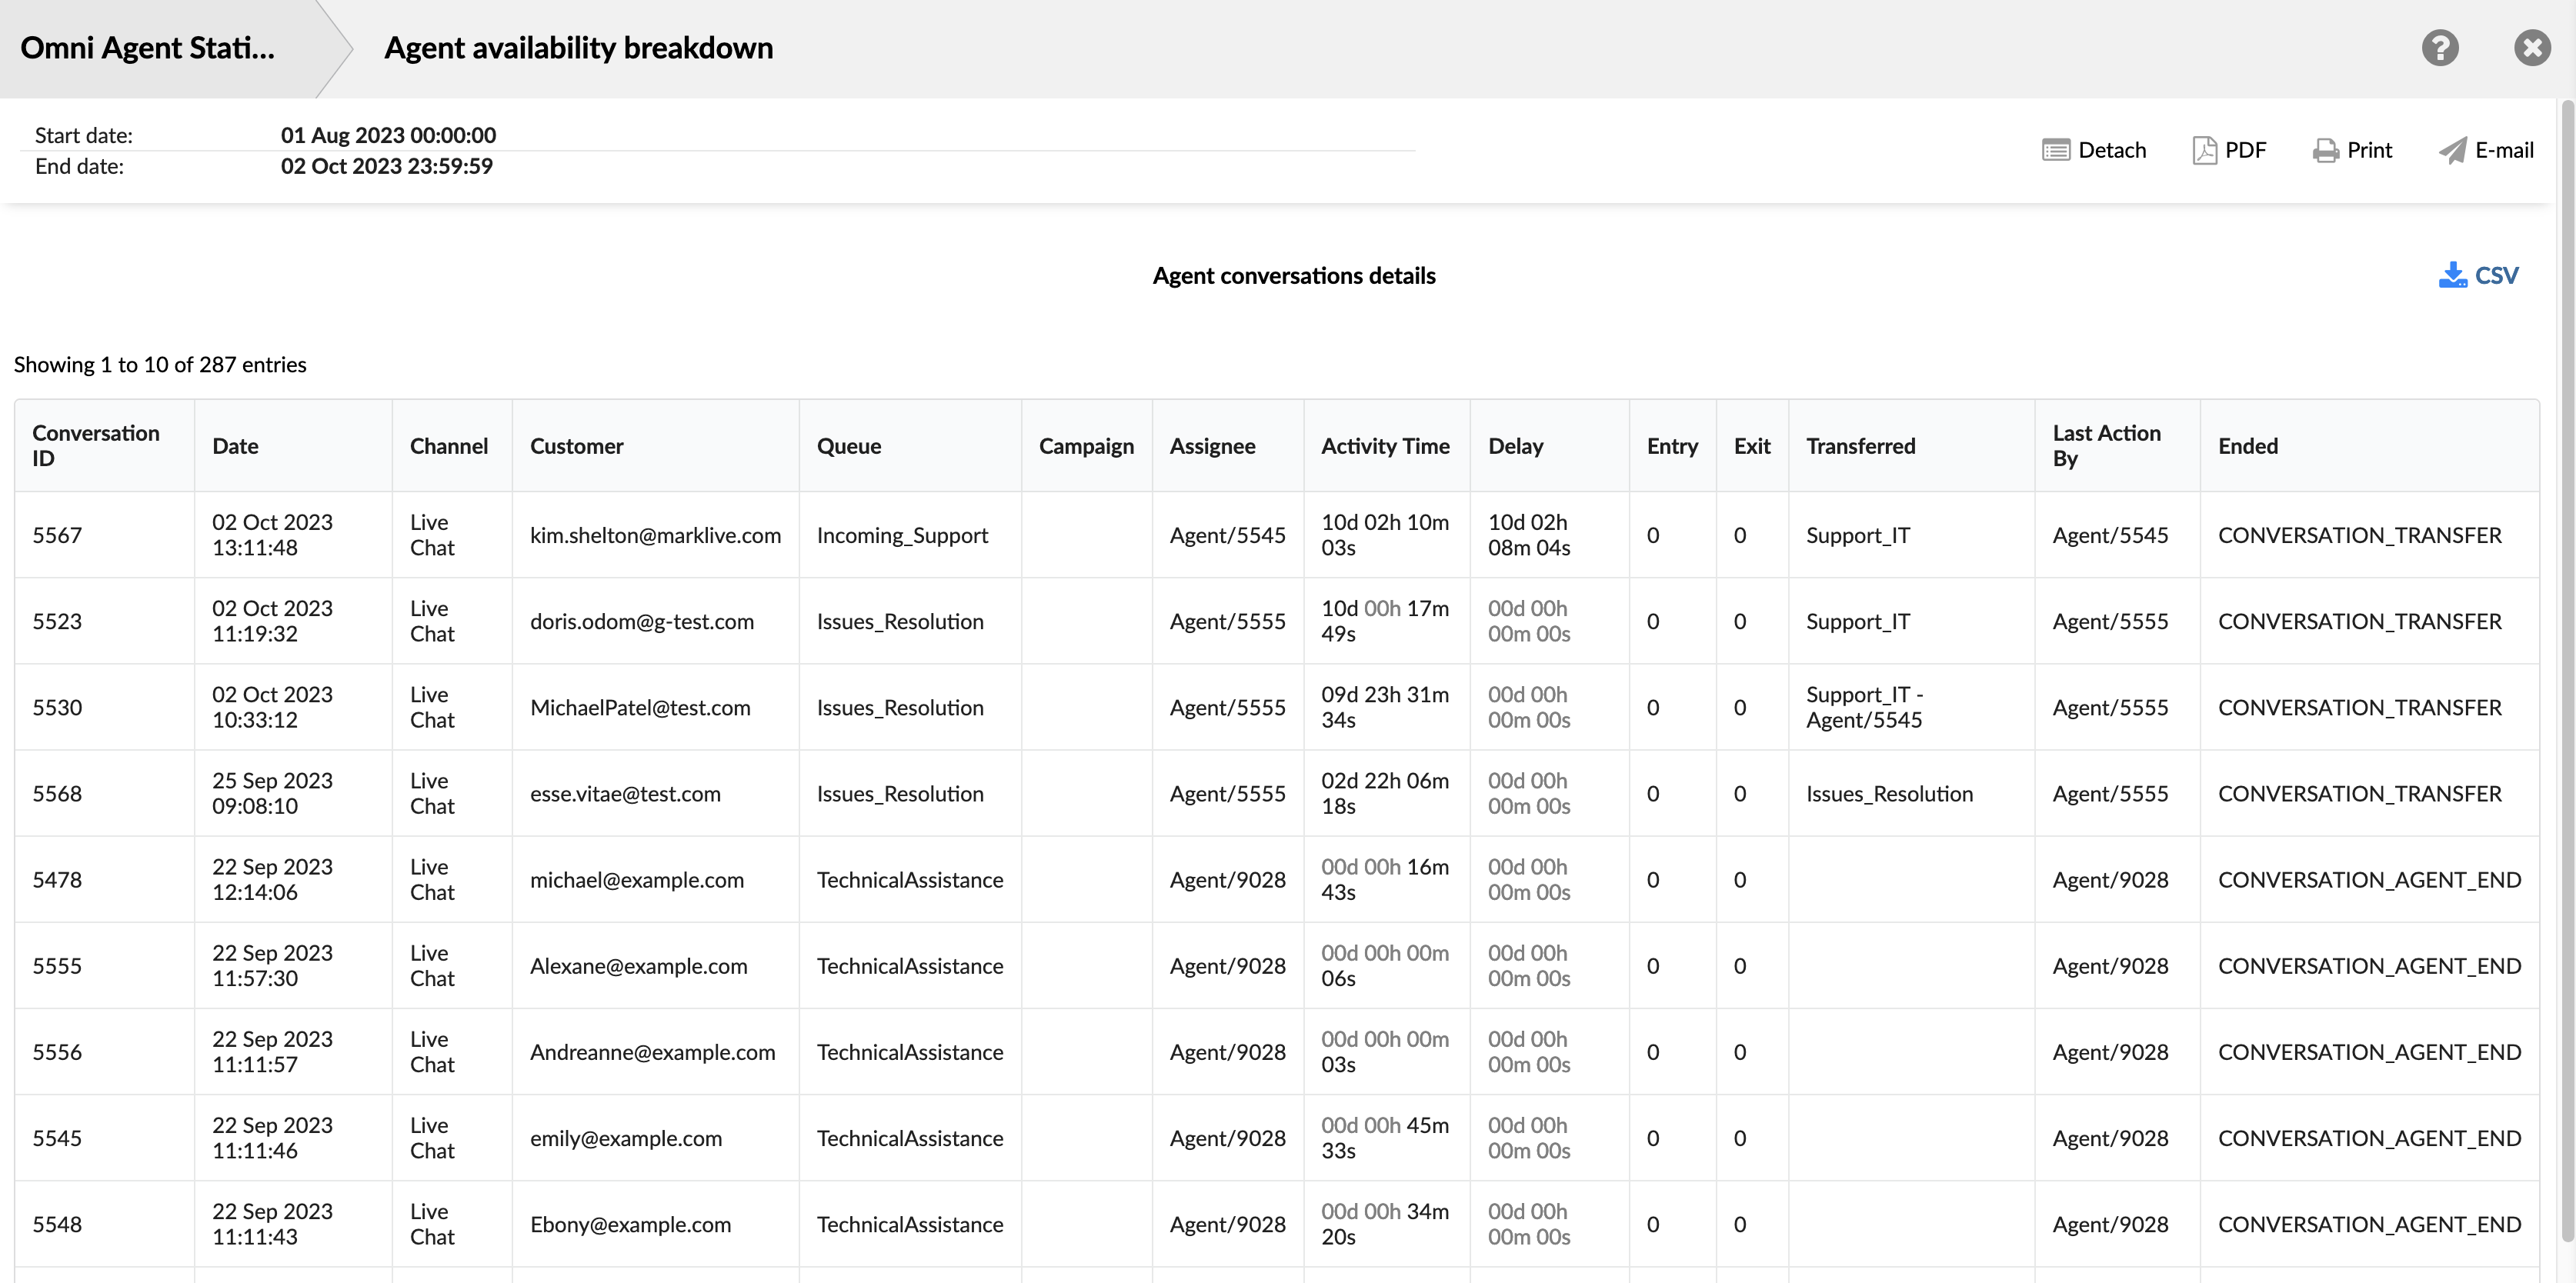
The table consists of fourteen columns, each offering specific information about the conversations.
- Conversation ID : this column displays the unique identifiers assigned to individual conversations.
- Date – this column indicates the date on which each conversation took place.
- Channel : this column specifies the communication method used for each conversation, such as voice, chat, email or messaging.
- Client : this column lists the people involved in each conversation as customers.
- Queue – this column shows the specific support line in which each conversation was handled.
- Campaign – this column indicates the associated campaign linked to each conversation.
- Recipient : this column provides details about the agent responsible for handling each conversation.
- Uptime : this column represents the total duration an agent spends on each conversation.
- Delay : the time needed for each agent to answer a conversation on each channel.
- Input – this column indicates the time at which each conversation entered the support queue.
- Quit : this column records the time at which each conversation left the support queue.
- Transferred : this column indicates whether a conversation was transferred to another agent or another queue.
- Last action by : this column displays the previous contributor to the conversation, the agent or the customer.
- Completed – this column specifies the closing status of each conversation.
Agent Availability Chart
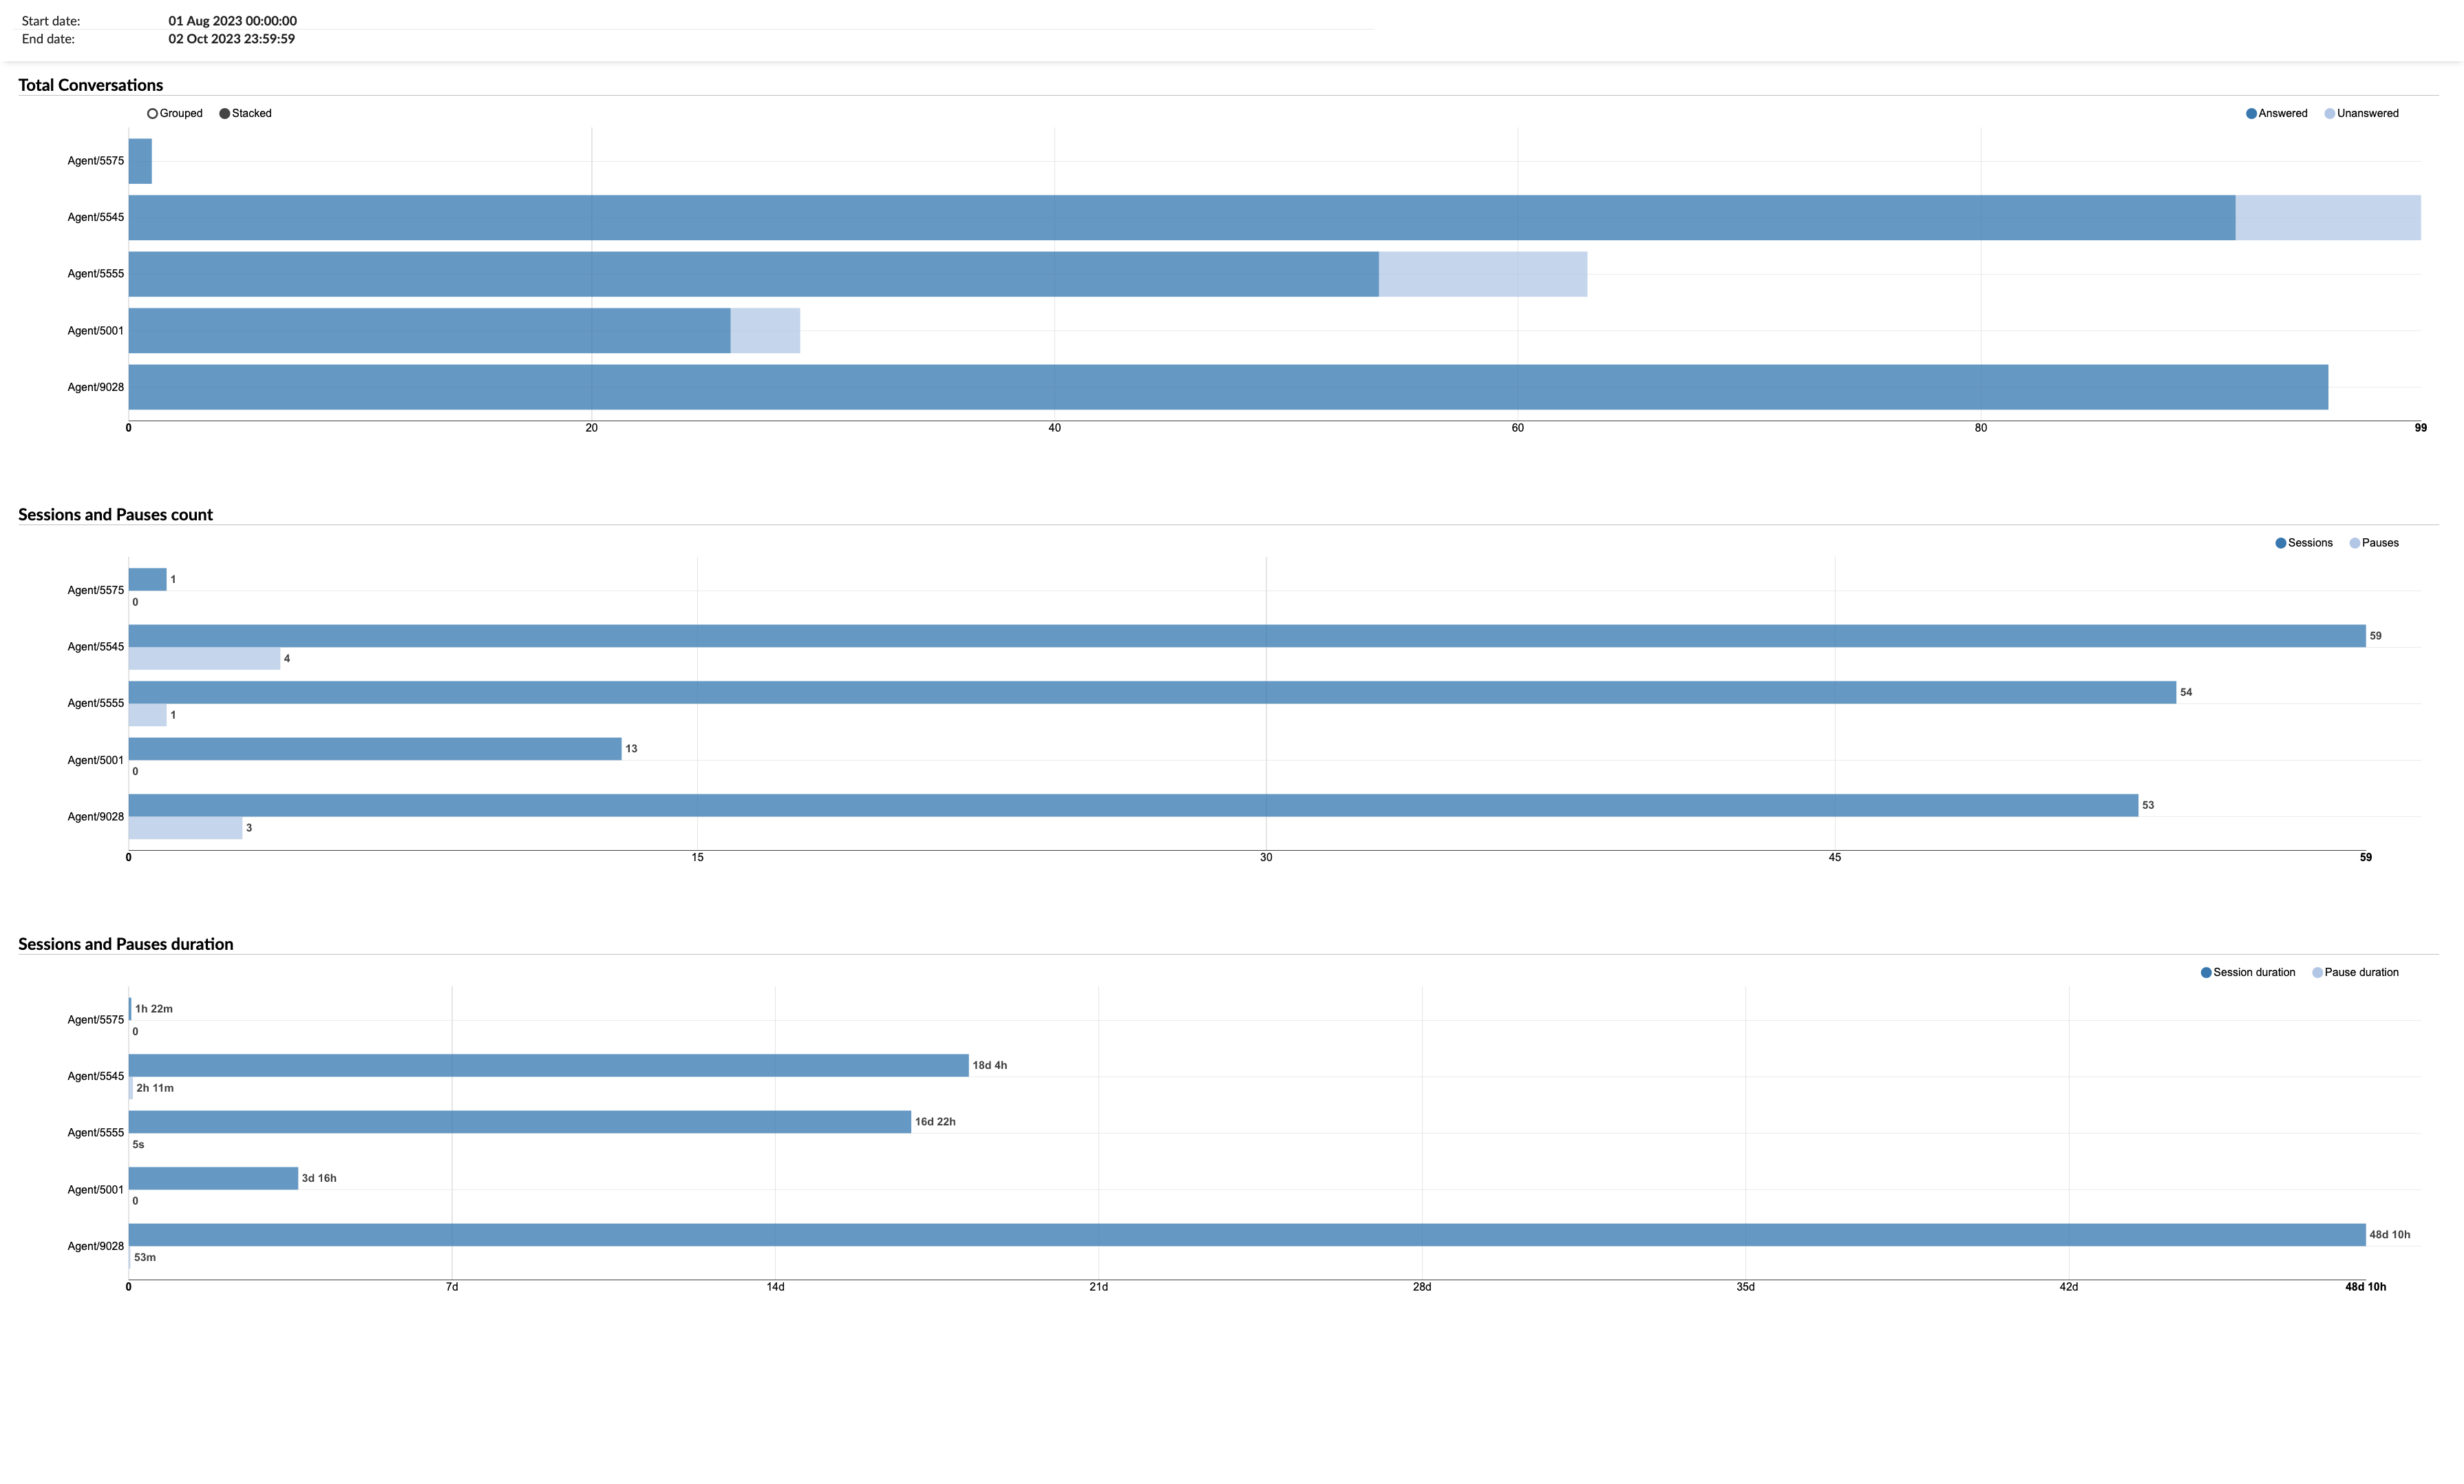
The report provides information about the total number of conversations for each agent. It also includes details about the number of sessions and breaks, as well as the duration of the breaks for each agent.
Agent conversations by channel
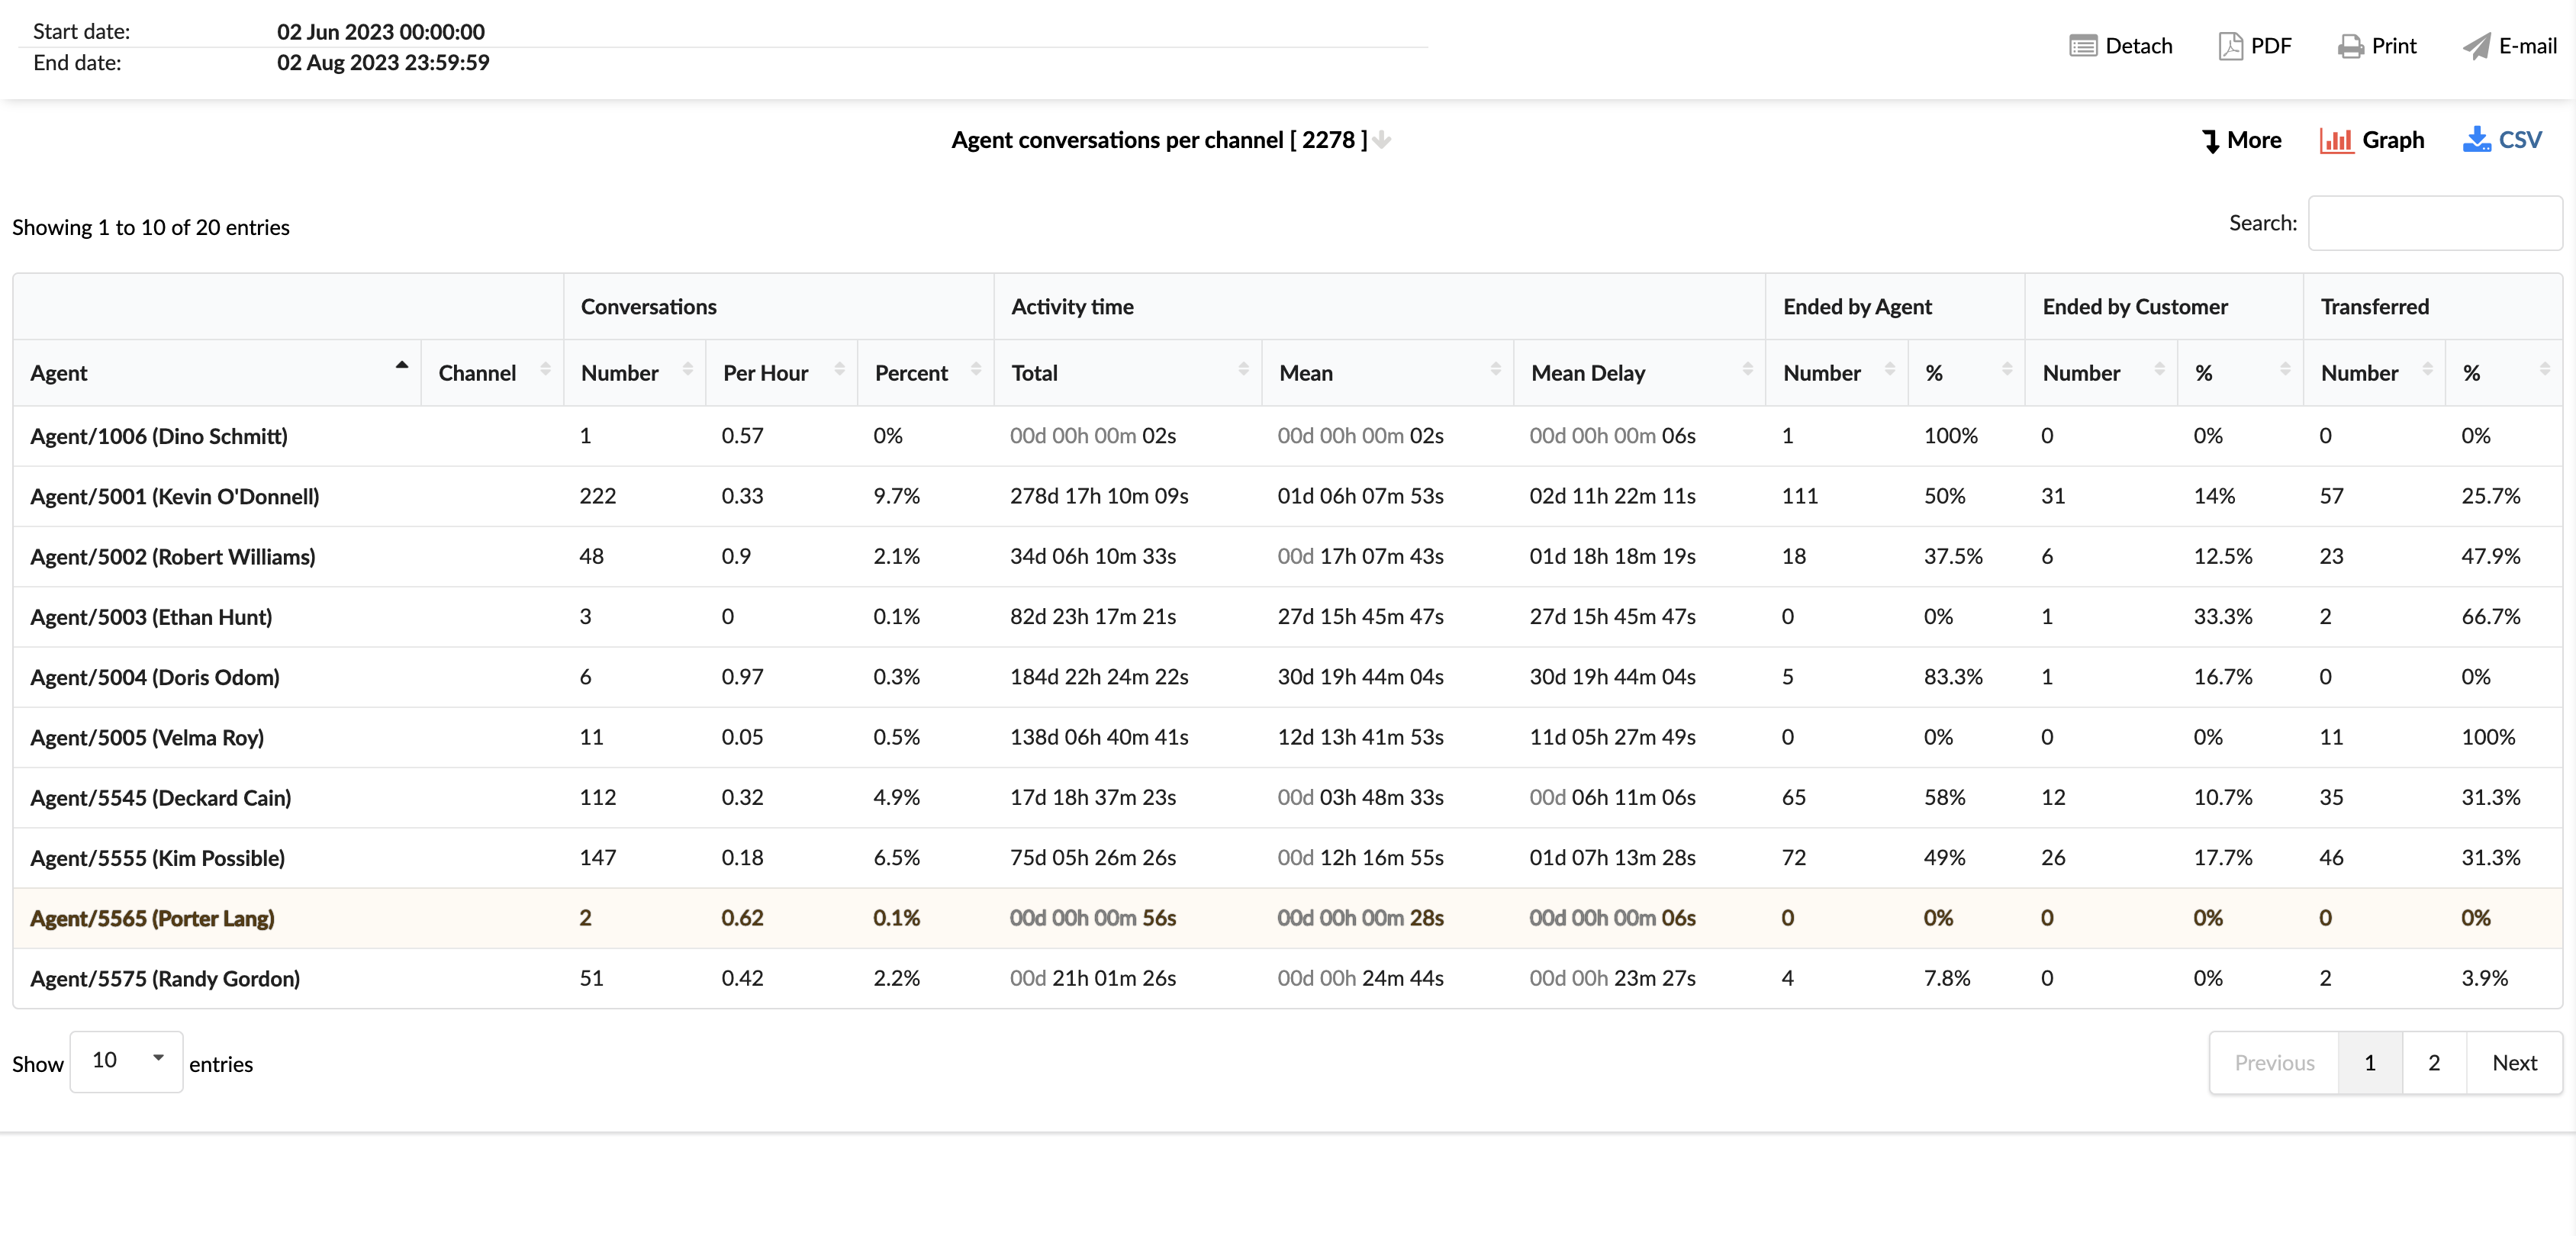
The "Agent conversations by channel" report provides a comprehensive overview of the interactions handled by each agent across different channels. This report presents the volume, efficiency, and outcome of the conversations agents took part in during a specified period. It offers insight into the frequency of conversations, their duration, and how they end: are they ended by the agent, the customer, or transferred. This data is essential for understanding agent performance, optimizing workflows, and ensuring customer satisfaction. The report is divided into several columns, each providing specific details about the conversations.
Agent : This column lists the names of all agents.
Channel : this column indicates the communication channel for the conversations, such as chat, email, or messaging.
Conversations : This column is divided into three sub-columns:
- Number : displays the total number of conversations that each agent handled in each channel.
- By hour : displays the average number of conversations that each agent handles per hour in each channel.
- Percentage : represents the percentage of total conversations that each agent handles in each channel.
Uptime : This column is divided into three sub-columns:
- Total : displays the cumulative time that the agent spent on conversations in each channel.
- Average : Displays the average time spent per conversation by each agent in each channel.
- Average delay : represents the average delay before each agent answers a conversation in each channel.
Ended by Agent : This column is divided into two sub-columns:
- Number : displays the number of conversations ended by the agent in each channel.
- % : represents the percentage of conversations ended by the agent in each channel.
Ended by the customer : This column is divided into two sub-columns:
- Number : displays the number of conversations ended by the customer in each channel.
- % : represents the percentage of conversations ended by the client in each channel.
Transferred : This column is divided into two sub-columns:
- Number : displays the number of conversations that were transferred to another agent or another queue in each channel.
- % : represents the percentage of conversations transferred in each channel.
Using the "Agent conversations by channel" statistical report, agents and managers can gain insights into each agent's performance across different channels, identify areas for improvement and implement strategies to improve efficiency and customer service.
Distribution of agent conversations by channel
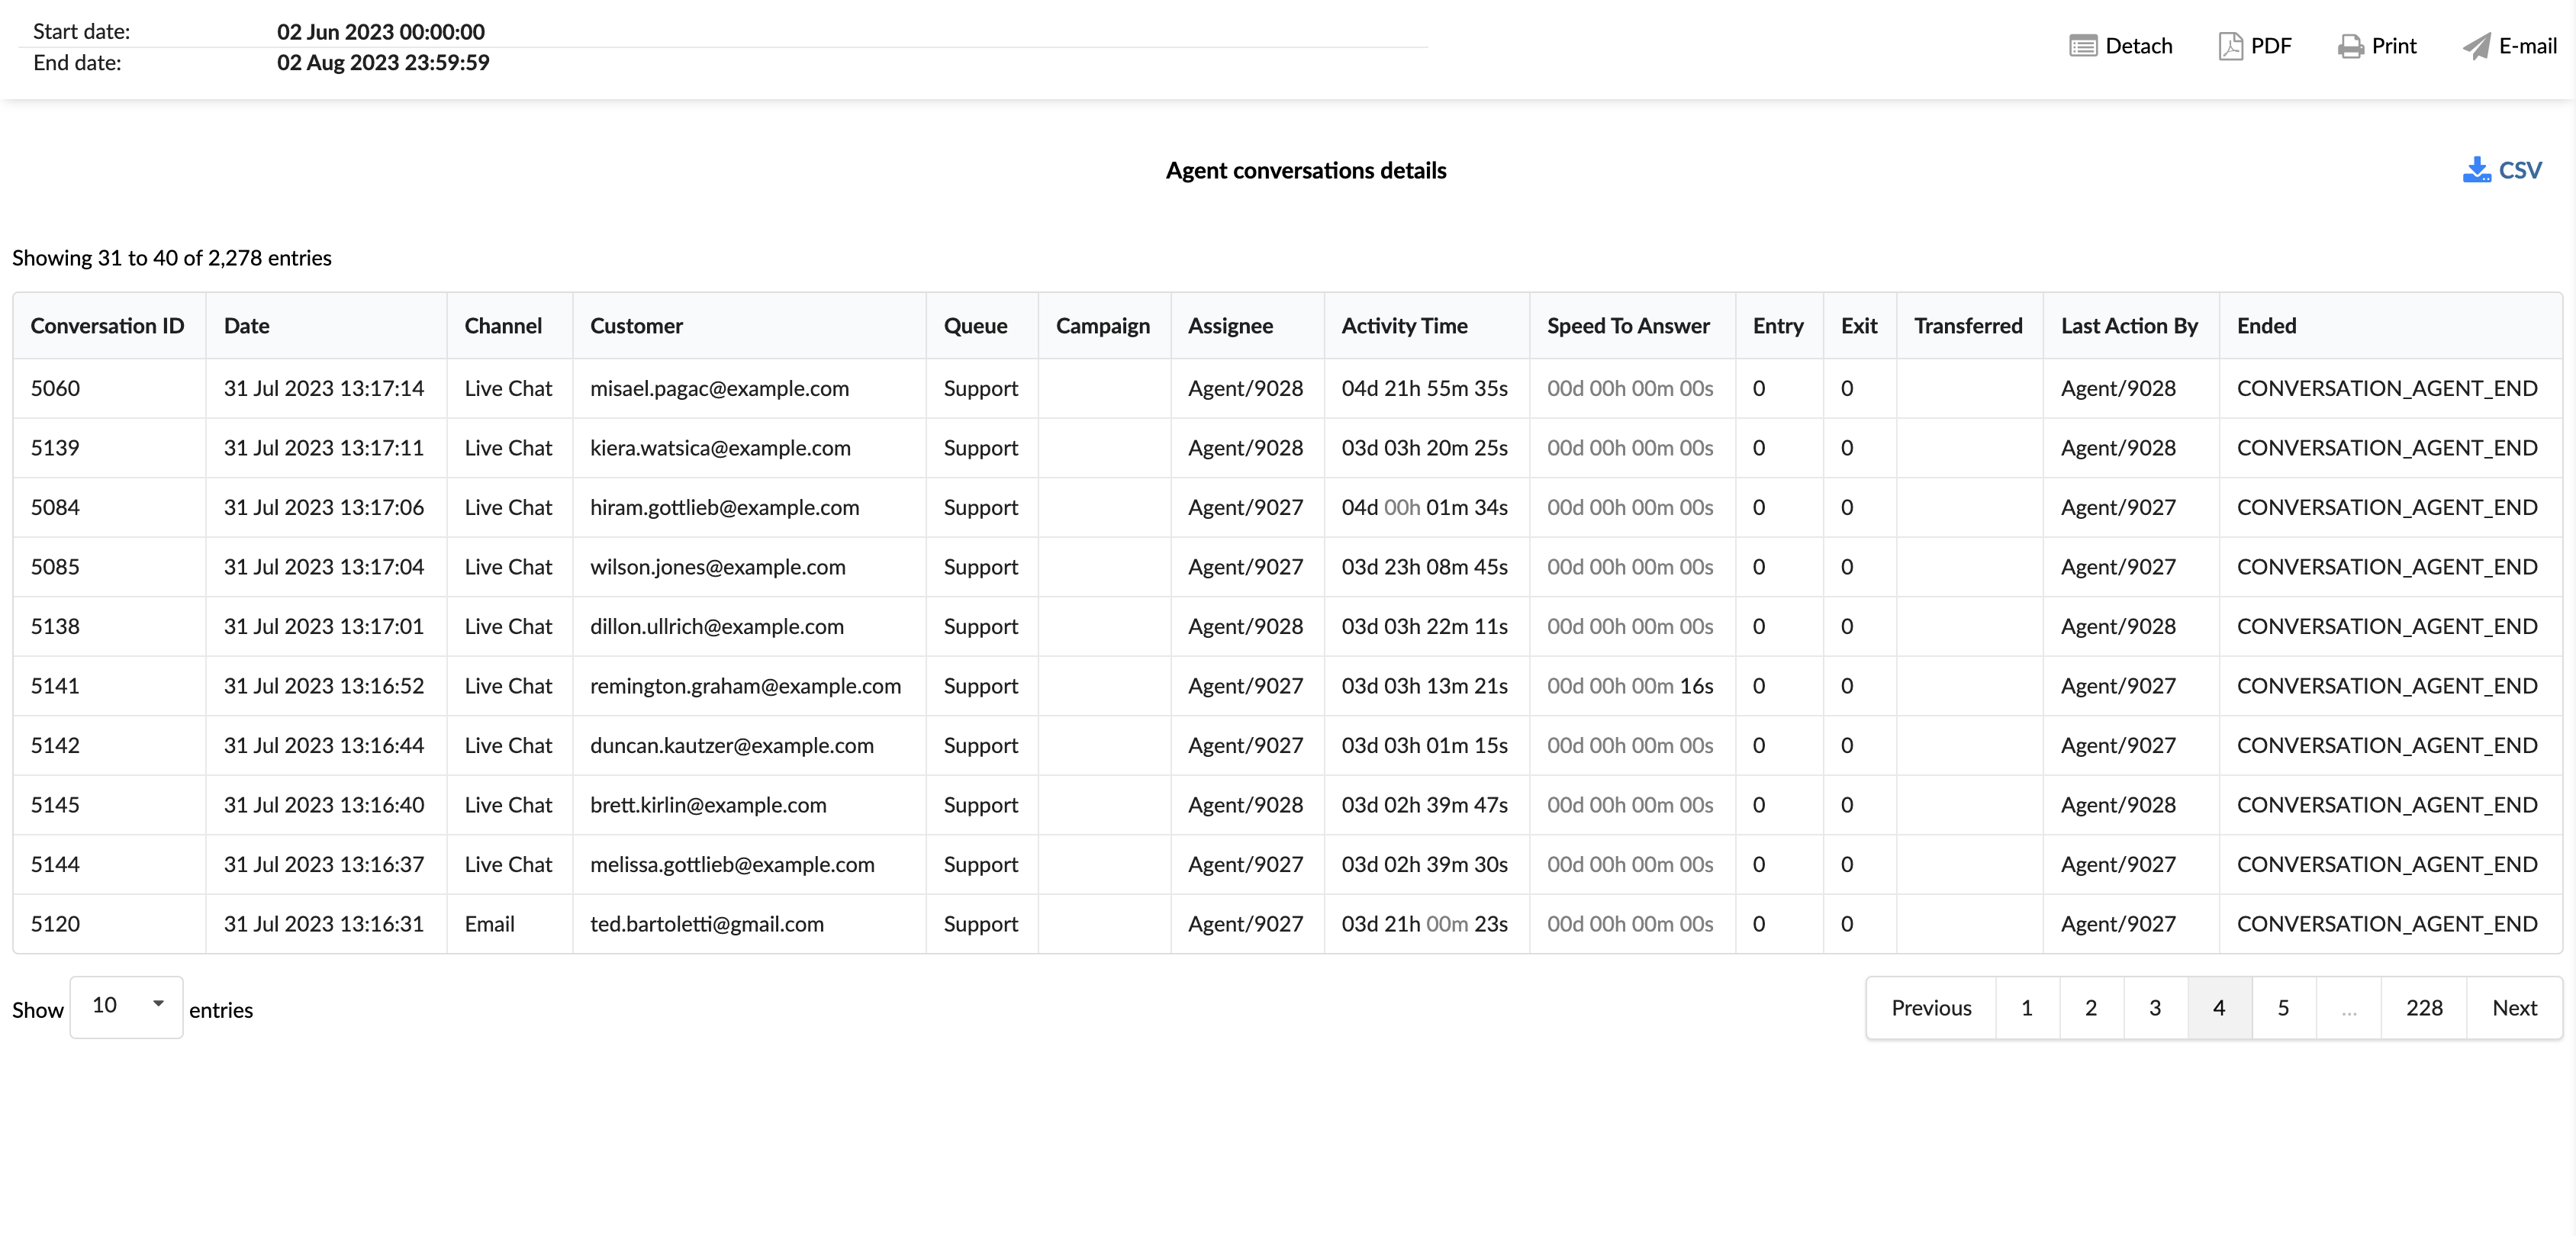
The "Agent conversations by channel breakdown" statistics table provides detailed information about each conversation handled by agents across different communication channels. The table consists of fourteen columns, each offering specific information about the conversations.
Conversation ID : this column lists the unique identifiers of each conversation.
Date : This column indicates the date on which each conversation took place.
Channel : This column indicates the communication channel used for each conversation, such as chat, email, or messaging.
Client : This column lists the customers involved in each conversation.
Queue : This column displays the queue in which each conversation was handled.
Campaign : This column indicates the campaign associated with each conversation.
Assignee : This column lists the agent assigned to each conversation.
Uptime : this column displays the total time that the agent spent on each conversation.
Answer speed : This column represents the time taken by the agent to answer each conversation.
Input : This column indicates the time at which each conversation entered the queue.
Output : this column indicates the time at which each conversation left the queue.
Transferred : This column indicates whether each conversation was transferred to another agent or another queue.
Last action by : this column indicates who performed the last action in the conversation, whether it was the agent or the customer.
Completed : This column indicates how each conversation ended.
Using the "Agent conversations by channel breakdown" statistics table, agents and managers can gain a granular understanding of each conversation, identify patterns and implement strategies to improve agent performance and customer service.
Chart of the total number of conversations/available agents by channel
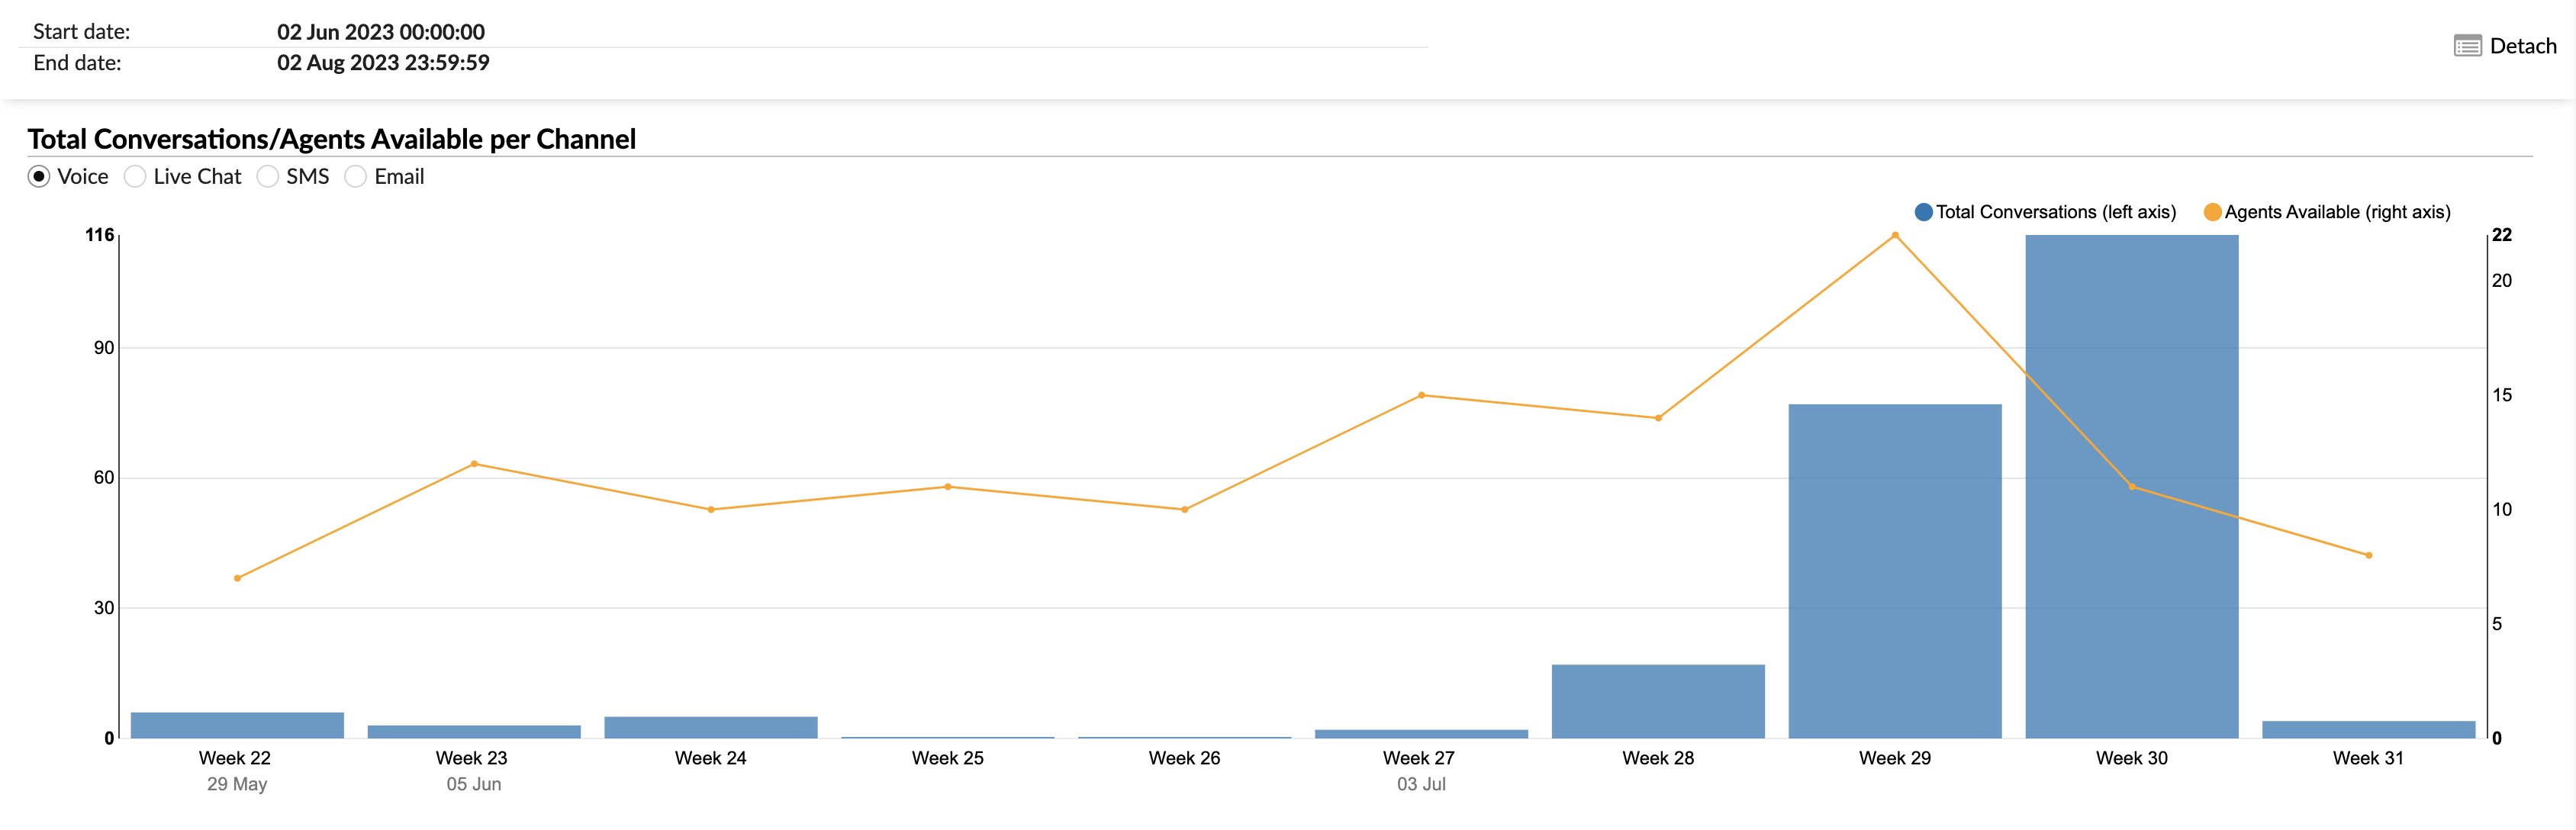
The “Total conversations/available agents by channel” chart provides a visual representation of the total conversations handled and agent availability across different communication channels. The chart is designed to allow clear comparison and analysis of these two key metrics.
Total conversations (left axis) : this metric is represented by vertical bars. Each bar corresponds to the total number of conversations handled in a specific channel. The height of the bar corresponds to the number of conversations, as shown on the left axis.
Available agents (right axis) : this metric is represented by a yellow line that intersects the vertical bars. Each point on the line corresponds to the number of agents available at a given moment, as shown on the right axis.
Users can select the channels they want to display on the graph using the radio buttons. The options include voice, live chat, SMS and email. By selecting a specific channel, the graph will render the corresponding data for that channel.
Using the "Total conversations/available agents by channel" chart, agents and managers can visually analyze conversation volume and agent availability across different channels, identify trends and implement strategies to improve performance and efficiency.
Chart of agent conversations by channel
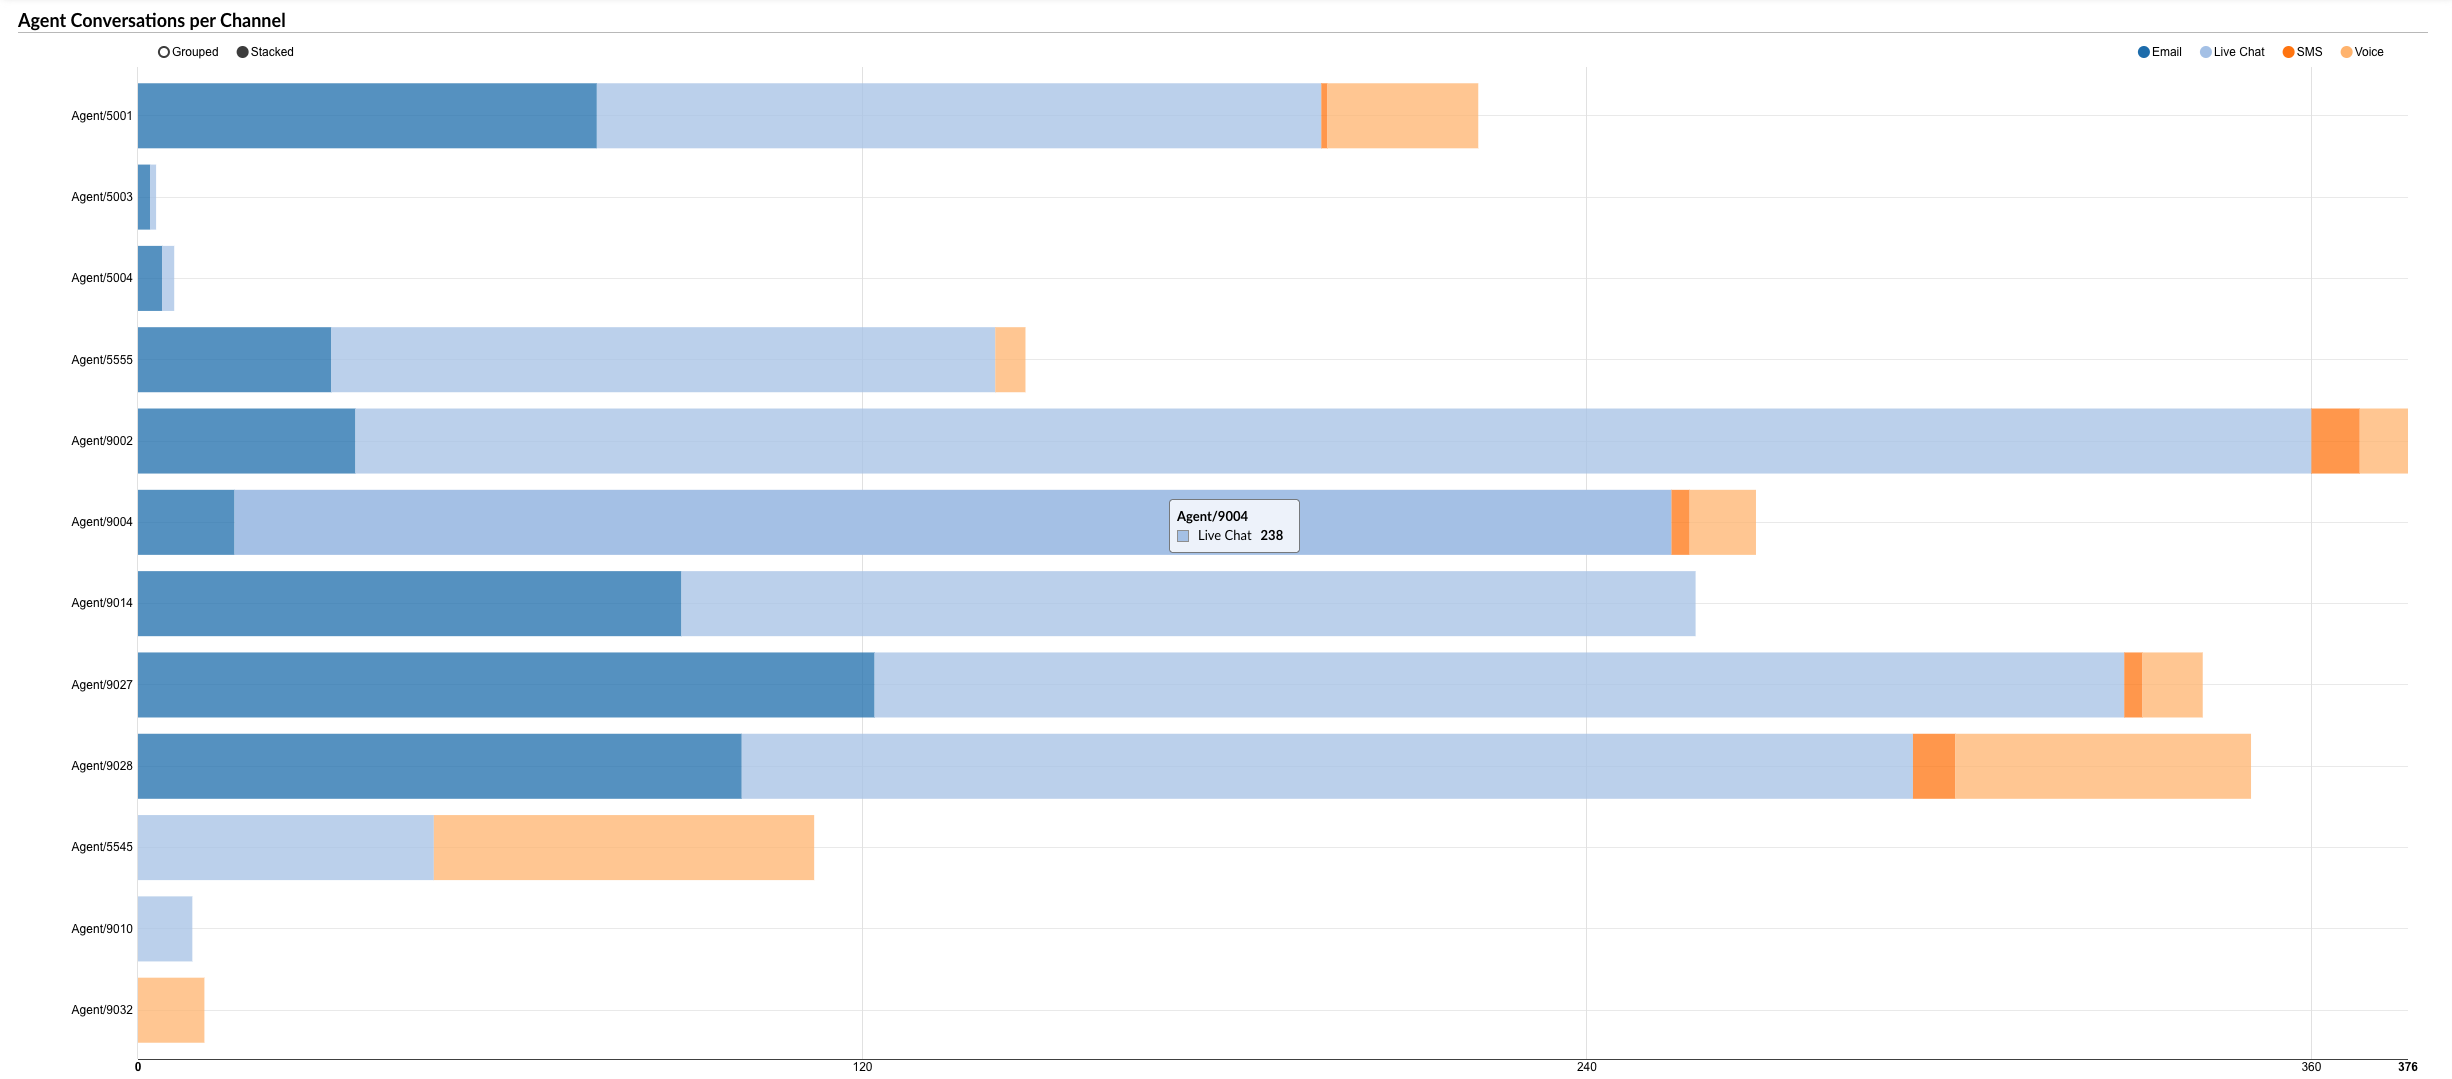
The “Agent conversations by channel” chart provides a visual representation of the number of conversations handled by each agent across different communication channels. The chart is designed to allow clear comparison and analysis of these key metrics.
Agent conversations : this metric is represented by horizontally arranged bars for each agent. Each bar corresponds to the total number of conversations handled by a specific agent. The length of the bar corresponds to the number of conversations.
Channels : conversations are divided in each column by color, with each color representing a different communication channel. This provides a clear view of the distribution of conversations across channels for each agent.
Users can select the channels they want to display on the graph using the radio buttons. The options include voice, live chat, SMS and email. By selecting a specific channel, the graph will highlight the corresponding data for that channel in each agent's column.
Furthermore, by hovering over a specific color in an agent’s column, users can see the exact number of tickets or calls handled by that agent for the corresponding channel.
Using the "Agent conversations by channel" chart, agents and managers can visually analyze the distribution of conversations between agents and channels, identify trends and implement strategies to improve performance and efficiency.
Chart of the average agent delay and average activity time by channel
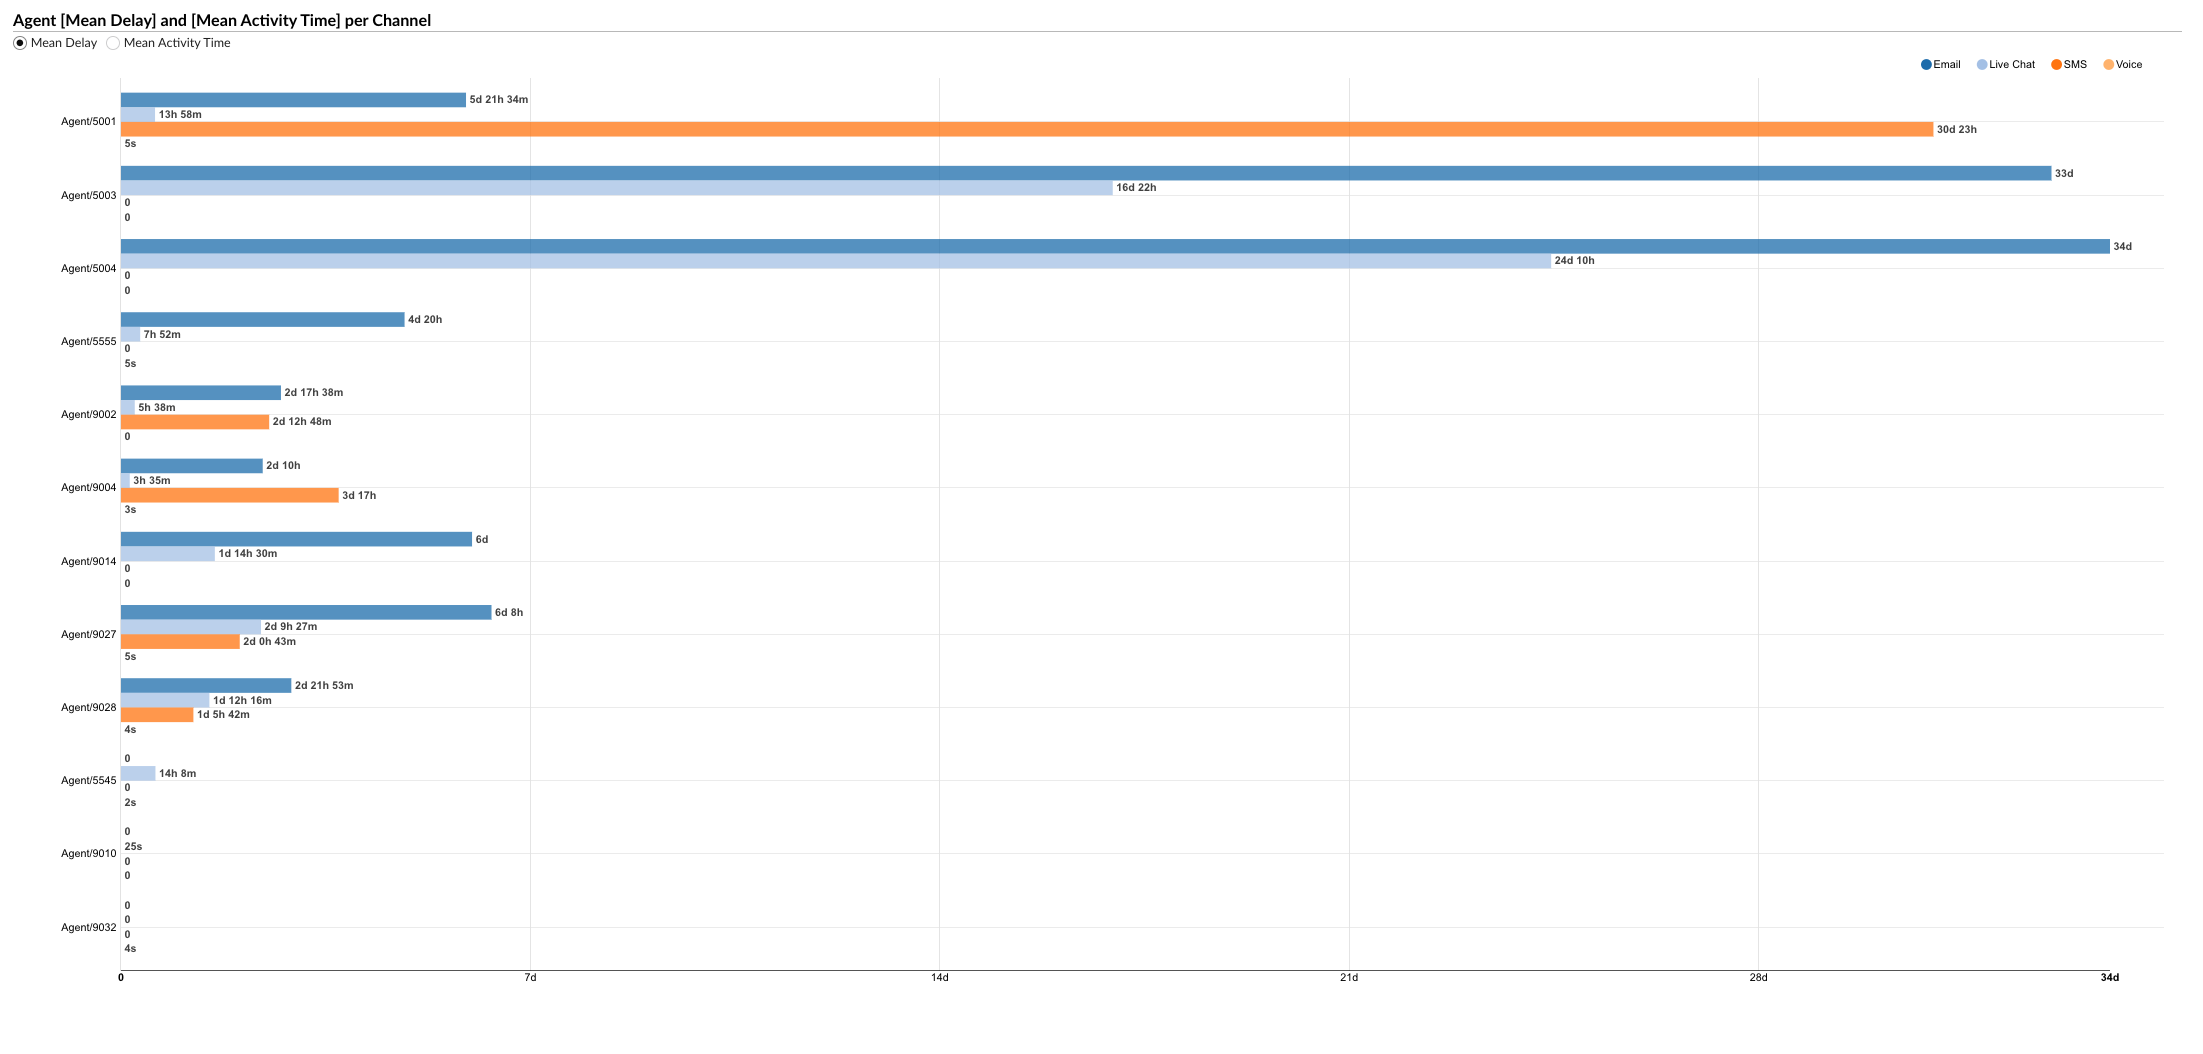
The “Average agent delay and average active time by channel” chart provides a visual representation of two key metrics for each agent across different communication channels. The chart is designed to allow clear comparison and analysis of these metrics.
Average delay and average uptime : users can select either of these metrics to display on the chart using the radio buttons. The “Average Delay” represents the average delay before each agent answers a conversation, while the “Average Activity Time” indicates the average time the agent spends on each conversation.
Channels : Each channel is represented by a different color, as indicated by colored radio buttons. Users can select a specific channel to display the corresponding data for that channel.
Agent metrics : the selected metric is represented by columns arranged horizontally for each agent. Each column corresponds to the selected metric (either the average delay or the average activity time) for a specific agent. The length of the column corresponds to the metric value.
Using the "Average agent delay and average active time by channel" chart, agents and managers can visually analyze these key performance metrics across all agents and channels, identify trends and implement strategies to improve performance and efficiency.
Agent conversations by queue
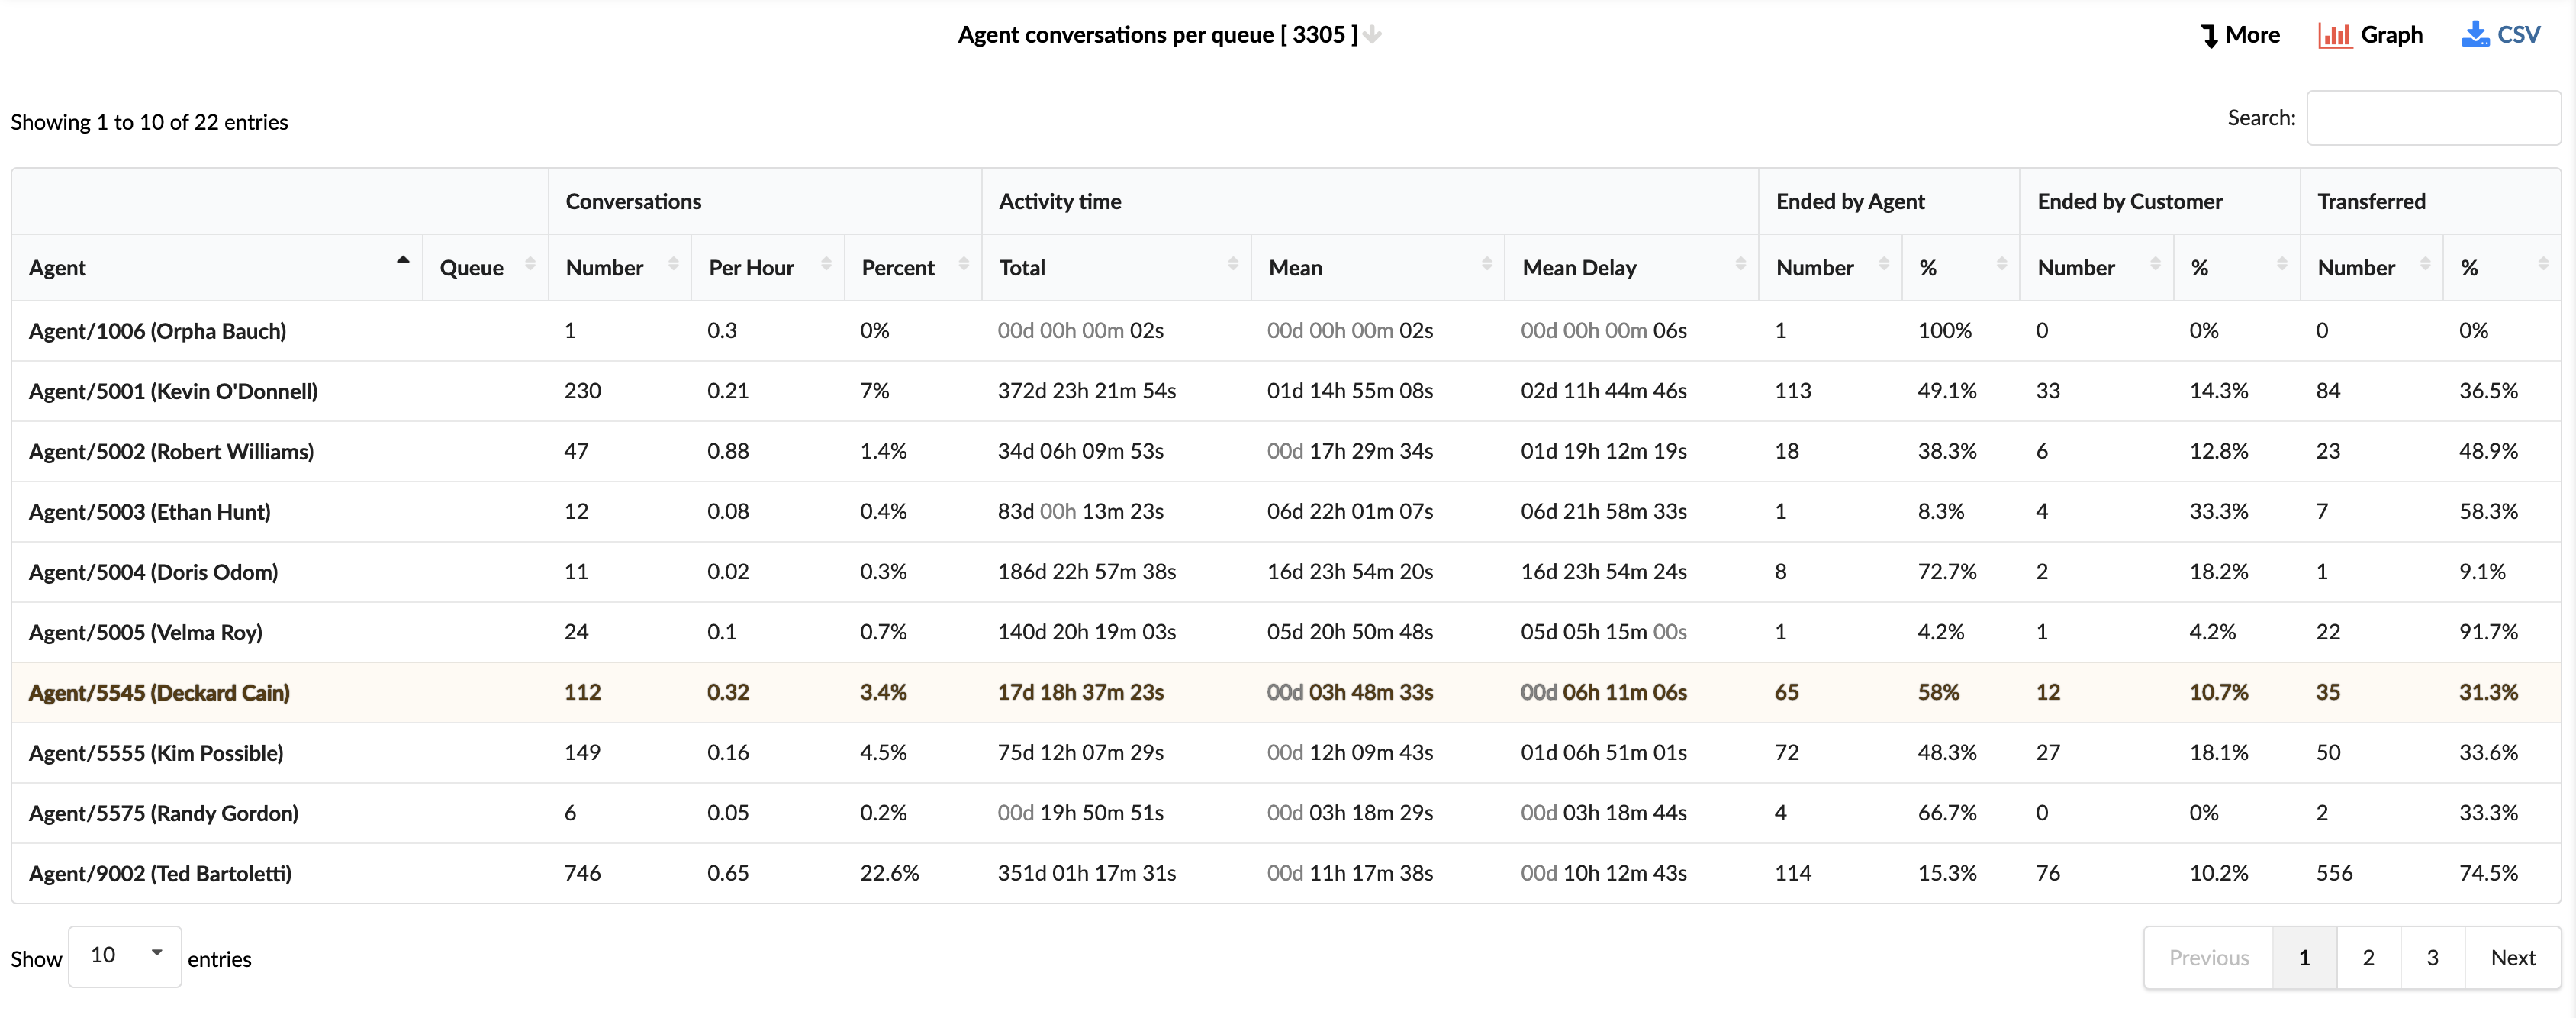
The "Agent conversations by queue" statistical report provides a comprehensive overview of the conversations handled by each agent across different queues. The report is divided into several columns, each providing specific details about the conversations.
Agent : This column lists the names of all agents.
Queue : This column indicates the queue in which the conversations were handled.
Conversations : This column is divided into three sub-columns:
- Number : displays the total number of conversations handled by each agent in each queue.
- By hour : displays the average number of conversations that each agent handles per hour in each queue.
- Percentage : represents the percentage of total conversations that each agent handles in each queue.
Uptime : This column is divided into three sub-columns:
- Total : displays the cumulative time that the agent spent on conversations in each queue.
- Average : Displays the average time spent per conversation by each agent in each queue.
- Mean Delay : represents the average delay before each agent answers a conversation in each queue.
Ended by Agent : This column is divided into two sub-columns:
- Number : displays the number of conversations ended by the agent in each queue.
- % : represents the percentage of conversations ended by the agent in each queue.
Ended by the customer : This column is divided into two sub-columns:
- Number : displays the number of conversations ended by the customer in each queue.
- % : represents the percentage of conversations ended by the client in each queue.
Transferred : This column is divided into two sub-columns:
- Number : displays the number of conversations that were transferred to another agent or another queue in each queue.
- % : represents the percentage of conversations transferred in each queue.
Using the "Agent conversations by queue" statistical report, agents and managers can gain insights into each agent's performance across different queues, identify areas for improvement and implement strategies to improve efficiency and customer service.
Agent conversations by queue distribution
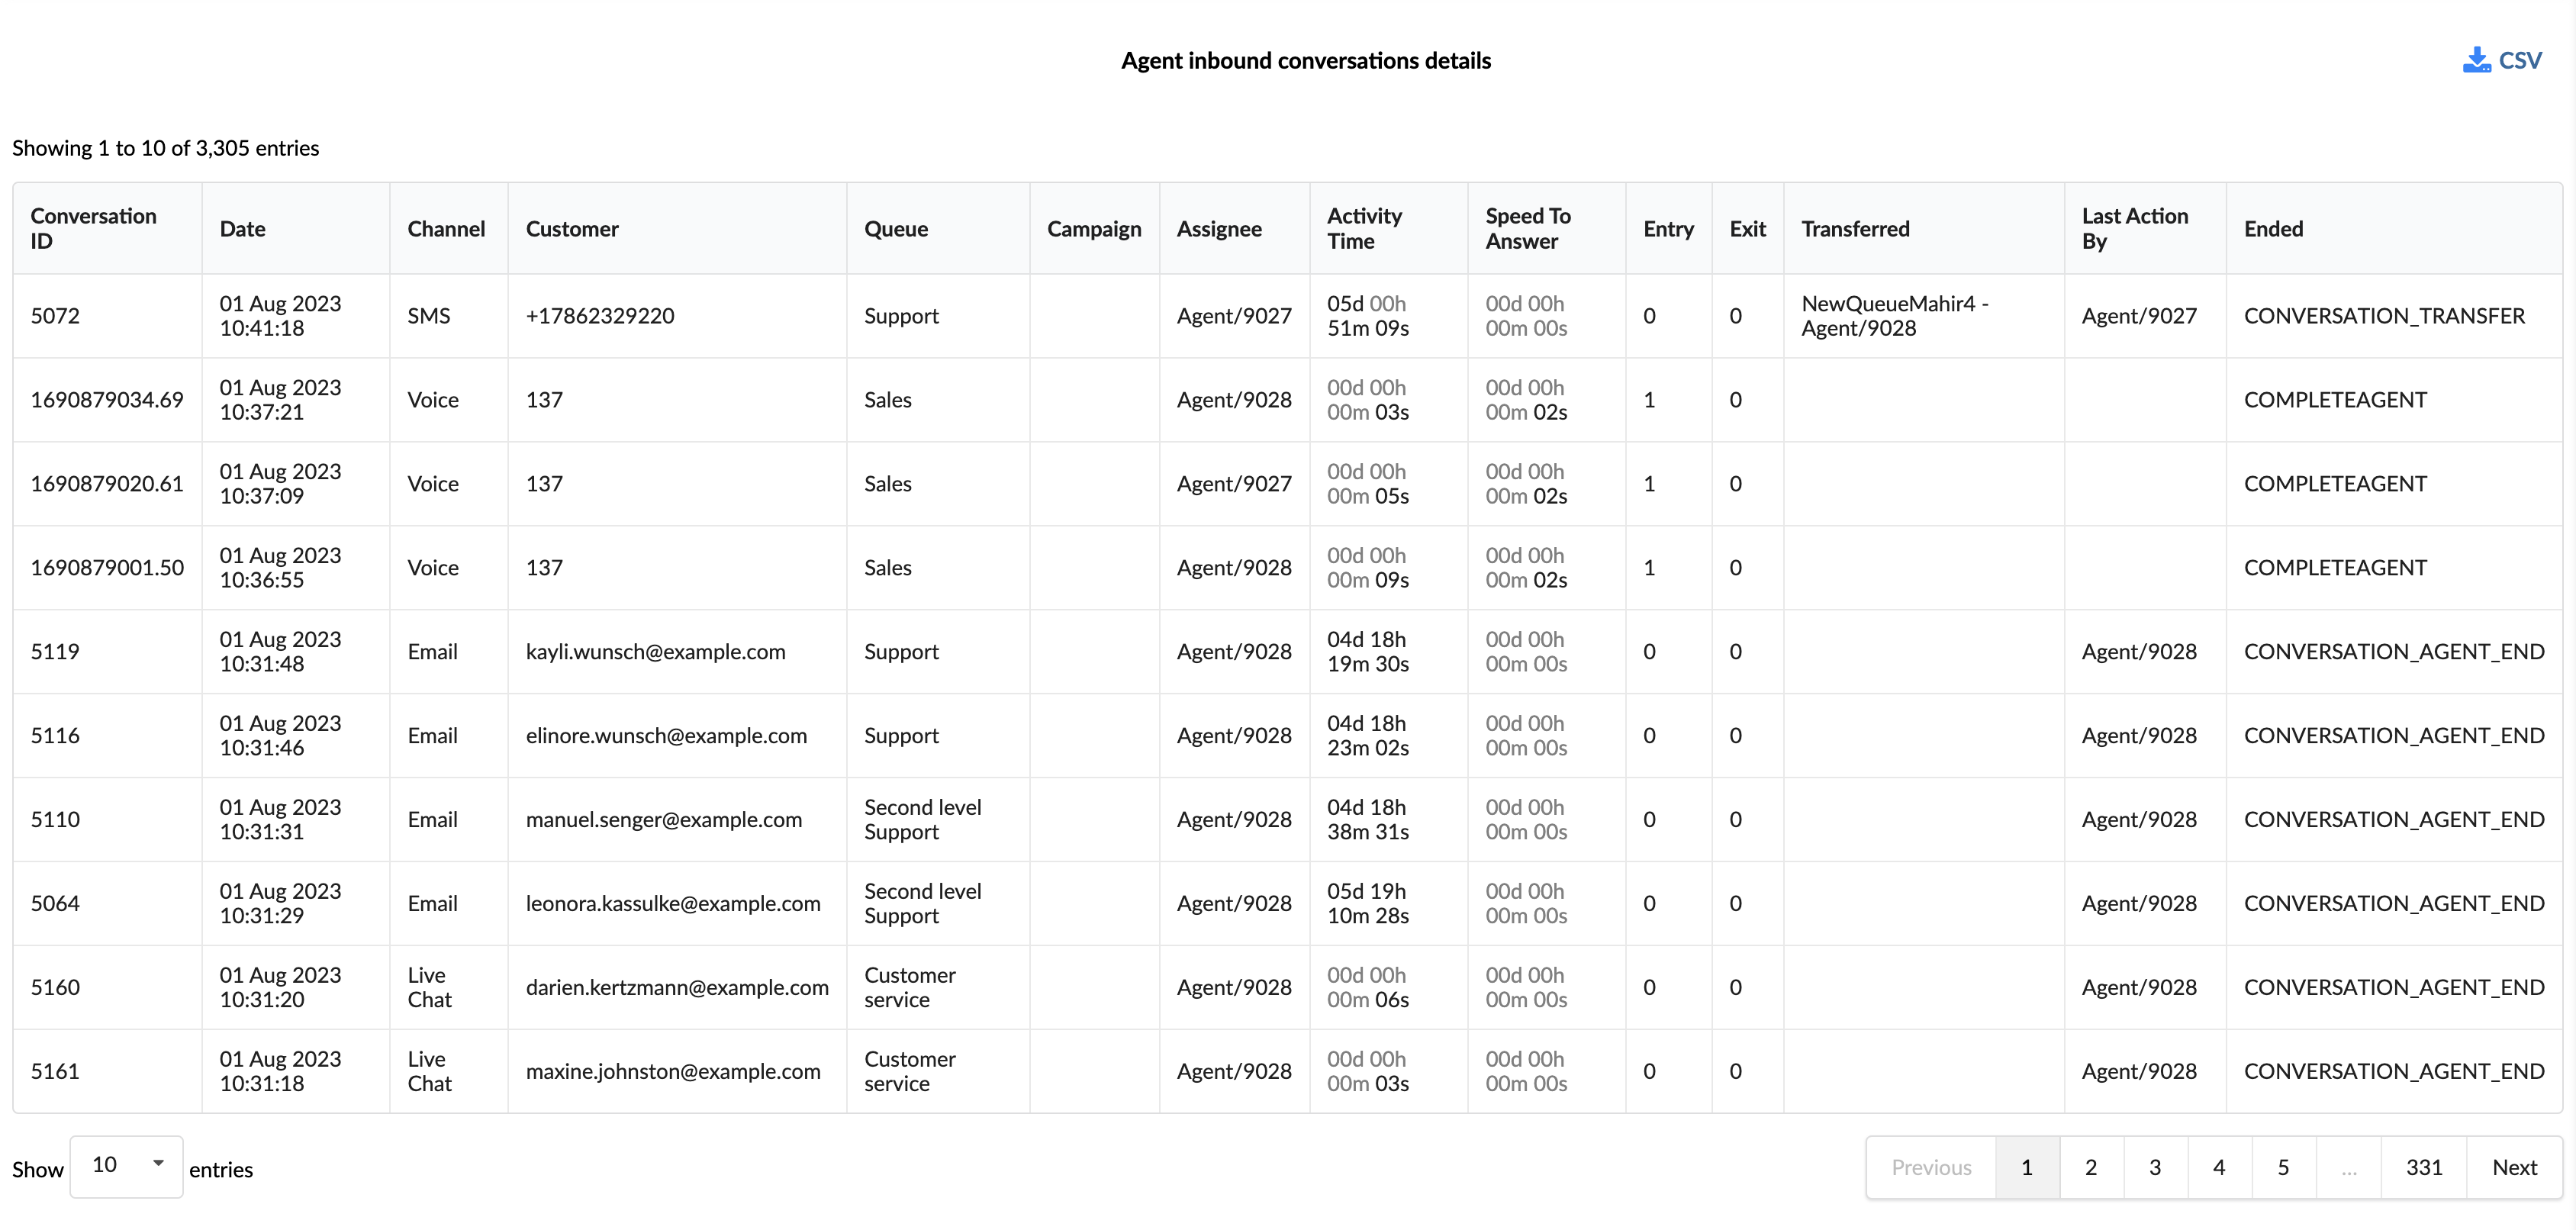
The "Agent conversations by queue breakdown" statistics table provides detailed information about each conversation handled by agents across different queues. The table consists of fourteen columns, each offering specific information about the conversations.
Conversation ID : this column lists the unique identifiers of each conversation.
Date : This column indicates the date on which each conversation took place.
Channel : This column indicates the communication channel used for each conversation, such as chat, email, or messaging.
Client : This column lists the customers involved in each conversation.
Queue : This column displays the queue in which each conversation was handled.
Campaign : This column indicates the campaign associated with each conversation.
Assignee : This column lists the agent assigned to each conversation.
Uptime : this column displays the total time that the agent spent on each conversation.
Answer speed : This column represents the time taken by the agent to answer each conversation.
Input : This column indicates the time at which each conversation entered the queue.
Output : this column indicates the time at which each conversation left the queue.
Transferred : This column indicates whether each conversation was transferred to another agent or another queue.
Last action by : this column indicates who performed the last action in the conversation, whether it was the agent or the customer.
Completed : This column indicates how each conversation ended.
Using the "Agent conversations by queue breakdown" statistics table, agents and managers can gain a granular understanding of each conversation, identify patterns and implement strategies to improve agent performance and customer service.
Chart of the total number of conversations/available agents by queue
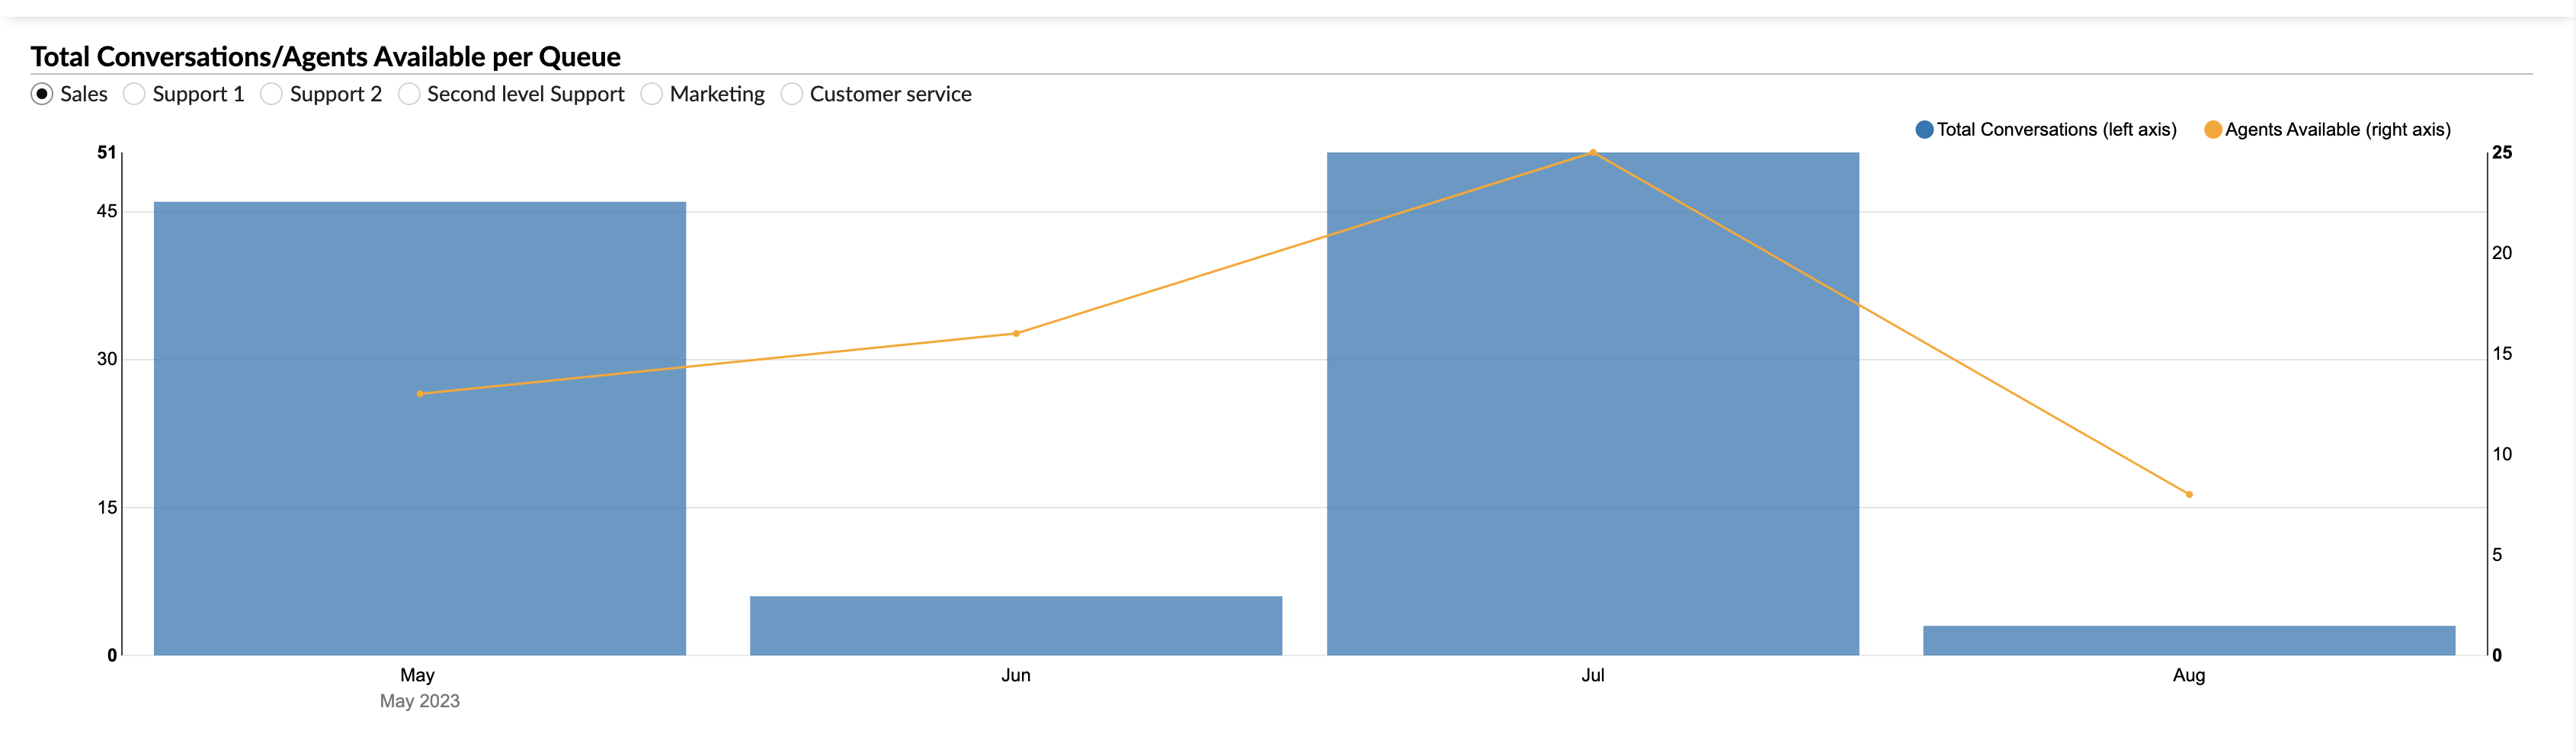
The “Total conversations/available agents by queue” chart provides a visual representation of the total number of conversations handled and agent availability across different queues. The chart is designed to allow clear comparison and analysis of these two key metrics.
Total conversations (left axis) : this metric is represented by vertical bars. Each bar corresponds to the total number of conversations handled in a specific queue. The height of the bar corresponds to the number of conversations, as shown on the left axis.
Available agents (right axis) : this metric is represented by a yellow line that intersects the vertical bars. Each point on the line corresponds to the number of agents available at a given moment, as shown on the right axis.
Users can select the queues they want to display on the graph using the radio buttons. By selecting a specific queue, the graph will display the corresponding data for that queue.
Using the "Total conversations/available agents by queue" chart, agents and managers can visually analyze conversation volume and agent availability across different queues, identify trends and implement strategies to improve performance and efficiency.
Chart of agent conversations by queue
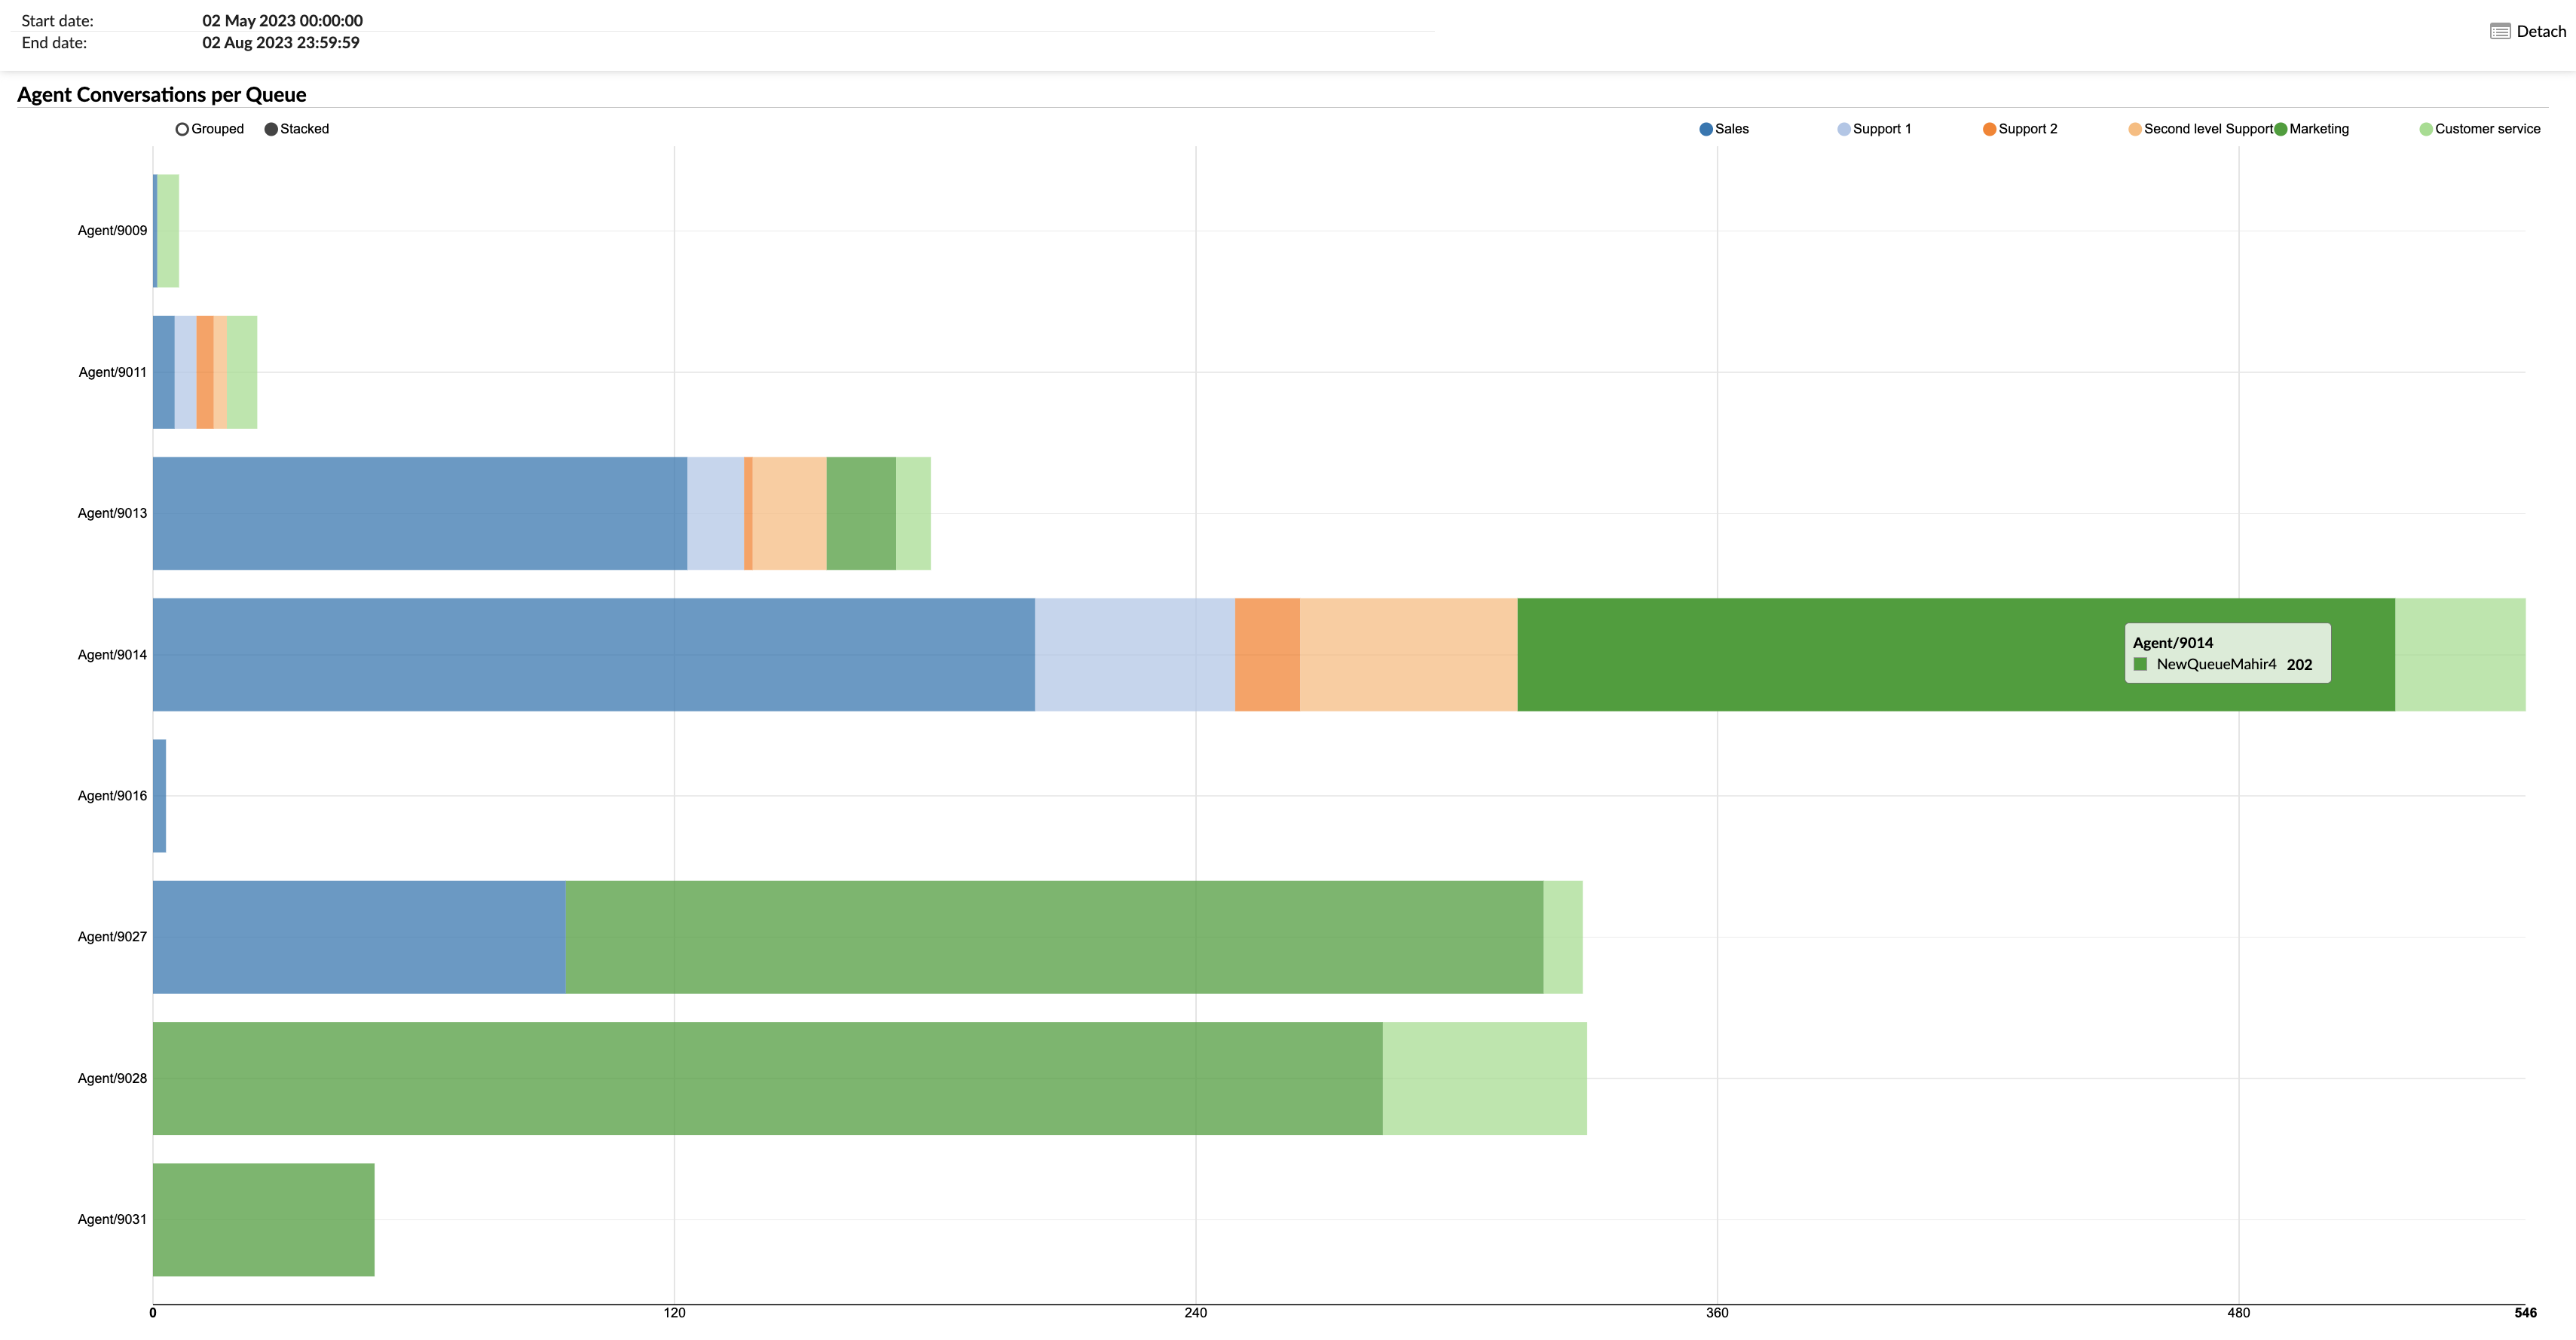
The “Agent conversations by queue” chart provides a visual representation of the number of conversations handled by each agent across different queues. The chart is designed to allow clear comparison and analysis of these key metrics.
Agent conversations : this metric is represented by horizontally arranged bars for each agent. Each bar corresponds to the total number of conversations handled by a specific agent. The length of the bar corresponds to the number of conversations.
Queues : conversations are then divided in each column by color, with each color representing a different queue. This provides a clear view of the distribution of conversations across queues for each agent.
Users can select the queues they want to display on the graph using the radio buttons. By selecting a specific queue, the graph will highlight the corresponding data for that queue in each agent's column.
Furthermore, by hovering over a specific color in an agent’s column, users can see the exact number of conversations handled by that agent for the corresponding queue.
Using the "Agent conversations by queue" chart, agents and managers can visually analyze the distribution of conversations between agents and queues, identify trends and implement strategies to improve performance and efficiency.
Agent [Average delay] and [Average activity duration] per queue graph
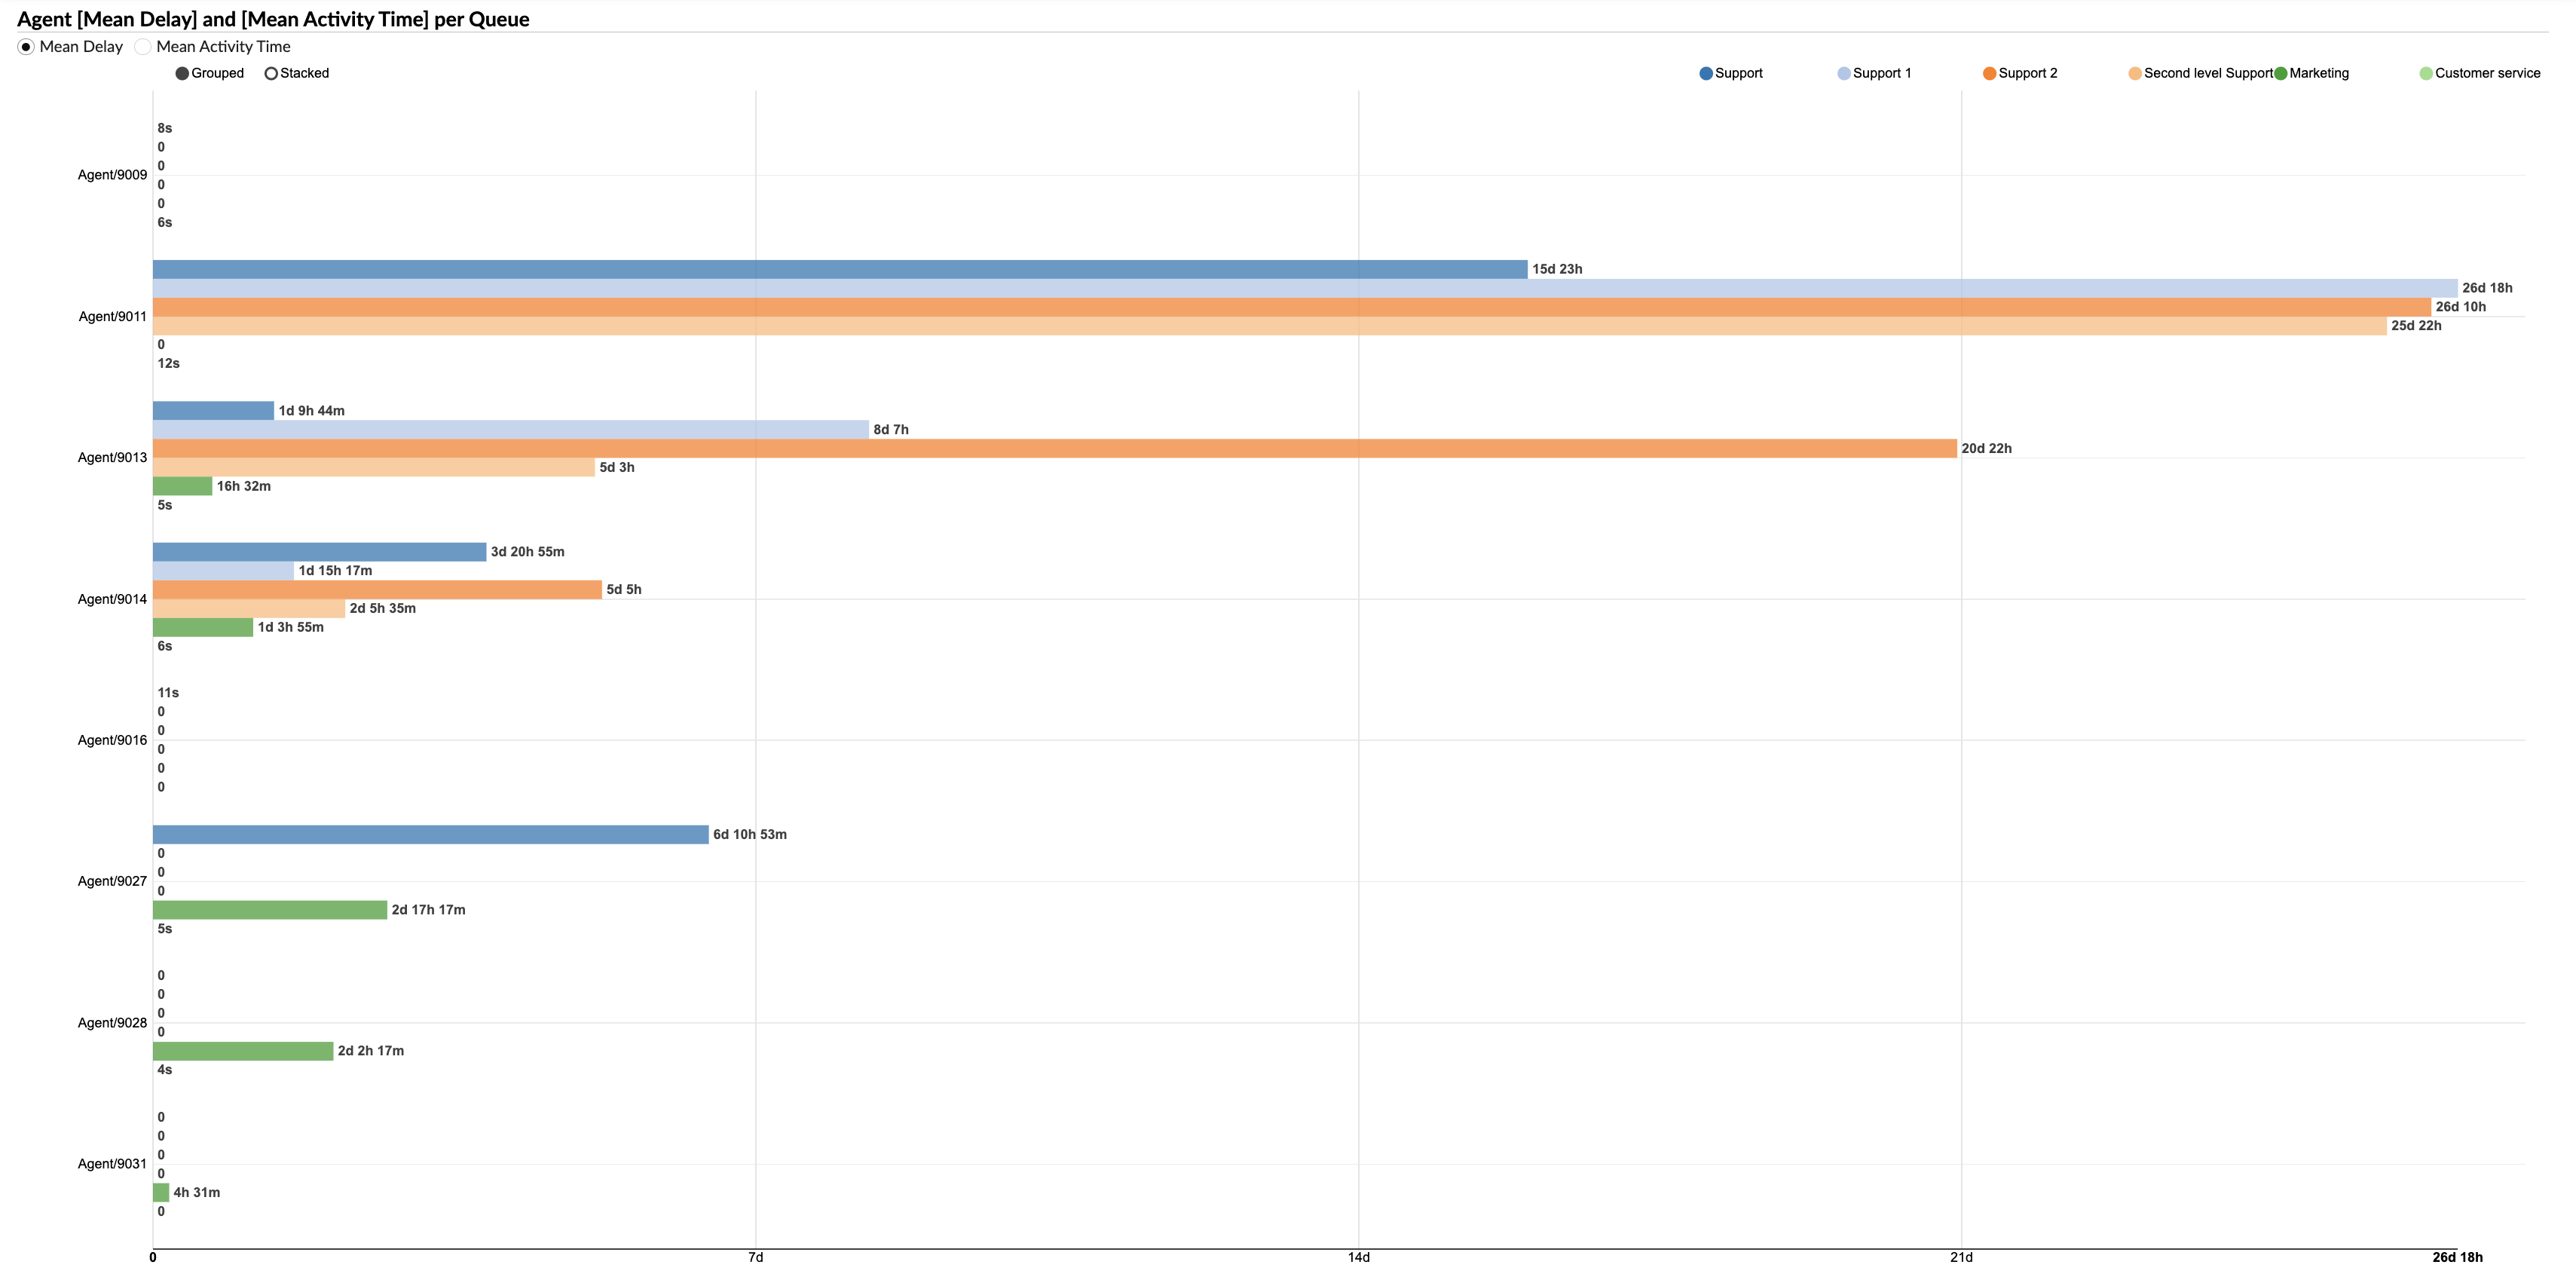
The “Average agent delay and average active time by queue” chart provides a visual representation of two key metrics for each agent across different queues. The chart is designed to allow clear comparison and analysis of these metrics.
Average delay and average uptime : users can select either of these metrics to display on the chart using the radio buttons. The “Average Delay” represents the average delay before each agent answers a conversation, while the “Average Activity Time” indicates the average time the agent spends on each conversation.
Queues : each queue is represented by a different color, as indicated by colored radio buttons. Users can select a specific queue to display the corresponding data for that queue.
Agent metrics : the selected metric is represented by columns arranged horizontally for each agent. Each column corresponds to the selected metric (either the average delay or the average activity time) for a specific agent. The length of the column corresponds to the metric value.
Using the "Average agent delay and average active time by queue" chart, agents and managers can visually analyze these key performance metrics across agents and queues, identify trends and implement strategies to improve performance and efficiency.
Missed conversations by agent by channel
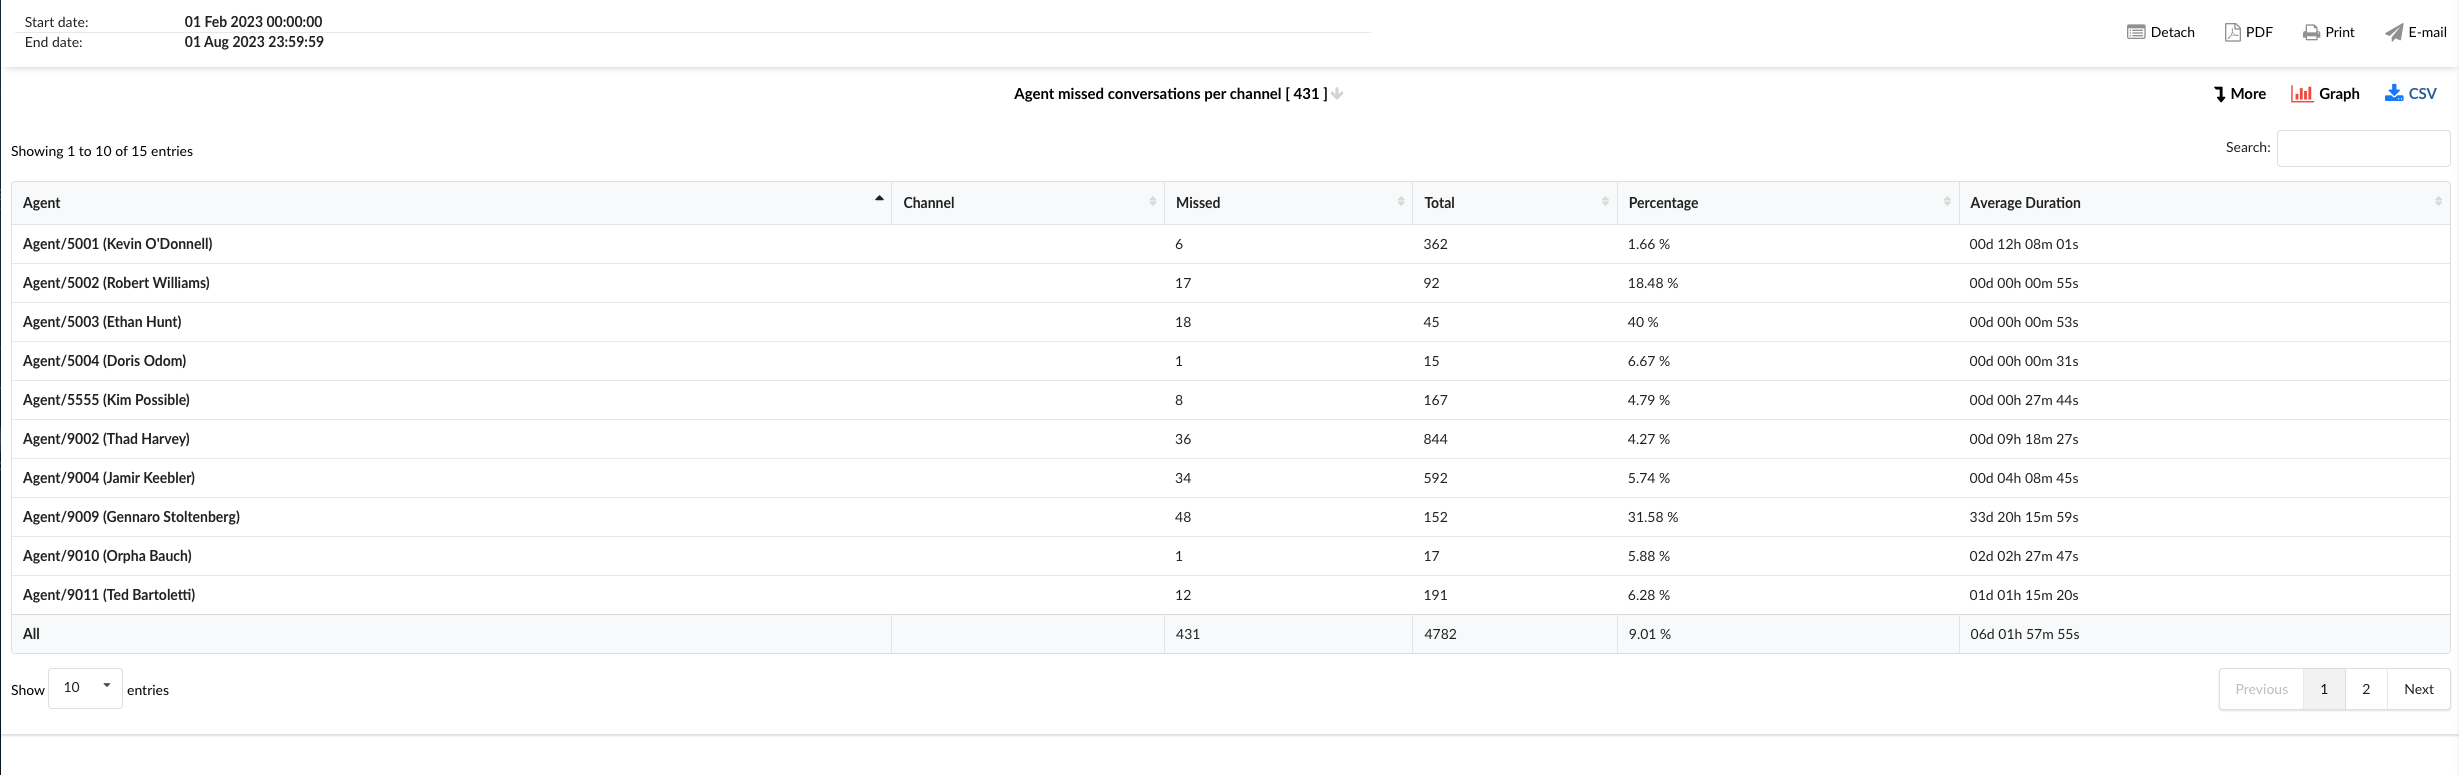
The "Missed conversations by agent by channel" report provides an in-depth examination of interactions missed by agents across different communication channels. This analysis helps identify areas where customer interactions may have been overlooked, thereby enabling businesses to close gaps in their service. The table is divided into six columns, each providing specific details about the missed conversations.
Agent : This column lists the names of all agents.
Channel : this column indicates the communication channel for the missed conversations, such as chat, email, or messaging.
Missed : this column displays the total number of conversations missed by each agent in each channel.
Total : this column displays the total number of conversations assigned to each agent in each channel, including handled and missed conversations.
Percentage : This column represents the percentage of conversations missed by each agent in each channel, calculated as the number of missed conversations divided by the total number of conversations.
Average duration : This column displays the average duration of missed conversations for each agent of each channel.
Using the "Missed conversations by agent by channel" statistics table, agents and managers can gain insights into each agent's performance across different channels, identify areas for improvement and implement strategies to reduce the number of missed conversations.
Missed conversations by agent by channel
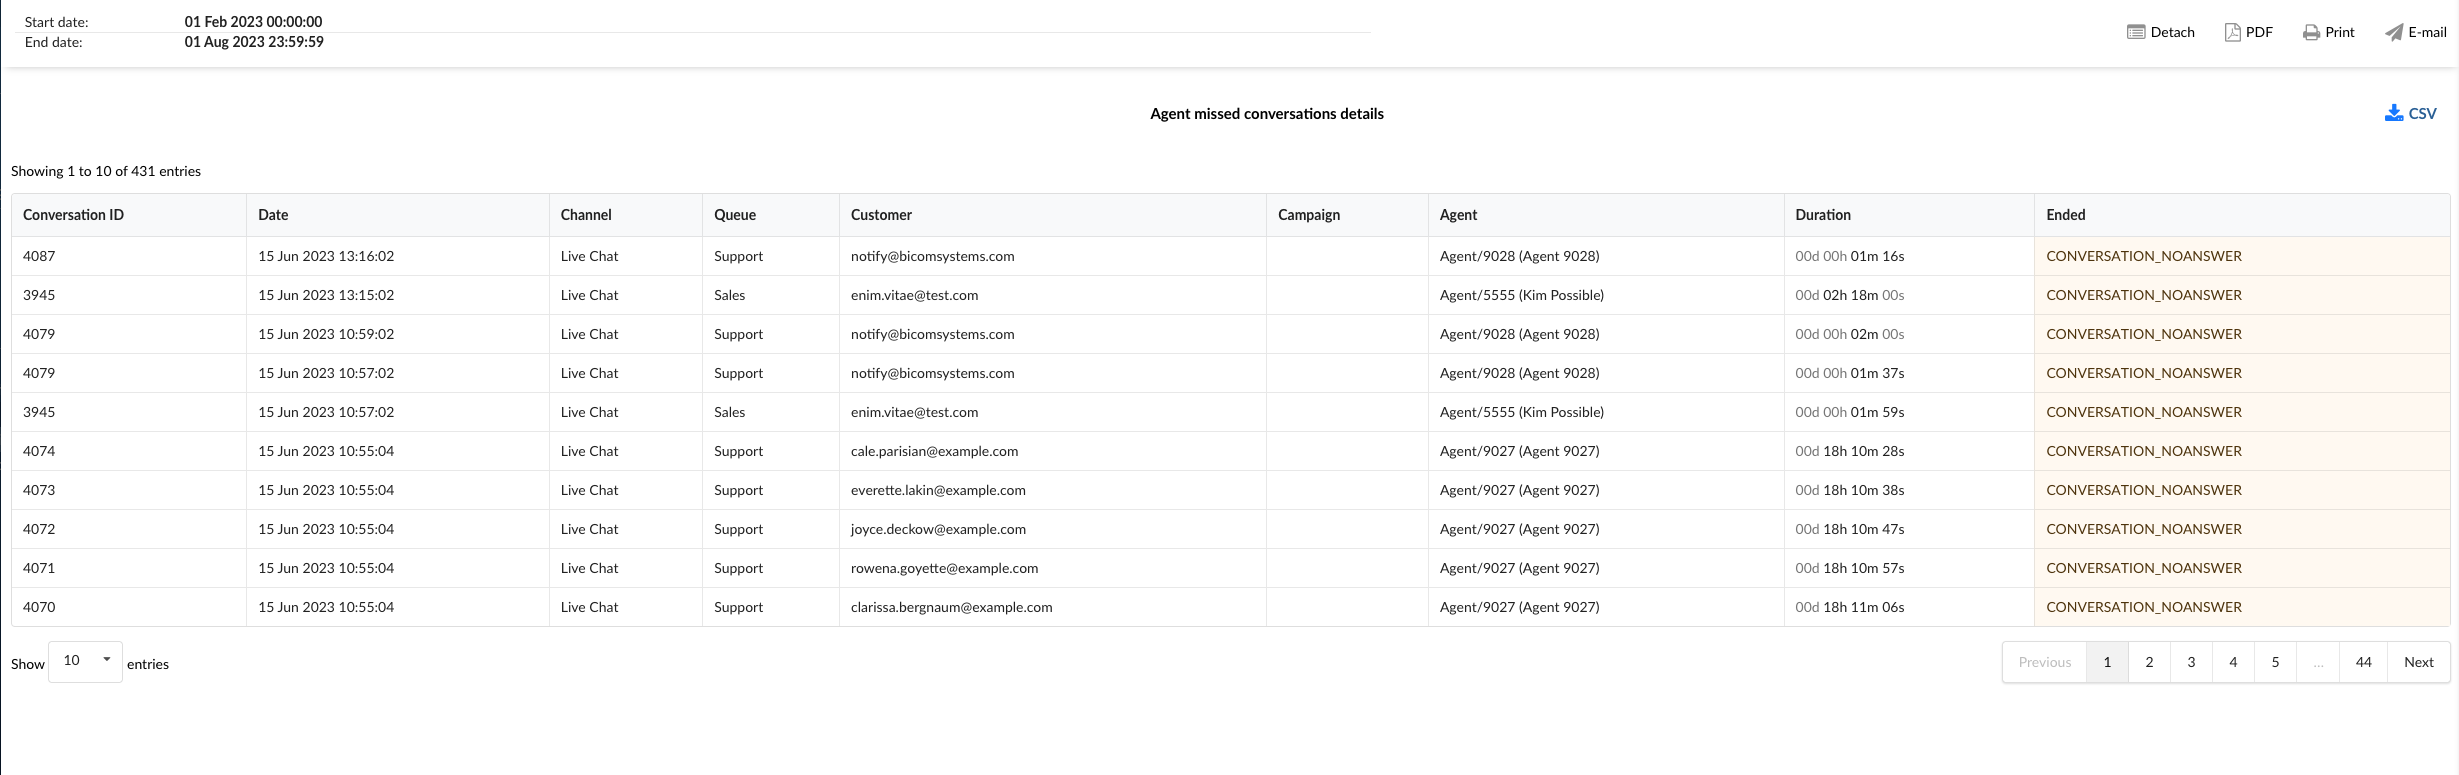
The "Missed conversations by agent by channel breakdown" statistics table provides detailed information about each missed conversation across different communication channels. The table consists of nine columns, each offering specific information about the missed conversations.
Conversation ID : this column lists the unique identifiers of each missed conversation.
Date : This column indicates the date on which each missed conversation took place.
Channel : This column indicates the communication channel of the missed conversation, such as chat, email, or messaging.
Queue : This column displays the queue to which each missed conversation was assigned.
Client : This column lists the customers involved in each missed conversation.
Campaign : This column indicates the campaign associated with each missed conversation.
Agent : This column lists the agent who missed each conversation.
Duration : This column displays the duration of each missed conversation.
Completed : This column indicates how each missed conversation was concluded.
Using the "Missed conversations by agent by channel breakdown" statistics table, agents and managers can gain a granular understanding of each missed conversation, identify patterns and implement strategies to improve agent performance and reduce the number of missed conversations.
Chart of missed conversations per agent by channel
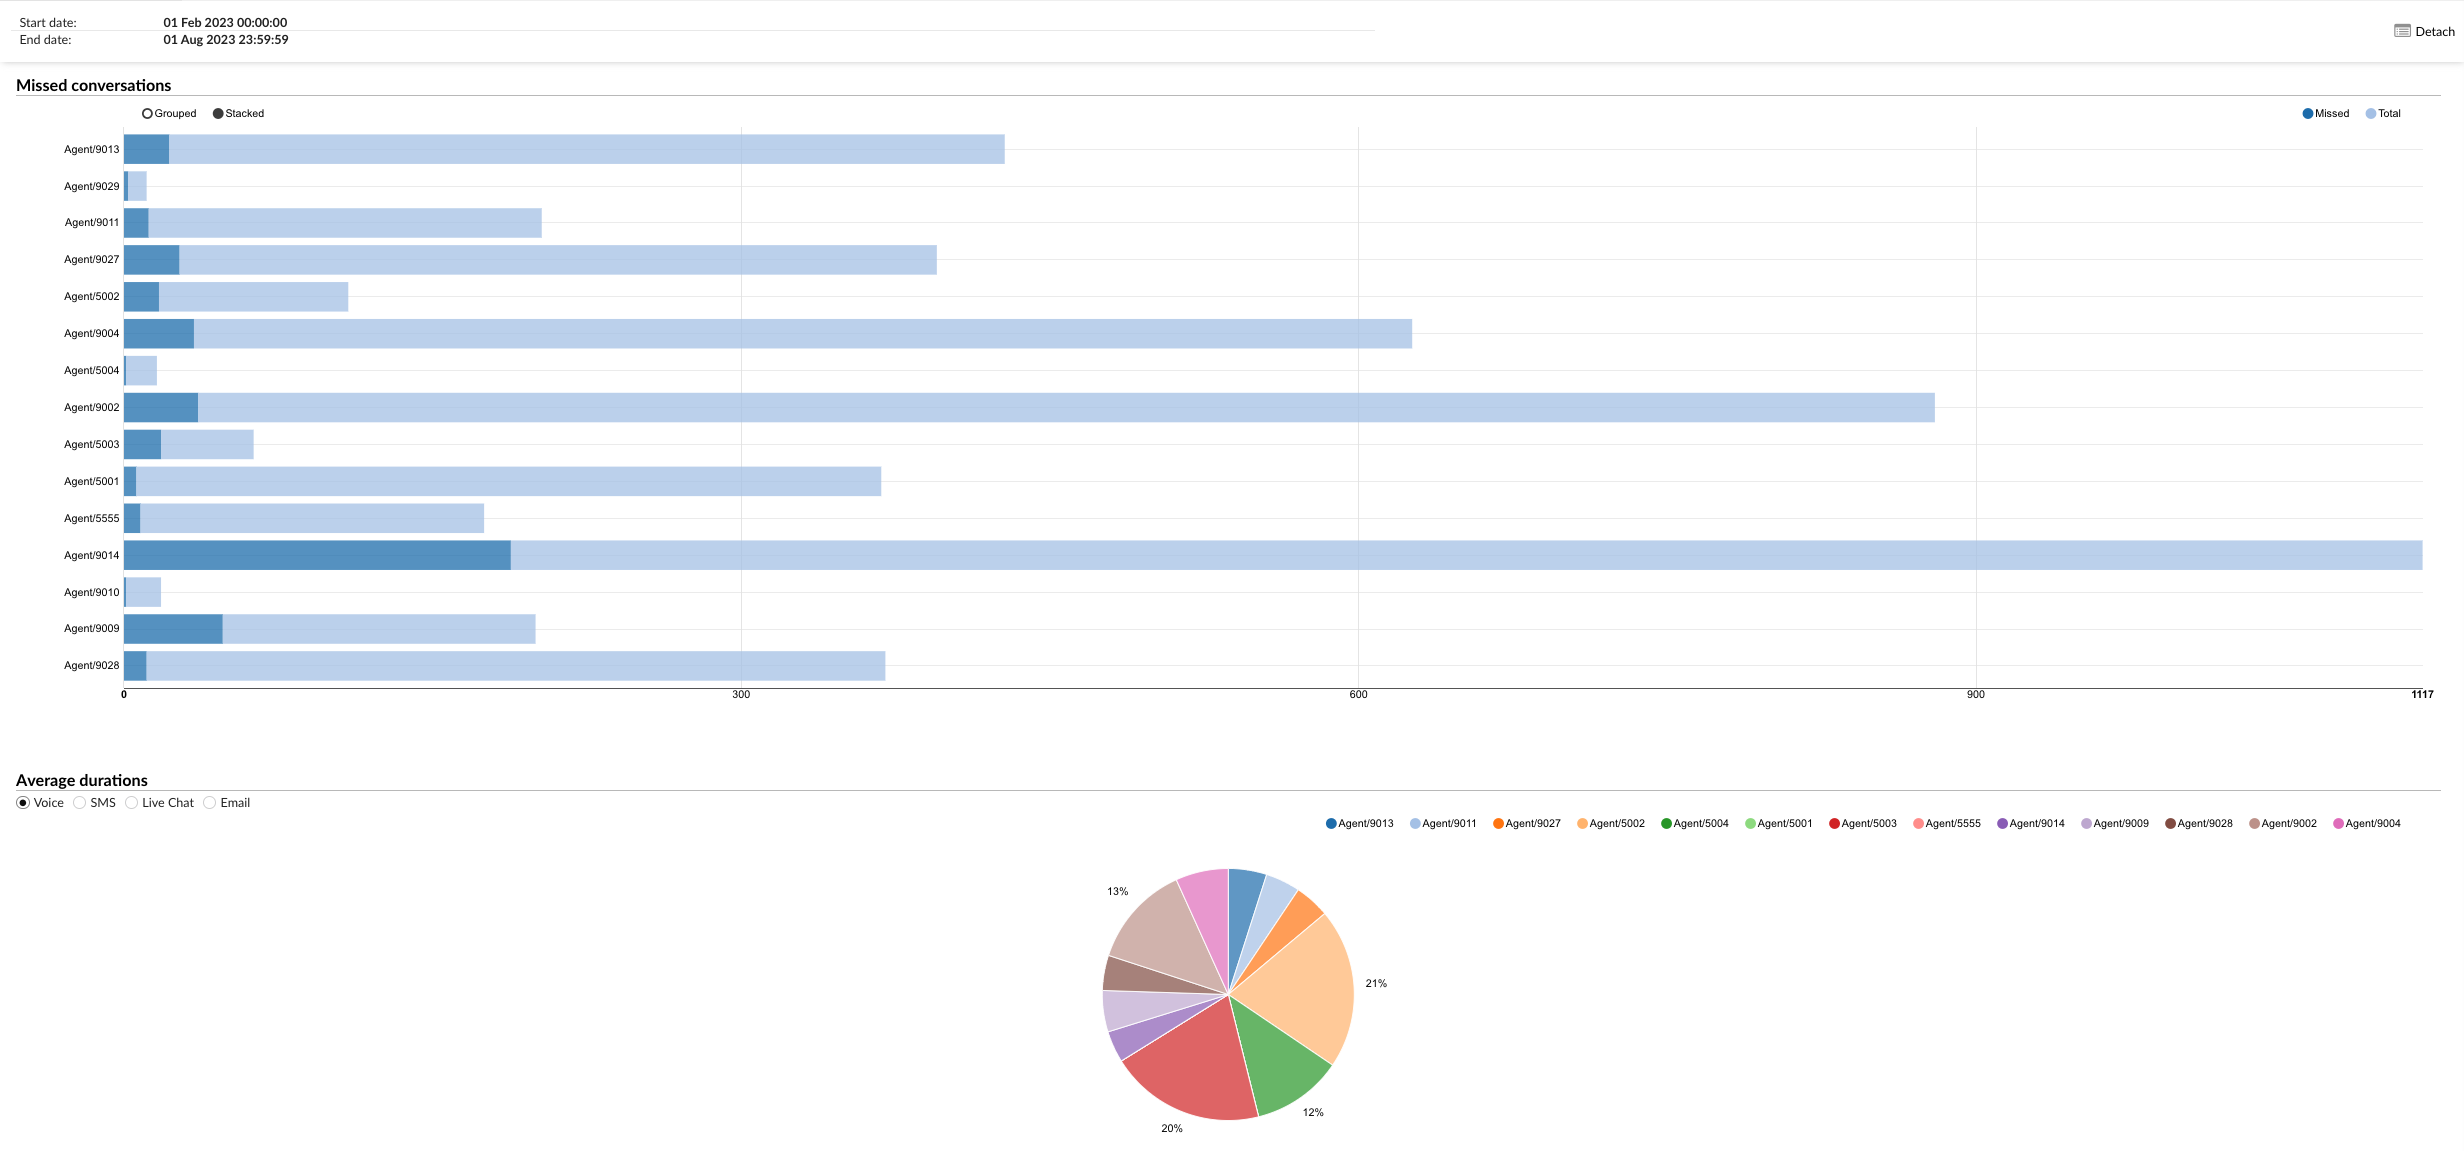
The “Missed conversations by agent by channel” chart provides a visual representation of the conversations missed by each agent across different communication channels. The chart is divided into two sections, each providing specific information about the missed conversations.
Missed conversations : this section displays horizontally arranged bars for each agent. Each bar indicates the total number of conversations assigned to the agent and the number of missed conversations. The length of the bar represents the total number of conversations, while the highlighted part of the bar represents the number of missed conversations. These bars can be aligned in two ways: “Grouped” and “stacked”, offering different perspectives on the data.
Average durations : this section allows users to select specific agents and channels to display a pie chart that represents the average conversation duration. Users can choose to display data for an individual agent, all agents or a selected group of agents, across various channels such as voice, SMS, live chat and email. Each segment of the pie chart corresponds to the average conversation duration of an agent for a specific channel. The size of each segment is proportional to the average duration, effectively visualizing the average conversation durations per channel for each agent.
Using the "Missed conversations by agent by channel" chart, agents and managers can visually analyze each agent's performance across different channels, identify trends and implement strategies to reduce the number of missed conversations.
Missed conversations by agent by queue
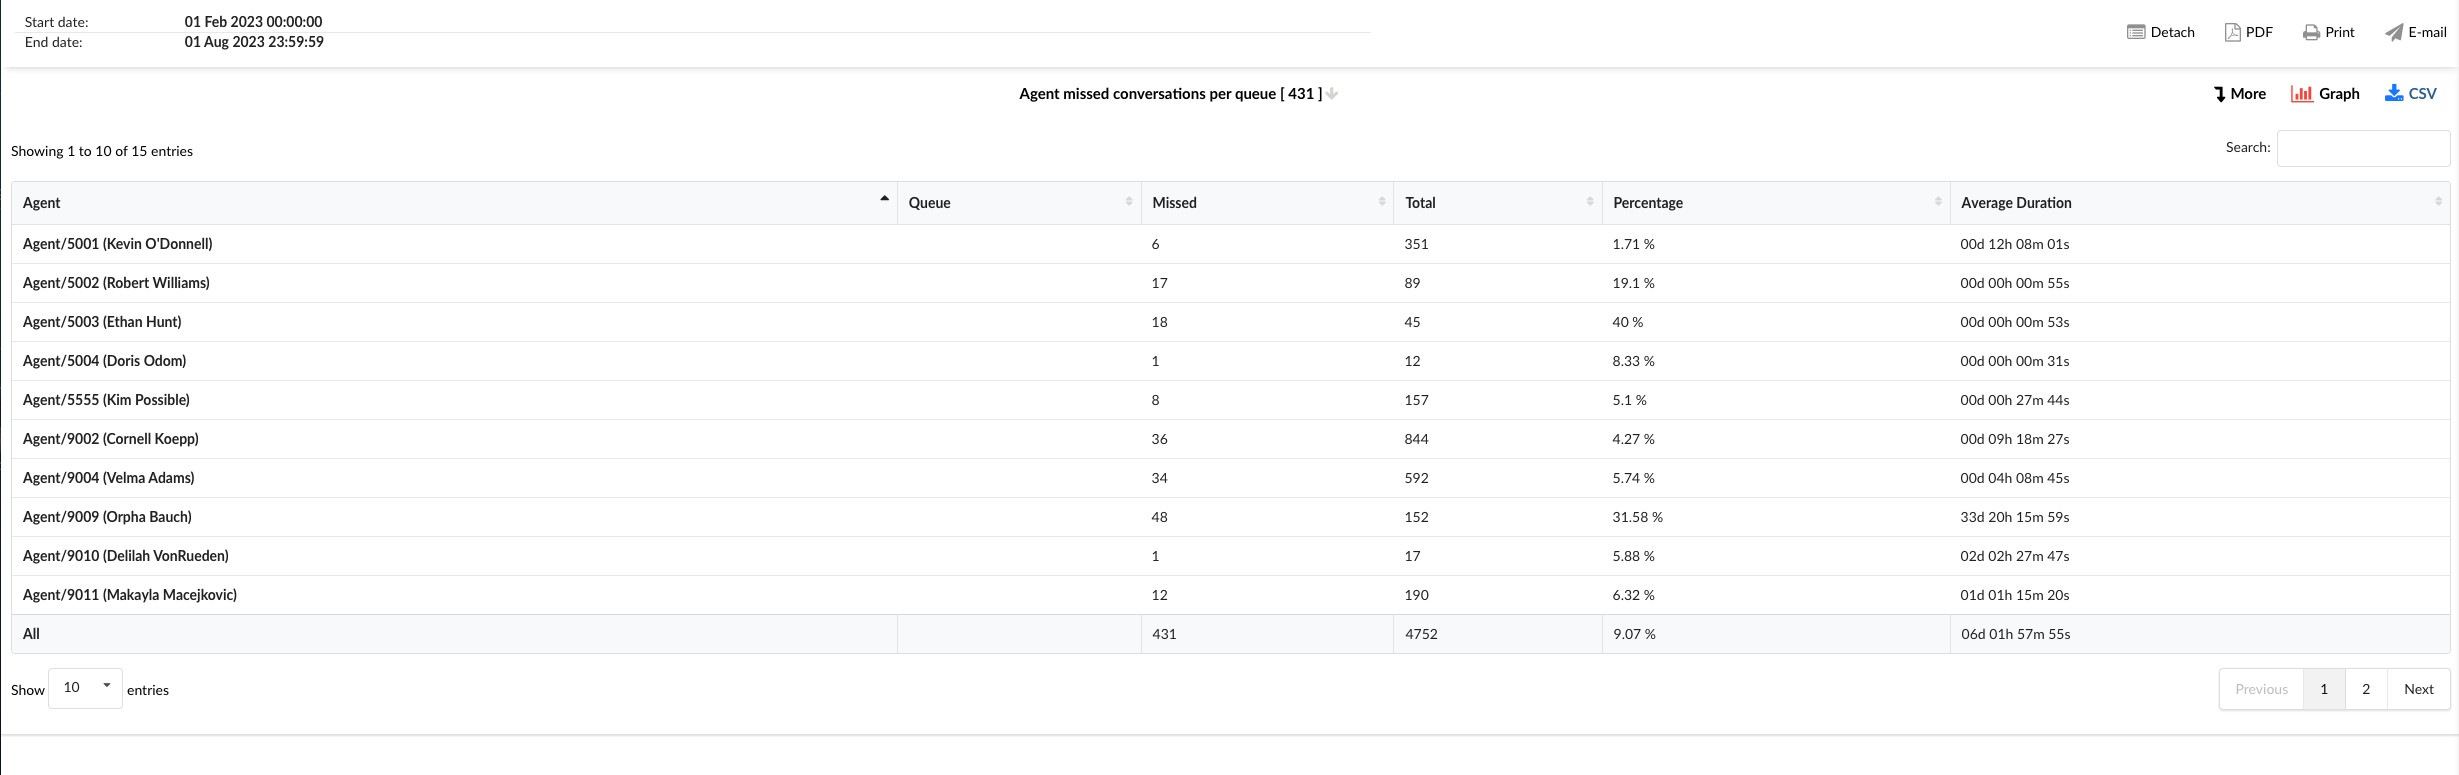
The "Missed conversations by agent by queue" statistics table provides a detailed overview of the conversations missed by each agent across different queues. The table is divided into six columns, each providing specific details about the missed conversations.
Agent : This column lists the names of all agents.
Queue : This column indicates the queue in which the conversations were missed.
Missed : this column displays the total number of conversations missed by each agent in each queue.
Total : this column displays the total number of conversations assigned to each agent in each queue, including handled and missed conversations.
Percentage : This column represents the percentage of conversations missed by each agent in each queue, calculated as the number of missed conversations divided by the total number of conversations.
Average duration : This column displays the average duration of missed conversations for each agent of each queue.
Using the "Missed conversations by agent by queue" statistics table, agents and managers can gain insights into each agent's performance across different queues, identify areas for improvement and implement strategies to reduce the number of missed conversations.
Missed conversations by agent by queue distribution
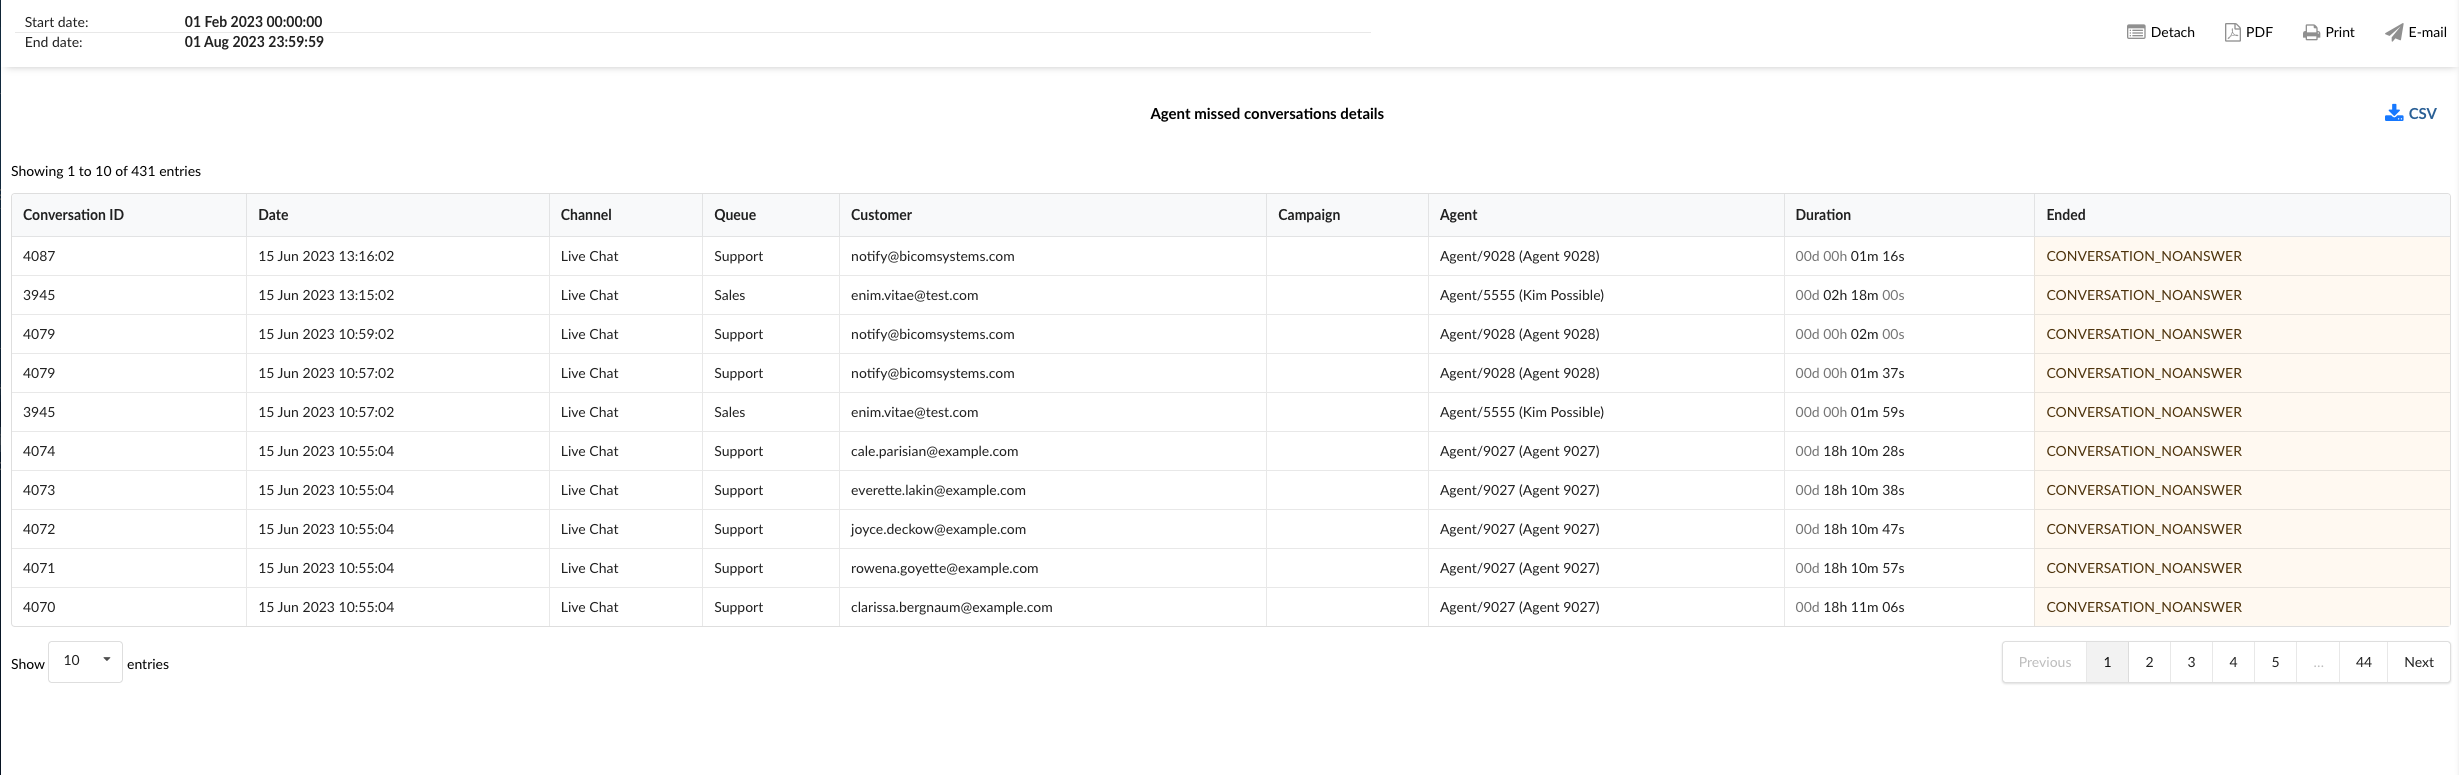
The "Missed conversations by agent by queue breakdown" statistics table provides detailed information about each missed conversation across different queues. The table consists of nine columns, each offering specific information about the missed conversations.
Conversation ID : this column lists the unique identifiers of each missed conversation.
Date : This column indicates the date on which each missed conversation took place.
Channel : This column indicates the communication channel of the missed conversation, such as chat, email, or messaging.
Queue : This column displays the queue to which each missed conversation was assigned.
Client : This column lists the customers involved in each missed conversation.
Campaign : This column indicates the campaign associated with each missed conversation.
Agent : This column lists the agent who missed each conversation.
Duration : This column displays the duration of each missed conversation.
Completed : This column indicates how each missed conversation was concluded.
Using the "Missed conversations by agent by queue breakdown" statistics table, agents and managers can gain a granular understanding of each missed conversation, identify patterns and implement strategies to improve agent performance and reduce the number of missed conversations.
Chart of missed conversations per agent by queue
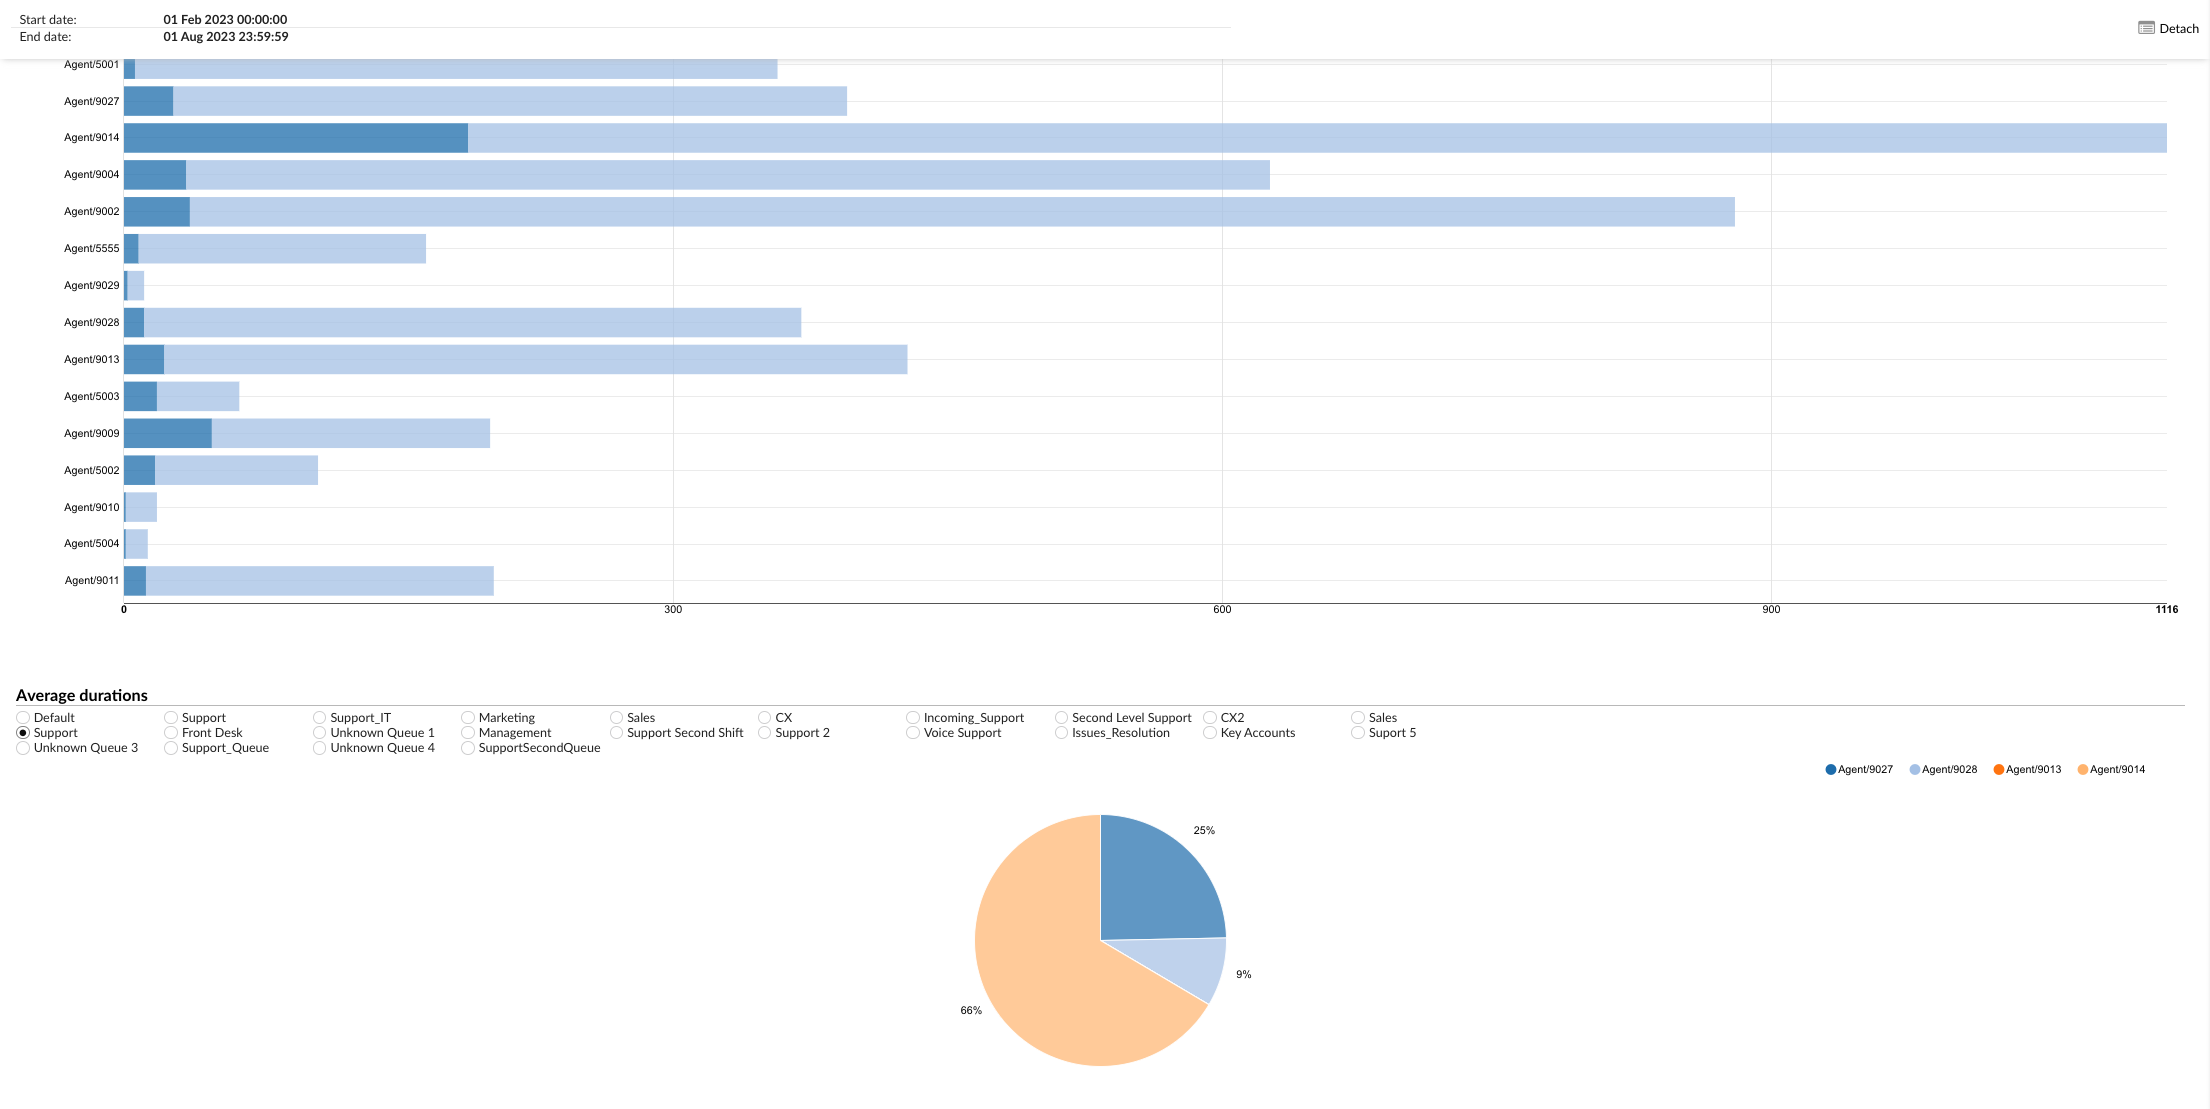
The “Missed conversations by agent by queue” chart provides a visual representation of the conversations missed by each agent across different queues. The chart is divided into two sections, each providing specific information about the missed conversations.
Missed conversations : this section displays horizontally arranged bars for each agent. Each bar indicates the total number of conversations assigned to the agent and the number of missed conversations. The length of the bar represents the total number of conversations, while the highlighted part of the bar represents the number of missed conversations.
Average durations : in this section, users can select a specific queue to display a pie chart that shows the average duration of missed conversations per agent in that queue. Each slice of the pie chart represents an agent and the size of the slice corresponds to the average duration of the conversations missed by that agent.
Using the "Missed conversations by agent by queue" chart, agents and managers can visually analyze each agent's performance across different queues, identify trends and implement strategies to reduce the number of missed conversations.
The agent pauses the report
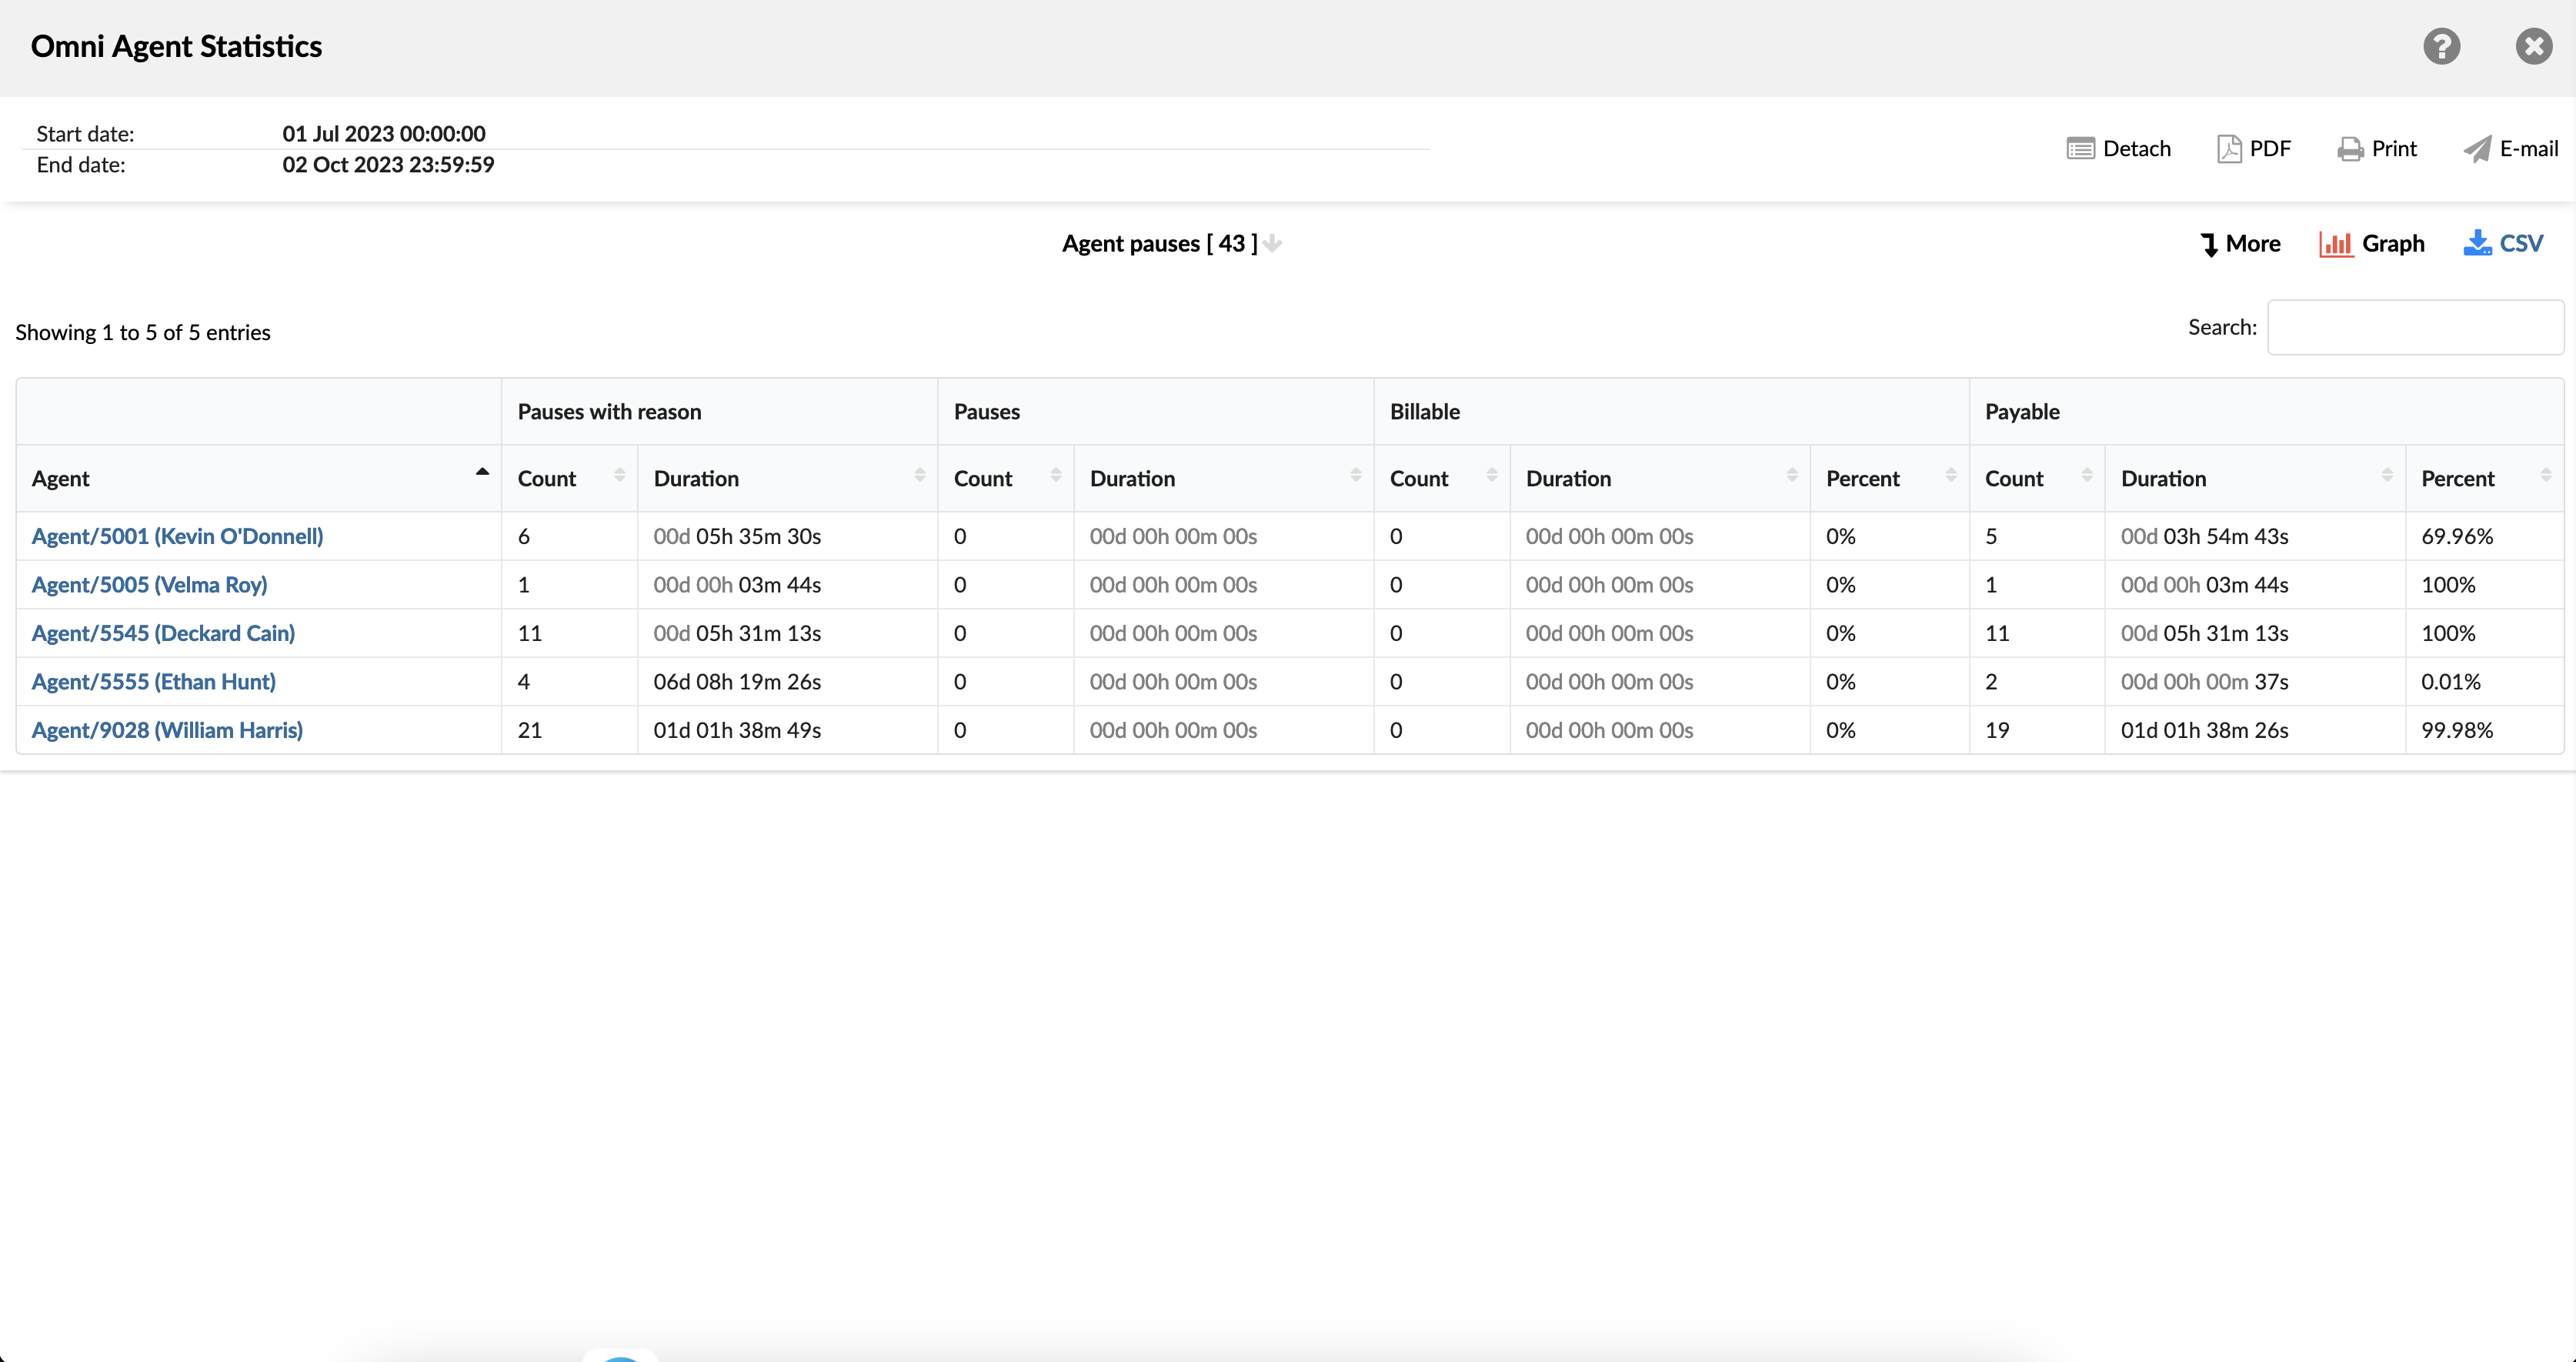
A statistical report on agent breaks provides detailed information about the breaks taken by agents in a work environment. Breaks are generally short pauses that agents take during their shift for various reasons, such as rest, personal needs, or specific activities.
Supervisors can use these reports to analyze whether the timing and frequency of pauses affect overall service levels and customer satisfaction. In addition, by studying these reports, supervisors can identify opportunities to optimize pause schedules, offer additional training or adjust staffing levels to ensure that service quality remains high.
The agent pauses the outage
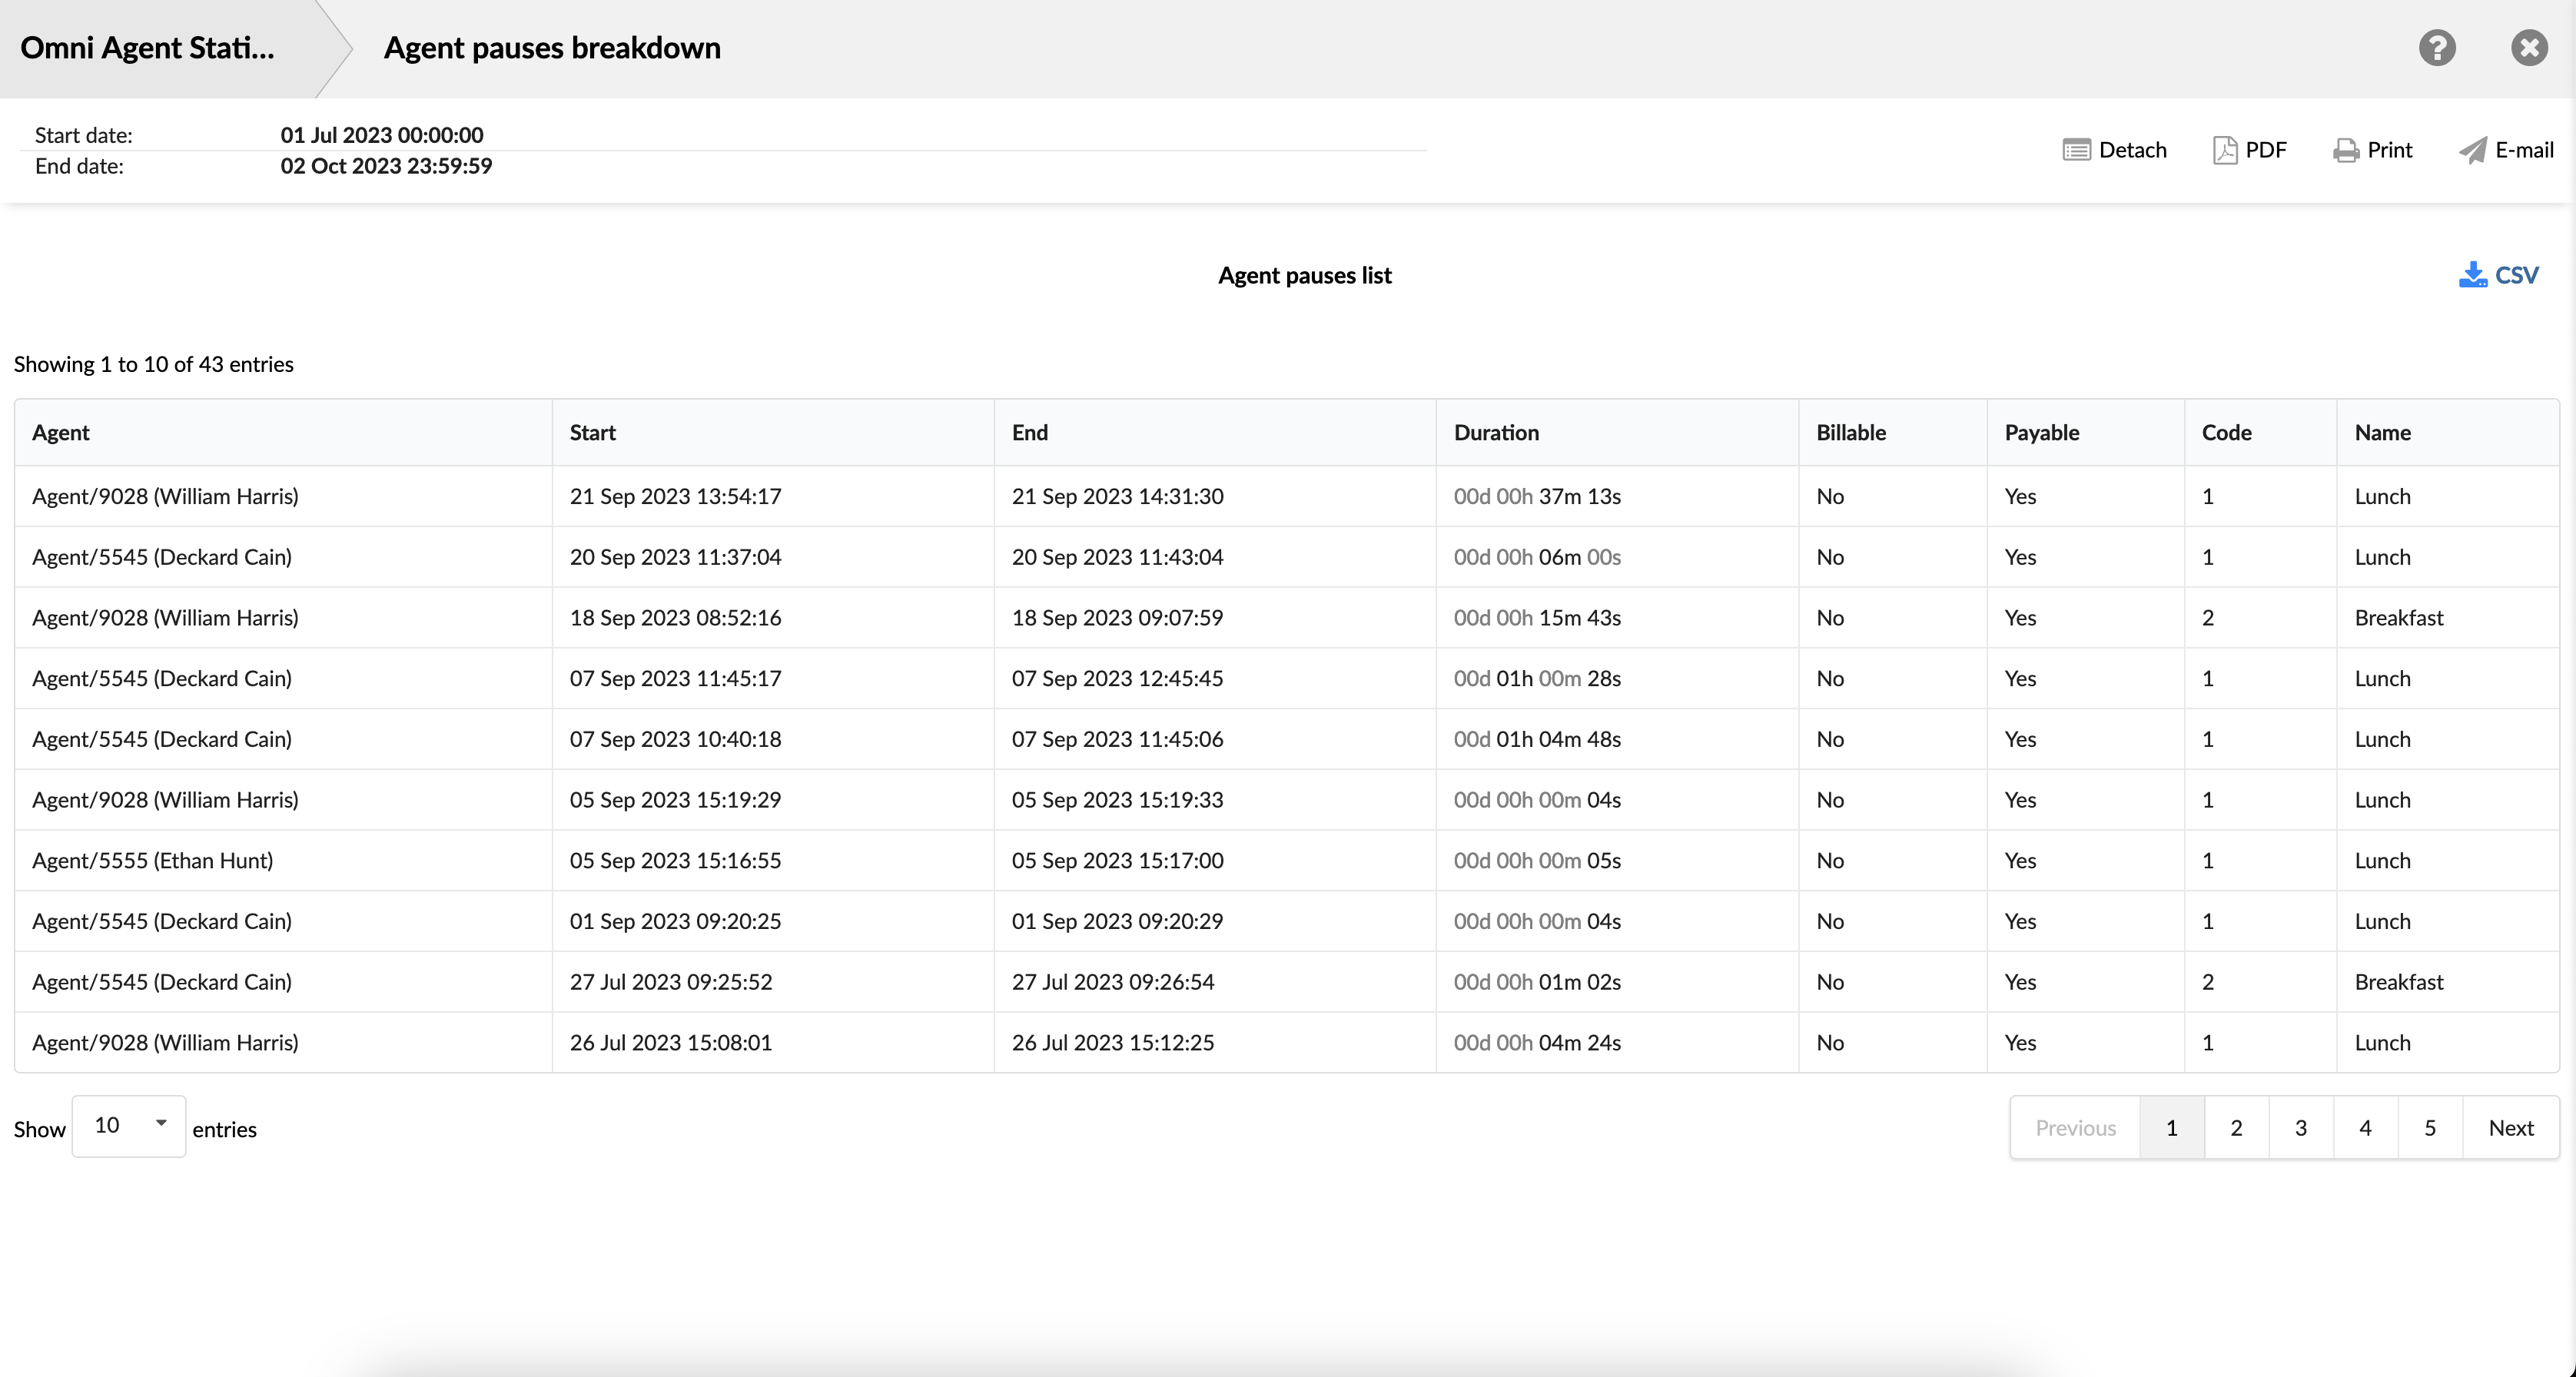
The agent break breakdown report provides details on when agents took breaks. It includes information such as the agent's name, when the break started and ended, its duration, and whether it is a billable break or not.
Agent Pauses Chart
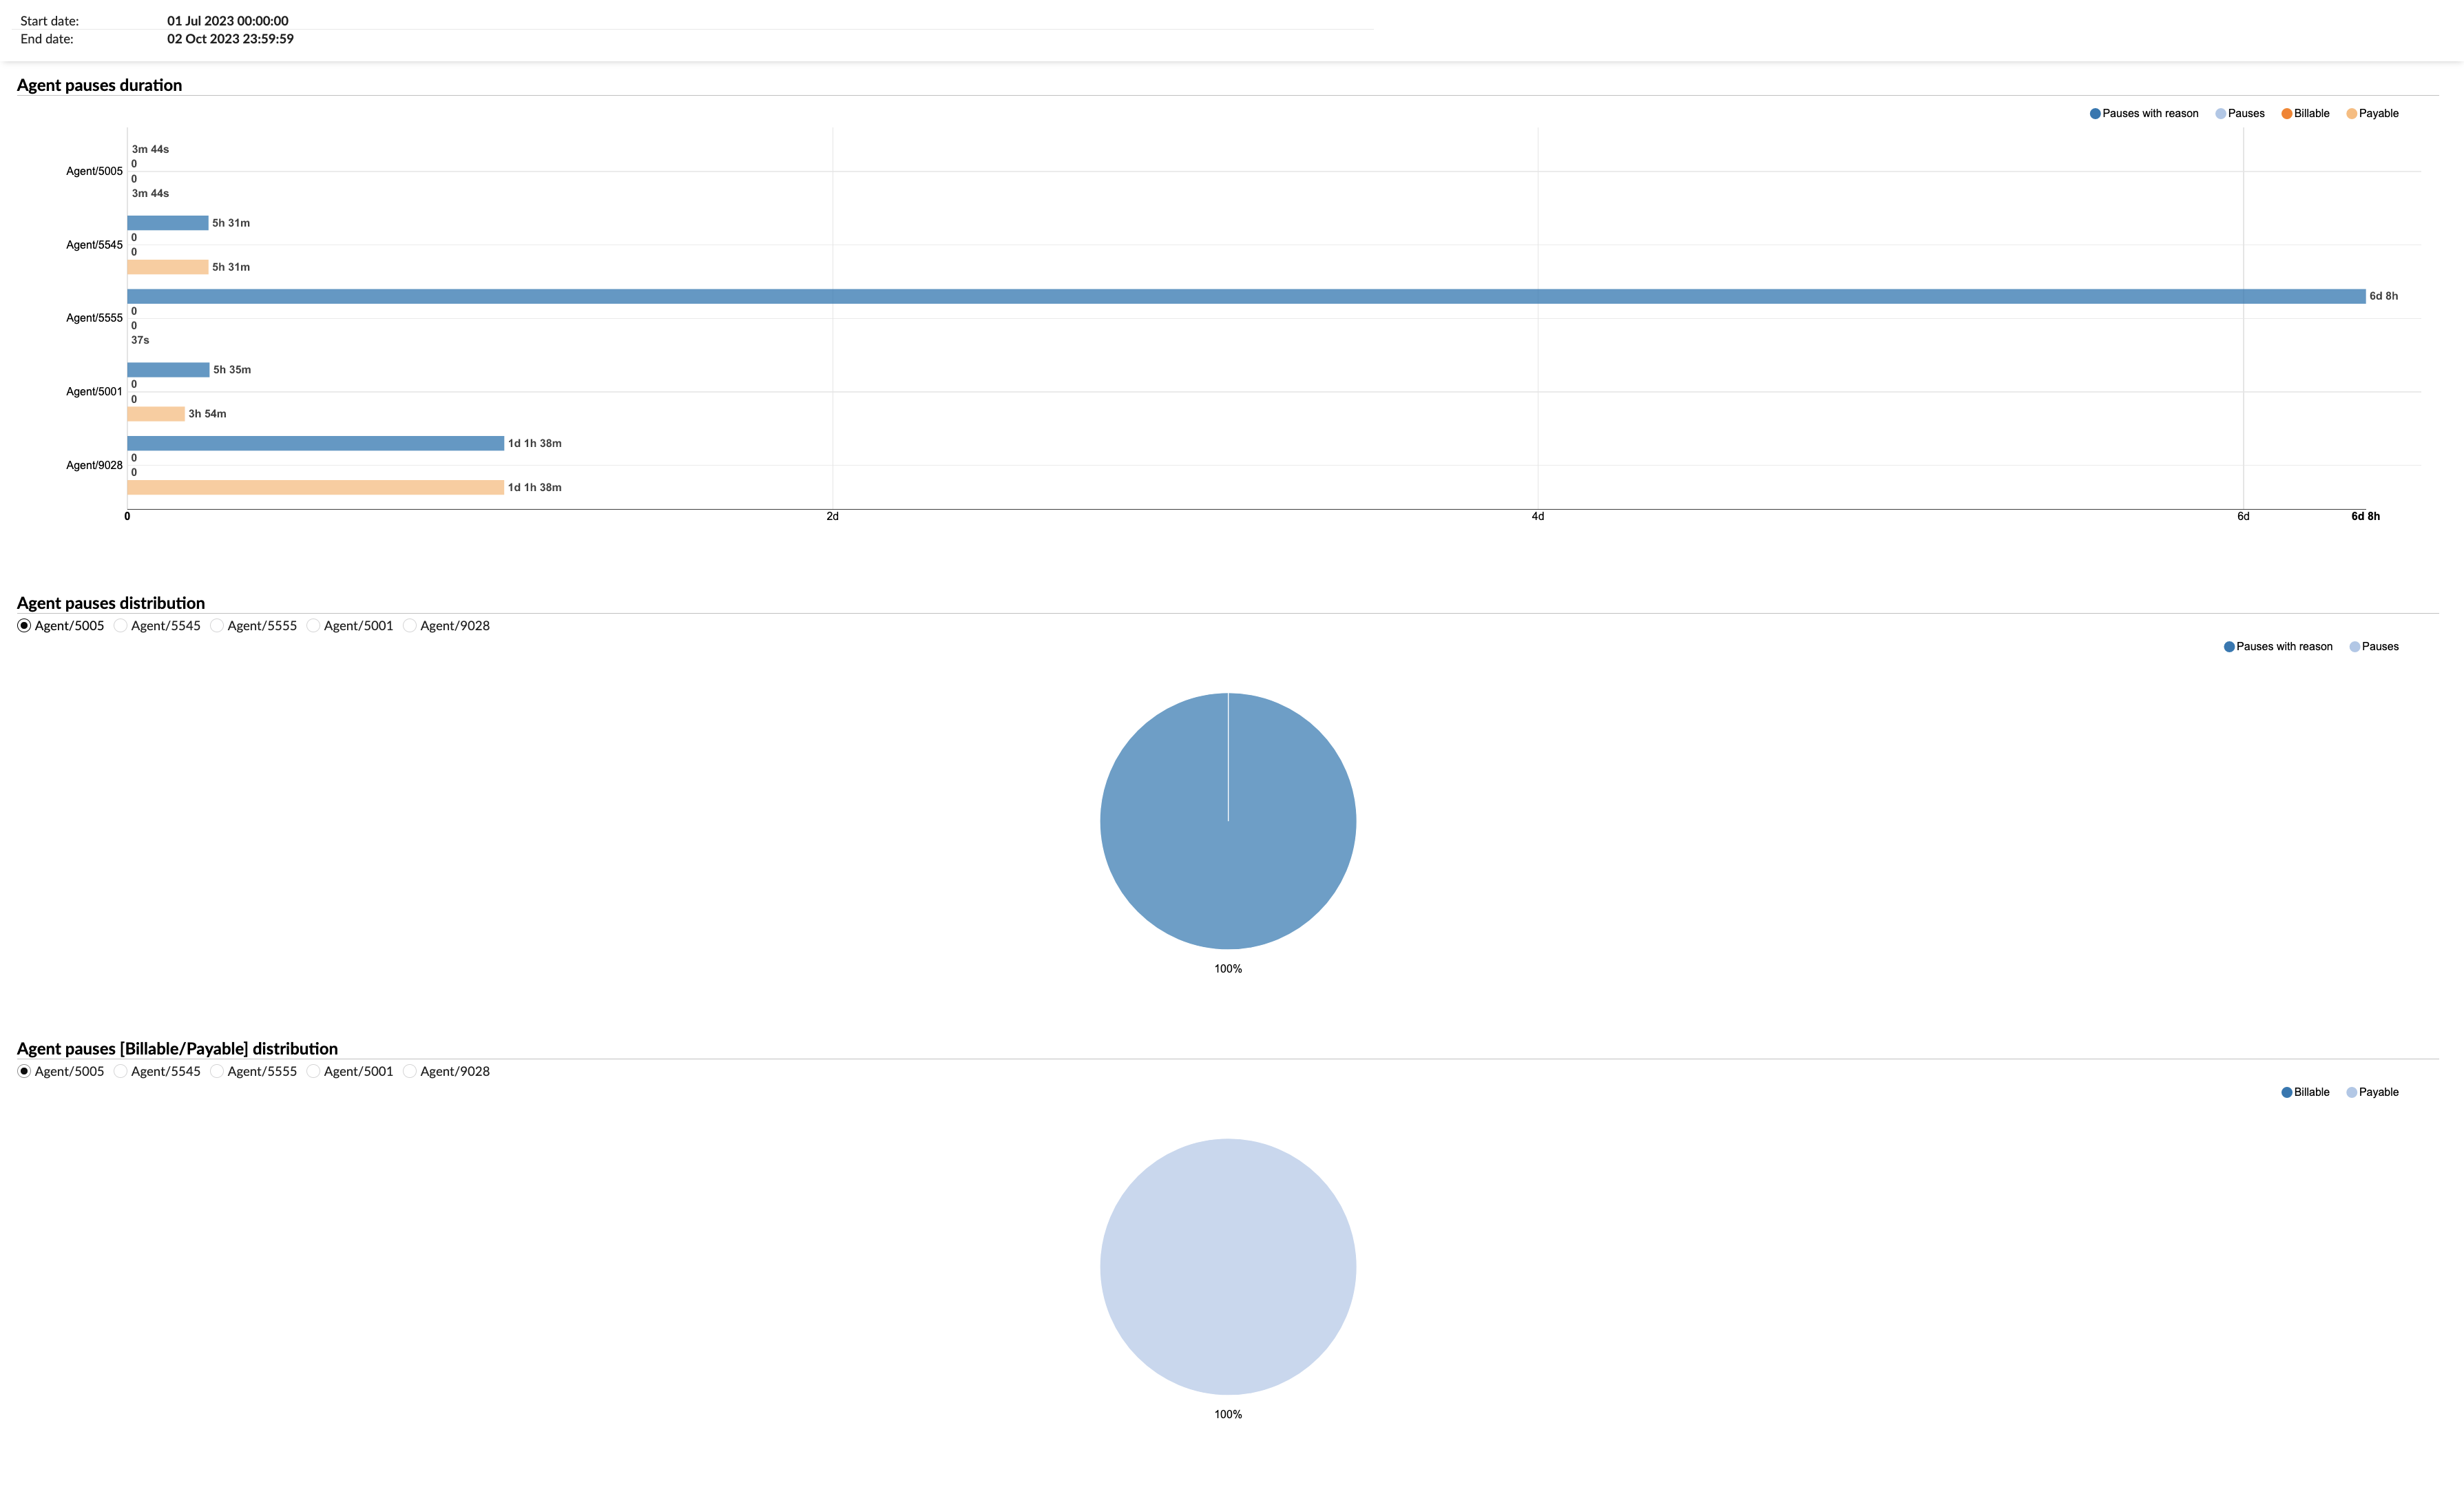
The report is divided into three sections. The first section presents a graph that illustrates the duration of agent breaks. The second section presents a pie chart illustrating the distribution of agent breaks, including the reasons for the breaks. The third table indicates whether the breaks were billable or not.
Agent sessions and pauses
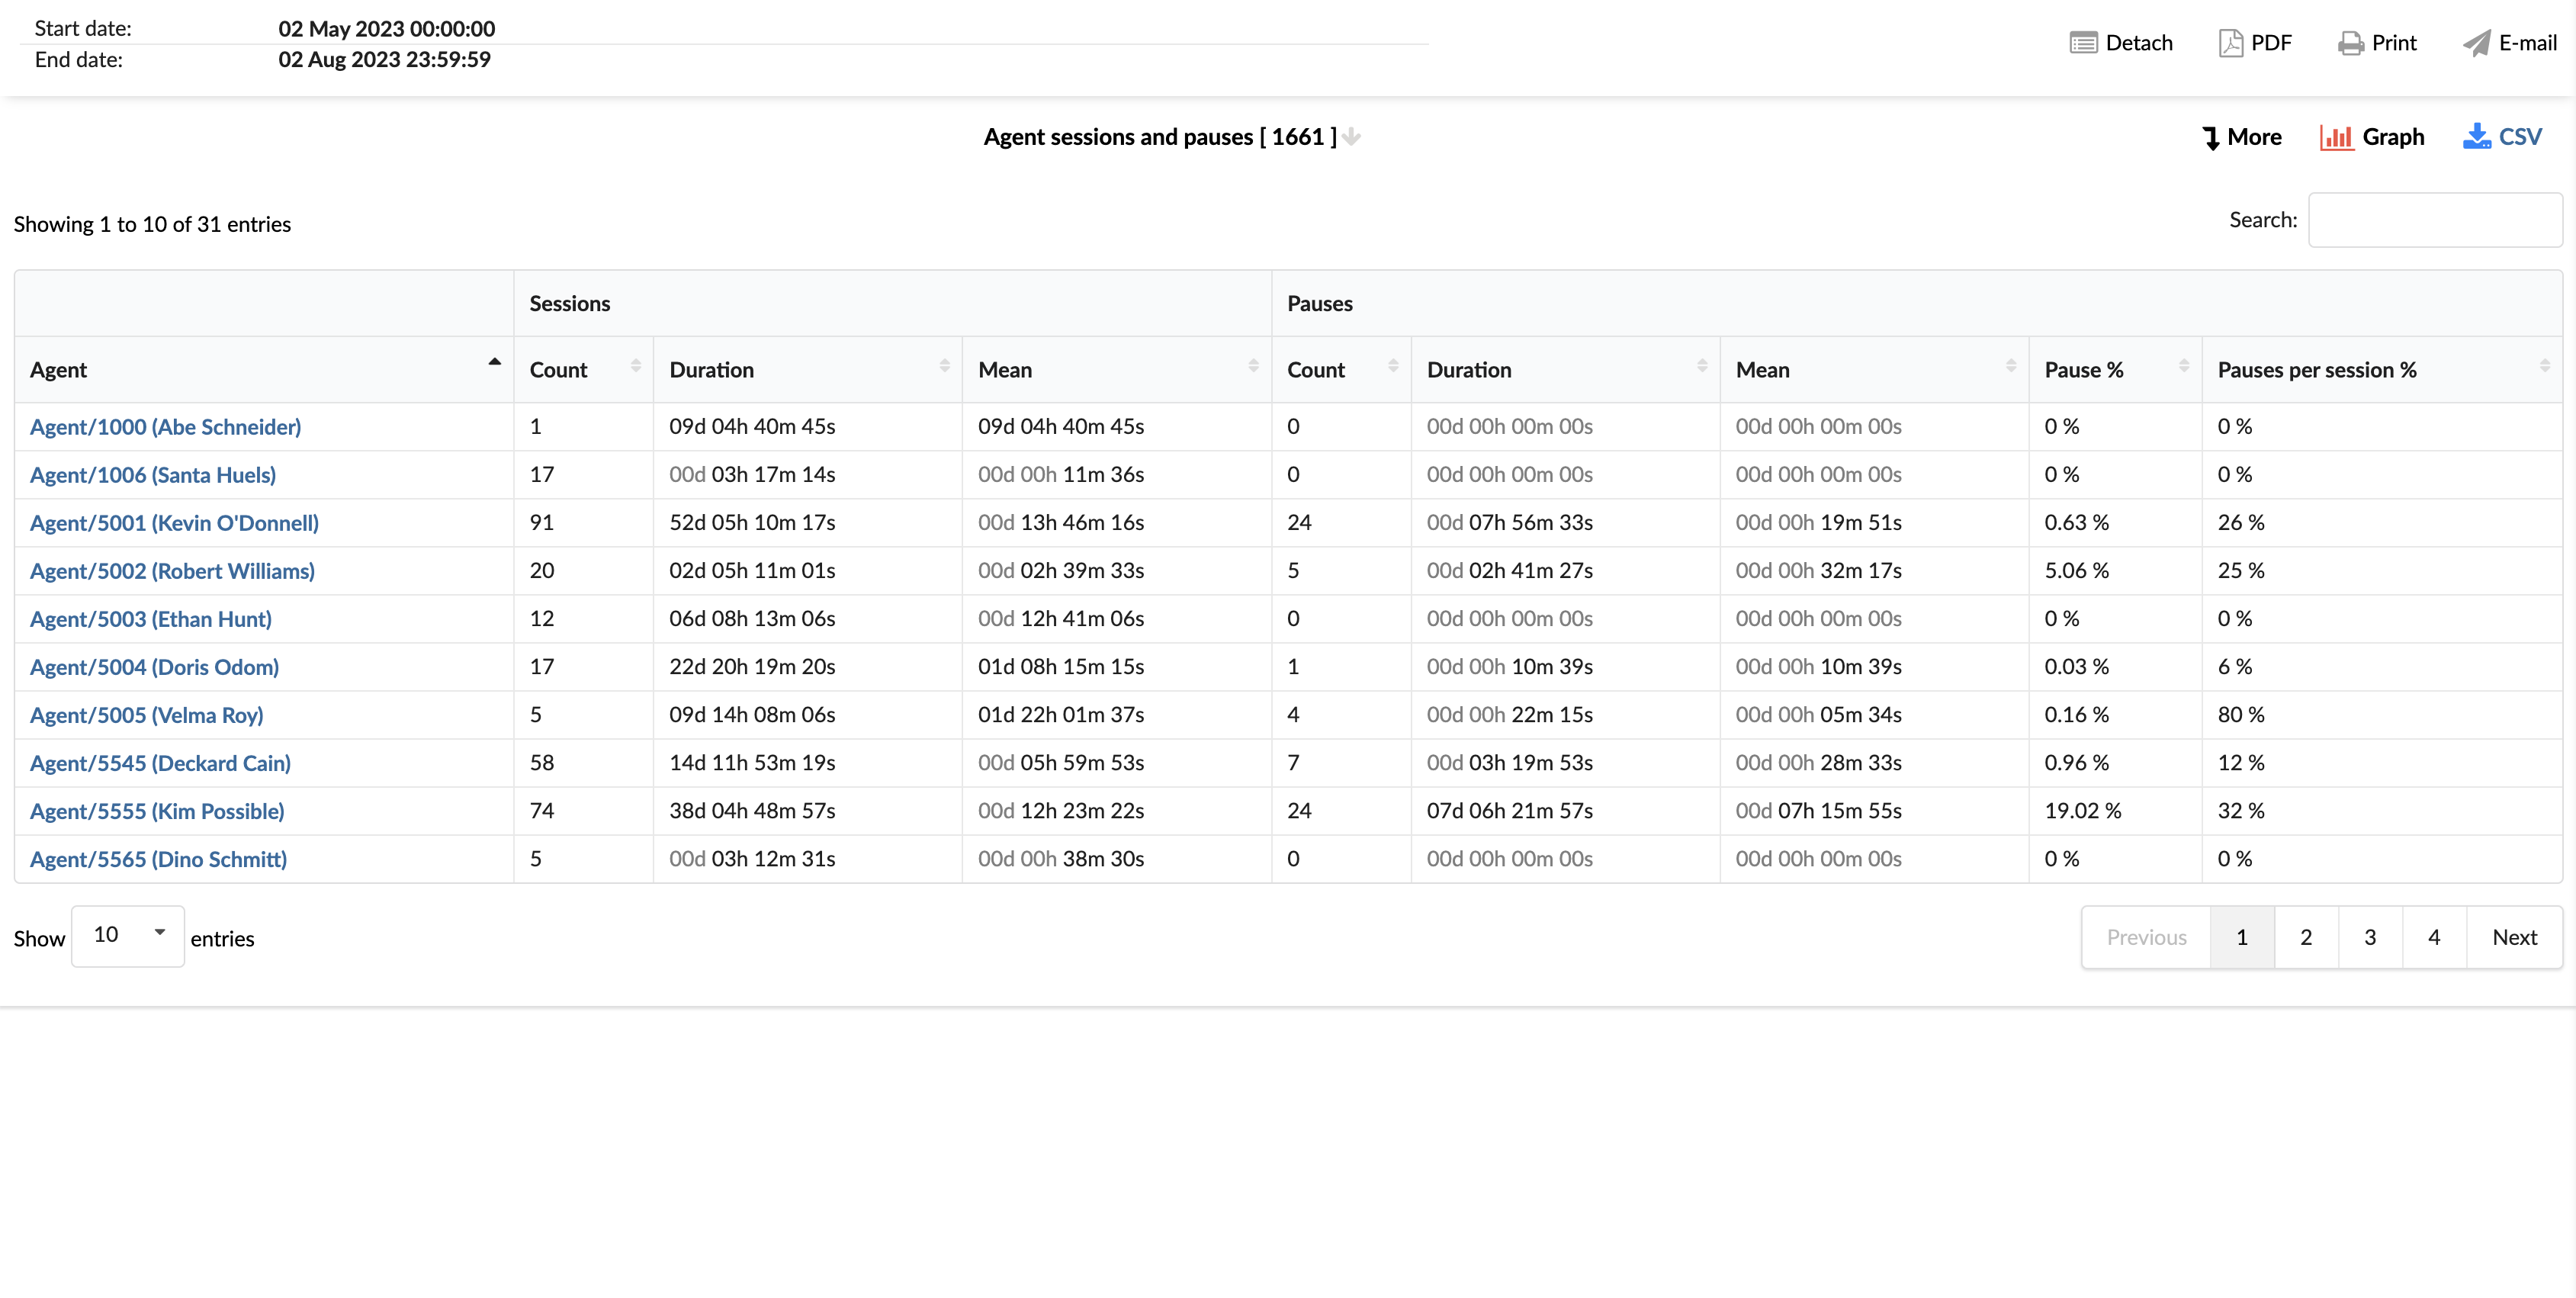
Agent sessions and pauses represent a detailed overview of agents' activity and productivity metrics during a specified period, indicating which agents were active, how many sessions they had and the total duration they spent in those sessions. The report also provides information about the interruptions or pauses taken by agents, including the number of pauses, the total time spent on those pauses and the average pause duration. In addition, it offers a comparative analysis of agents' active session time versus their pause time in terms of percentages and average values, thus constituting a valuable tool allowing managers and supervisors to monitor agent efficiency, understand work patterns and identify areas for improvement. The report is divided into several columns, each providing specific details about the sessions and pauses.
Agent : This column lists the names of all agents.
Sessions : This column is divided into three sub-columns:
- Number : displays the total number of sessions that each agent had.
- Duration : displays the total duration of all sessions for each agent.
- Average : Represents the average session duration for each agent. For example, if an agent had three sessions lasting 10 minutes, 20 minutes, and 30 minutes respectively, the total duration would be 60 minutes. The “average” would then be calculated as follows: 60 minutes (total duration) divided by 3 (total number of sessions), which equals 20 minutes.
Thus, the “Average” represents the average duration of a session for the agent.
- Pauses : This column is divided into five sub-columns:
Number : displays the total number of breaks taken by each agent during their sessions.
Duration : Displays the total duration of all breaks for each agent.
Average : Represents the average pause duration for each agent.
Pause % : displays the percentage of the total session time that each agent spent on break. The “% break” is calculated by taking the total duration of all breaks and dividing it by the total duration of all sessions (including active time and break time), then multiplying the result by 100 to obtain a percentage. For example, if an agent has a total session duration of 500 minutes and was on break for 50 minutes, the “% break” will be calculated as follows: (50 minutes (total break duration) / 500 minutes (total session duration)) * 100 = 10%. Thus, the “% break” represents the percentage of the total session time that the agent spent on break. Thus, the “% break” represents the percentage of the total session time that the agent spent on break.
Pauses per session % : Represents the average percentage of pauses per session for each agent. The "% of pauses per session" is calculated by dividing the total number of pauses by the total number of sessions, then multiplying the result by 100 to obtain a percentage.
For example, if an agent had 10 sessions and during those sessions took a total of 20 breaks, the « % of breaks per session » would be calculated as follows:
(20 breaks (total number of breaks) / 10 sessions (total number of sessions)) * 100 = 200 %
Thus, the “% of pauses per session” represents the average percentage of pauses per session for the agent.Please note that this calculation assumes that each break is counted as a discrete event, regardless of its duration. If your system counts breaks differently, the calculation may need to be adjusted accordingly.
Using the "Agent sessions and pauses" statistical report, managers can gain insights into each agent's work patterns, identify areas for improvement and implement strategies to improve efficiency and productivity.
Distribution of agent sessions and breaks
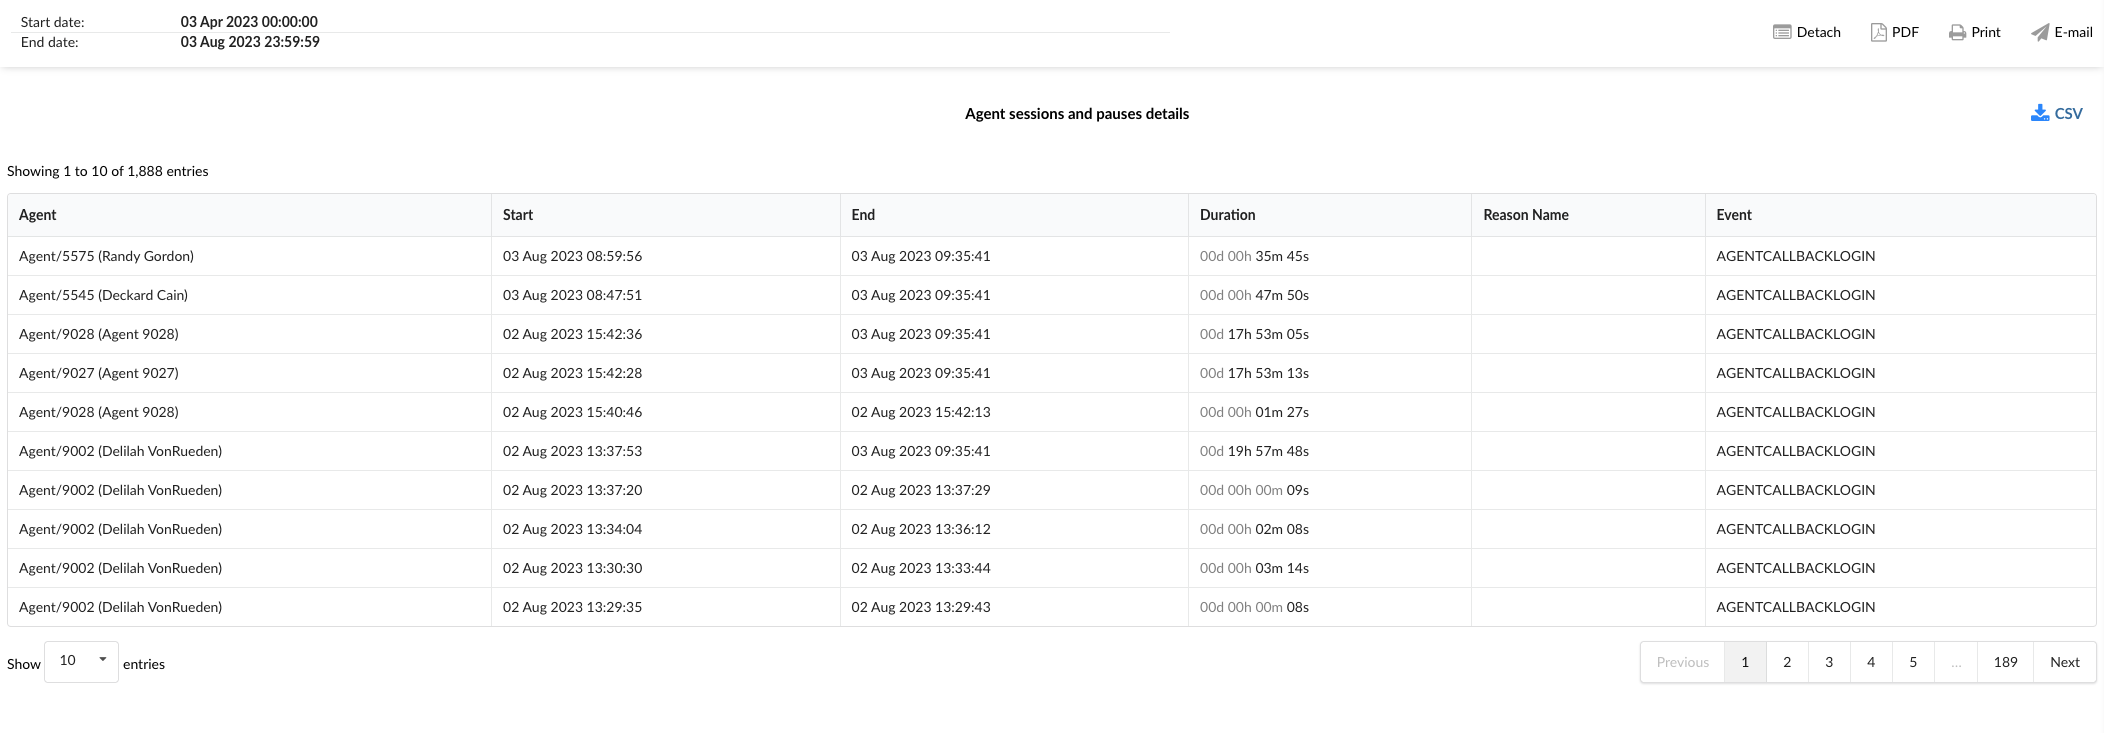
The "Agent sessions and breaks breakdown" statistics table provides detailed information about each session and break taken by agents. The table consists of six columns, each offering specific information about the sessions and breaks.
Agent : This column lists the names of all agents.
Start : This column displays the start time of each session or break.
End : This column indicates the end time of each session or break.
Duration : This column displays the total duration of each session or break. This is calculated as the difference between the end time and the start time.
Reason name : this column indicates the reason for each break, if applicable. This can include reasons such as “break”, “technical issue”, “training”, etc.
Event : This column indicates whether the record corresponds to a session or a pause.
Using the "Agent sessions and pauses breakdown" statistics table, managers can gain a granular understanding of each agent's work patterns, identify trends and implement strategies to improve efficiency and productivity. This can also help identify issues that may cause frequent or long pauses, thus enabling targeted problem resolution.
Chart of agent sessions and pauses
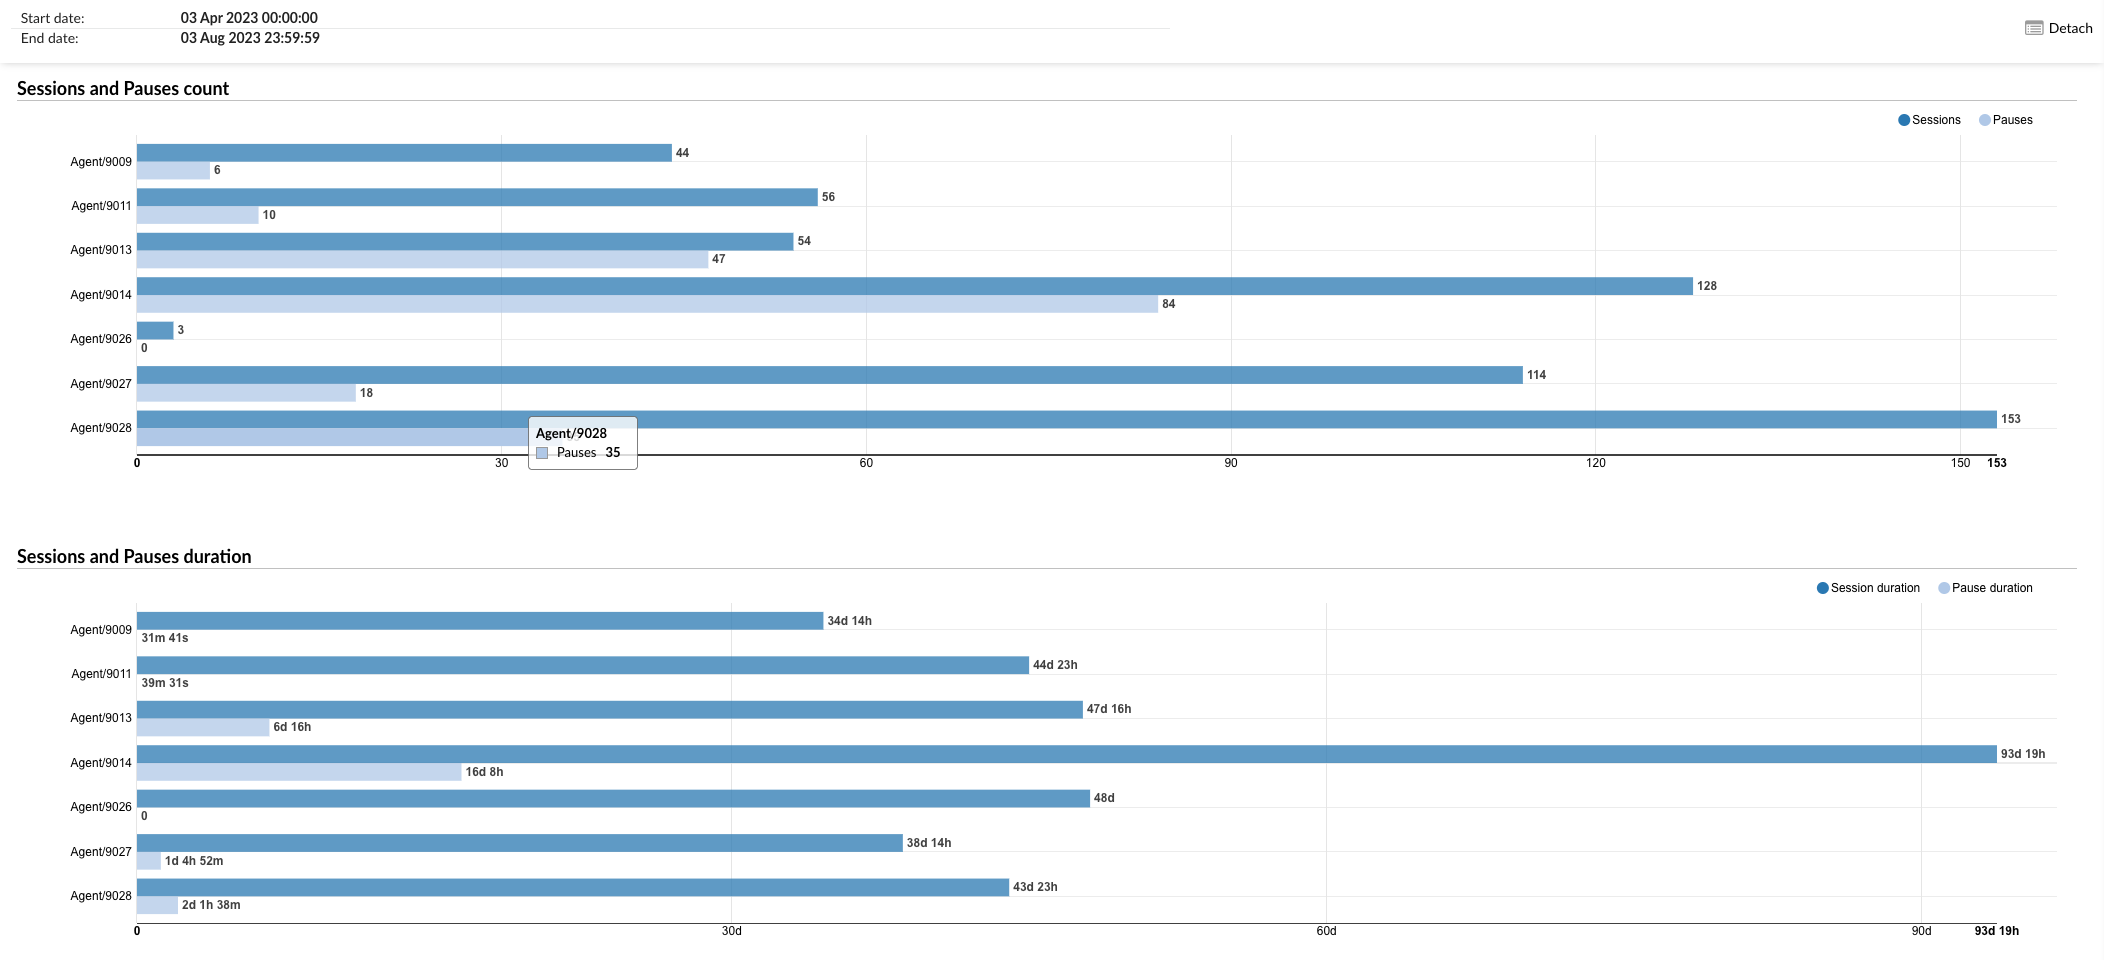
The “Agent sessions and pauses” chart provides a visual representation of the number and duration of sessions and pauses for each agent. The chart is divided into two sections, each providing specific information about the sessions and pauses.
Number of sessions and pauses : this graph displays columns arranged horizontally for each agent, representing the total number of sessions and breaks. Users can select “Sessions” or “Breaks” from the radio buttons to display the corresponding data. Each column corresponds to the total number of the selected event (sessions or breaks) for a specific agent.
Duration of sessions and pauses : this graph also displays columns arranged horizontally for each agent, but it represents the total duration of sessions and breaks. Users can select “Session duration” or “Break duration” from the radio buttons to display the corresponding data. Each column corresponds to the total duration of the selected event (either the session duration or the break duration) for a specific agent.
Using the "Agent sessions and pauses" chart, managers can visually analyze the number and duration of sessions and pauses for each agent, identify trends and implement strategies to improve efficiency and productivity. This can also help identify issues that may cause frequent or long pauses, thus enabling targeted problem resolution.
Conversations by channel
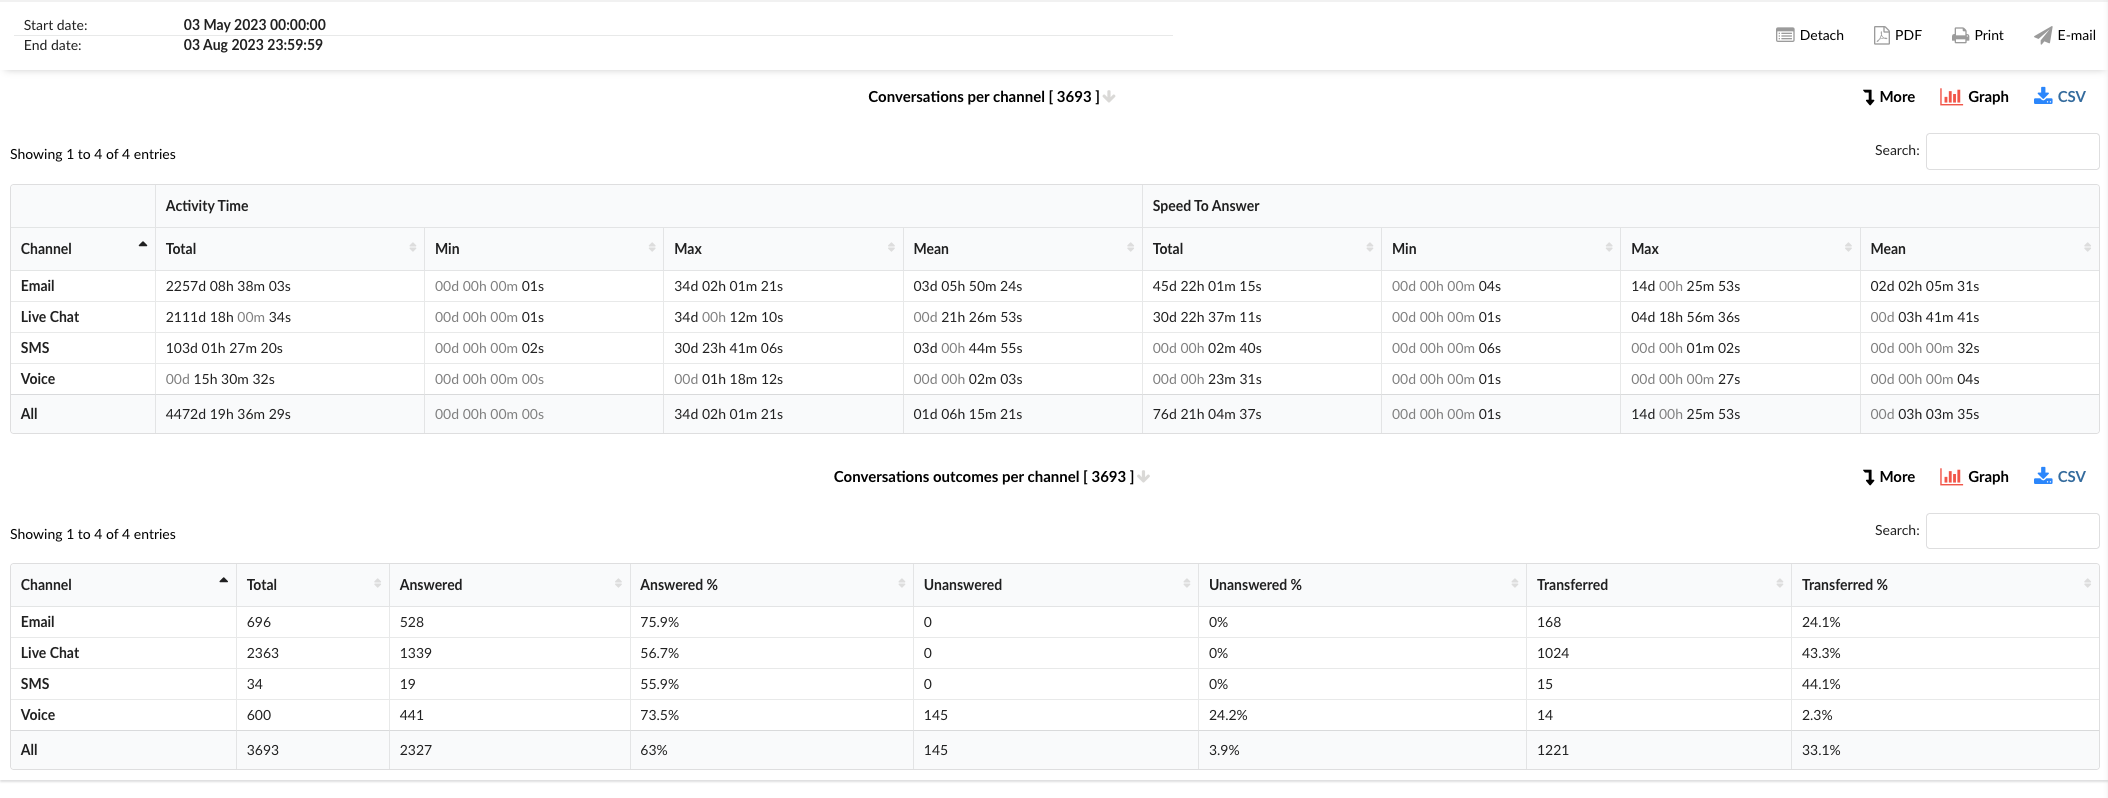
Conversations per channel provide a comprehensive overview of communication interactions across different channels within a specified time frame. This report highlights the total number of conversations, distinguishing those with a response from those without, and offers insight into the speed of responses. The table is divided into several columns, each providing specific details about the conversations.
Channel : this column lists the communication channels, including email, live chat, SMS, voice and an option for All channels combined.
Uptime : This column is divided into four sub-columns:
- Total : displays the total activity time for each channel.
- Min : Displays the shortest activity time recorded for each channel.
- Max : Represents the longest activity time recorded for each channel.
- Average : Indicates the average uptime for each channel.
Answer speed : This column is also divided into four sub-columns:
- Total : Displays the total speed to answer for each channel.
- Min : Displays the shortest answer speed recorded for each channel.
- Max : Represents the longest response speed recorded for each channel.
- Average : Indicates the average speed of answer for each channel.
Results of conversations by channel
The "Conversation outcomes by channel" statistics table provides detailed information about the outcomes of conversations handled across different communication channels. The table consists of several columns, each offering specific information about the conversation outcomes.
Channel : this column lists the communication channels, including email, live chat, SMS, voice and an option for All channels combined.
Total : This column displays the total number of conversations for each channel.
Answered : this column displays the number of conversations that were answered in each channel.
% answered : this column represents the percentage of conversations that were answered in each channel.
No answer : this column displays the number of conversations that remained unanswered in each channel.
% unanswered : This column represents the percentage of conversations that went unanswered in each channel.
Transferred : this column displays the number of conversations that were transferred to another agent or another queue in each channel.
% transferred : This column represents the percentage of conversations that were transferred in each channel.
Using the "Conversations by channel" and "Conversation outcomes by channel" statistics tables, managers can gain an overview of performance across different channels, identify areas for improvement and implement strategies to improve efficiency and customer service.
Distribution of conversations by channel
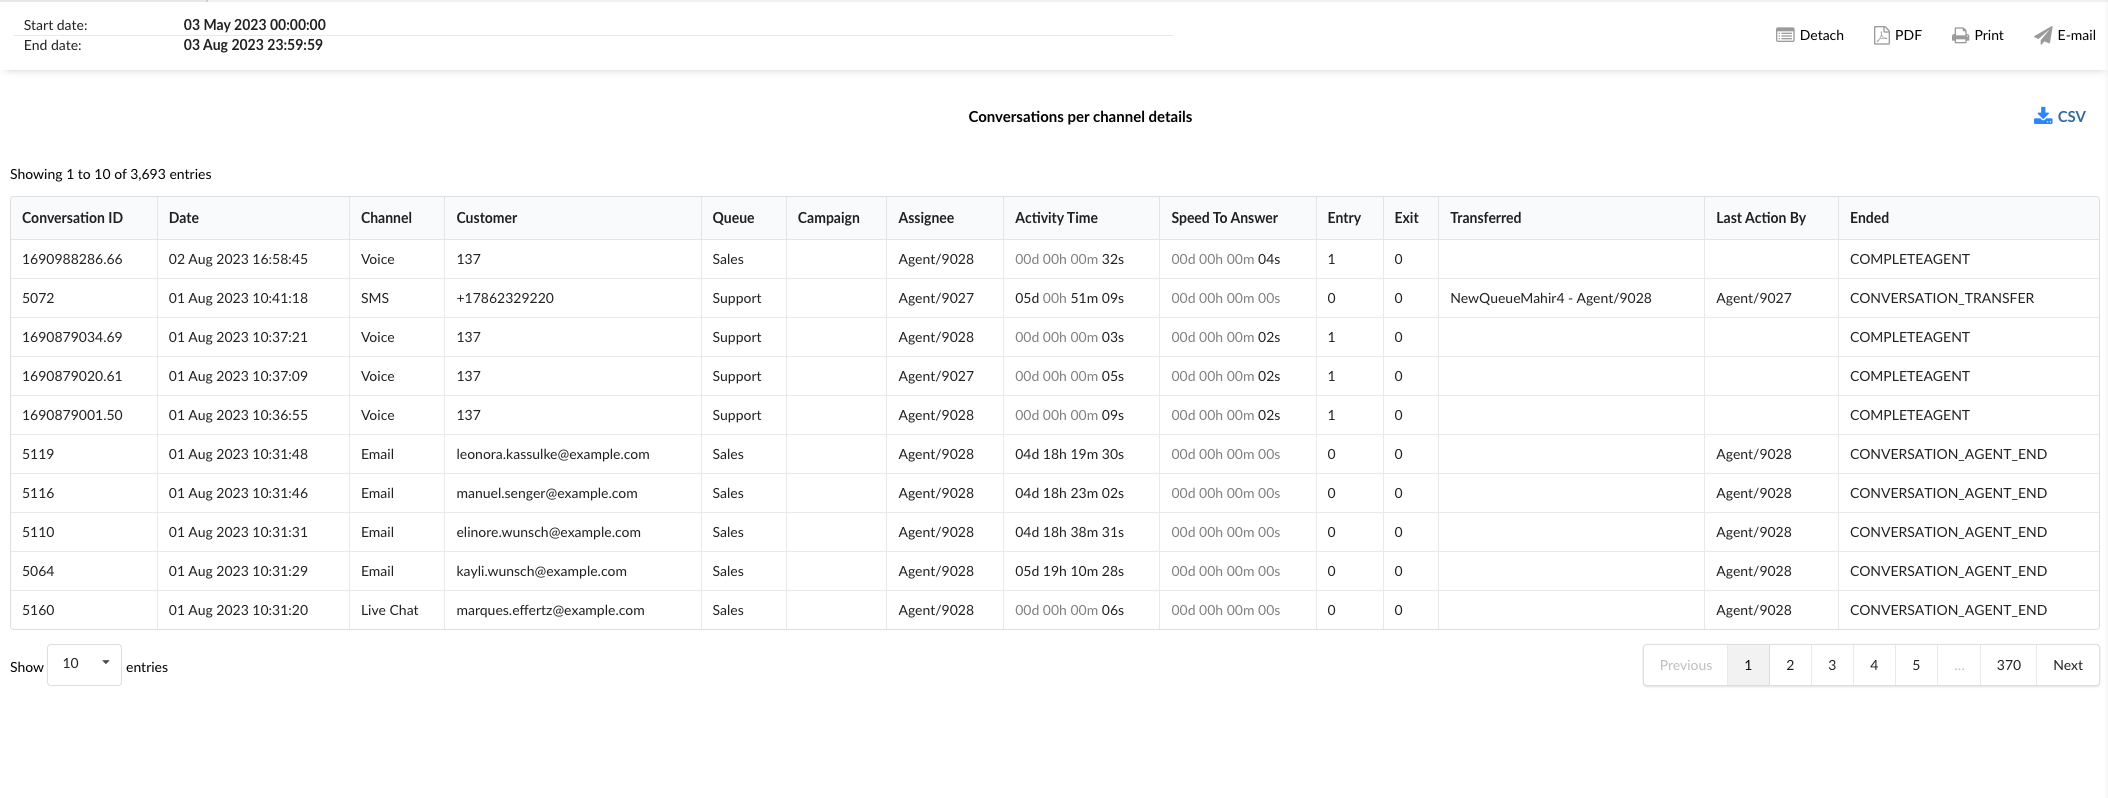
The "Conversation breakdown by channel" statistics table provides detailed information about each conversation handled across different communication channels. The table consists of fourteen columns, each offering specific information about the conversations.
Conversation ID : this column lists the unique identifiers of each conversation.
Date : This column indicates the date on which each conversation took place.
Channel : This column indicates the communication channel used for each conversation, such as chat, email, or messaging.
Client : This column lists the customers involved in each conversation.
Queue : This column displays the queue in which each conversation was handled.
Campaign : This column indicates the campaign associated with each conversation.
Assignee : This column lists the agent assigned to each conversation.
Uptime : this column displays the total time that the agent spent on each conversation.
Answer speed : This column represents the time taken by the agent to answer each conversation.
Input : This column indicates the time at which each conversation entered the queue.
Output : this column indicates the time at which each conversation left the queue.
Transferred : This column indicates whether each conversation was transferred to another agent or another queue.
Last action by : this column indicates who performed the last action in the conversation, whether it was the agent or the customer.
Completed : This column indicates how each conversation ended.
Using the "Conversation breakdown by channel" statistics table, managers can gain a granular understanding of each conversation, identify patterns and implement strategies to improve agent performance and customer service.
Results of conversations by channel, breakdown
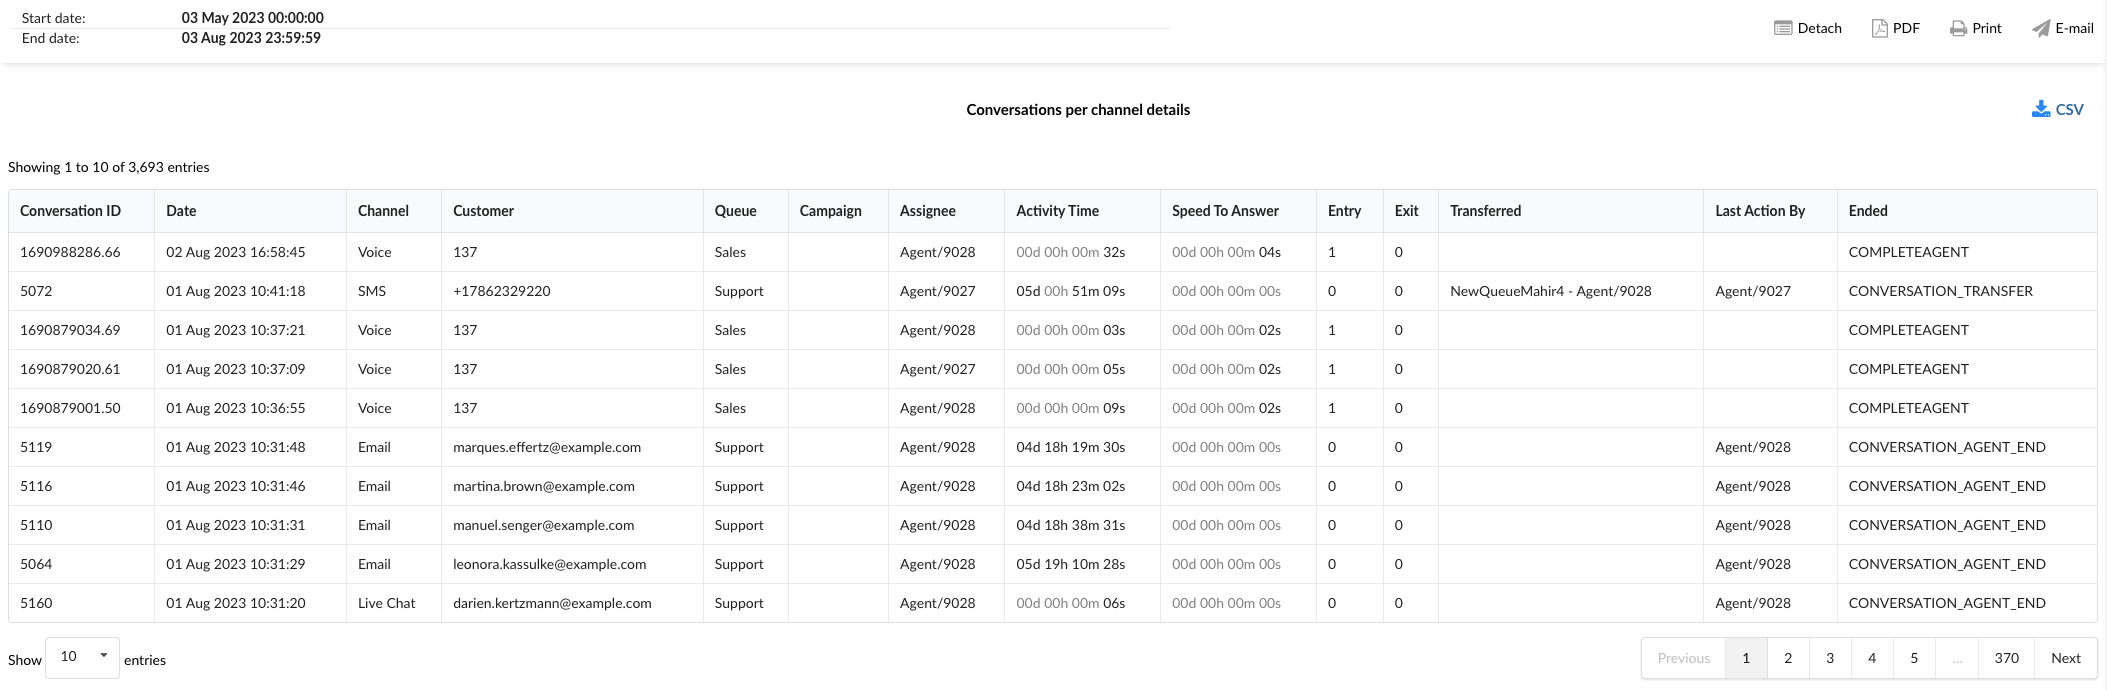
The "Conversation outcomes by channel breakdown" statistics table provides detailed information about each conversation handled across different communication channels, along with their outcomes. The table consists of fourteen columns, each offering specific information about the conversations and their outcomes.
Conversation ID : this column lists the unique identifiers of each conversation.
Date : This column indicates the date on which each conversation took place.
Channel : This column indicates the communication channel used for each conversation, such as chat, email, or messaging.
Client : This column lists the customers involved in each conversation.
Queue : This column displays the queue in which each conversation was handled.
Campaign : This column indicates the campaign associated with each conversation.
Assignee : This column lists the agent assigned to each conversation.
Uptime : this column displays the total time that the agent spent on each conversation.
Answer speed : This column represents the time taken by the agent to answer each conversation.
Input : This column indicates the time at which each conversation entered the queue.
Output : this column indicates the time at which each conversation left the queue.
Transferred : This column indicates whether each conversation was transferred to another agent or another queue.
Last action by : this column indicates who performed the last action in the conversation, whether it was the agent or the customer.
Completed : this column indicates how each conversation ended, thereby providing an overview of the conversation outcomes.
Using the "Conversation outcomes by channel breakdown" statistics table, managers can gain a granular understanding of each conversation, identify patterns in conversation outcomes and implement strategies to improve agent performance and customer service.
Chart of conversations by channel
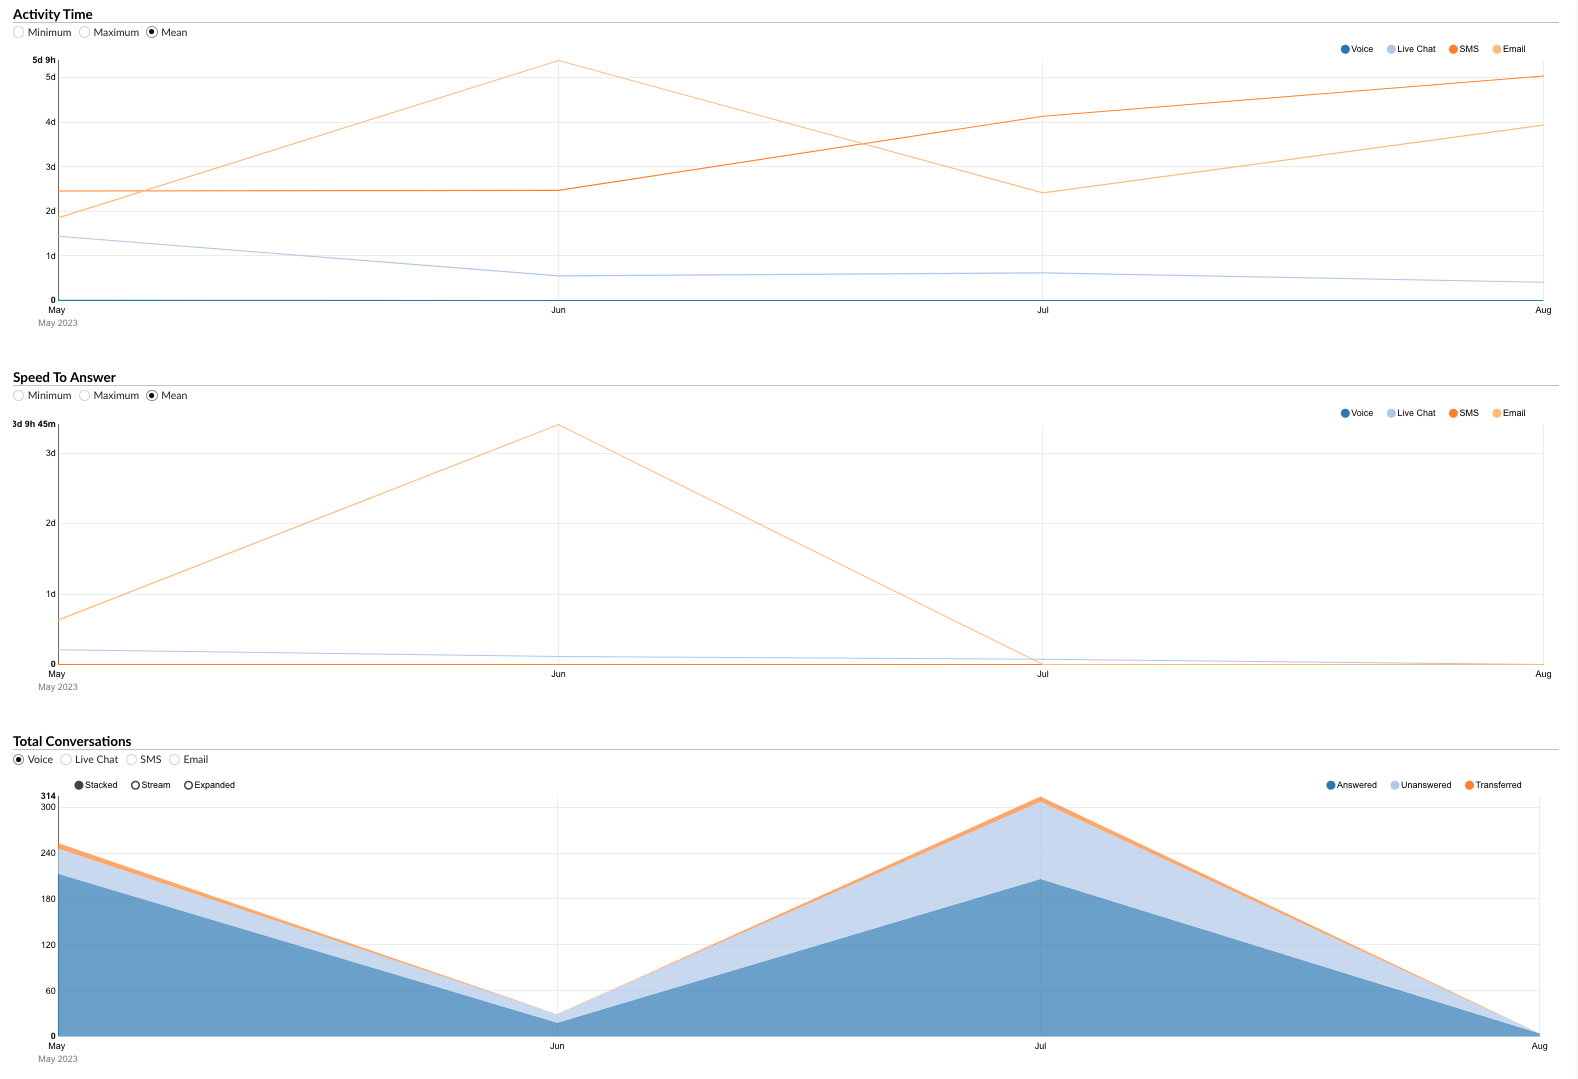
The "Chart of conversations by channel" provides a visual representation of various aspects of conversations handled across different communication channels. The chart is divided into three sections, each focusing on a specific aspect of the conversations.
Uptime
This section allows users to monitor the durations of conversations for each channel over a specific period.
- Radio buttons (left) : users can choose between “Minimum”, “Maximum”, and “Average” to display the corresponding data for the activity duration.
- Radio buttons (right) : users can filter the data by channel, selecting between “Voice”, “Live Chat”, “SMS”, and “Email”.
Using this section, managers can analyze trends in conversation duration and identify areas for improvement.
Answer speed
This section gives an overview of the speed at which agents respond to conversations across different channels.
- Radio buttons (left) : users can choose between “Minimum”, “Maximum”, and “Average” to display the corresponding data for the response speed.
- Radio buttons (right) : users can filter the data by channel, selecting between “Email”, “Voice”, “Live Chat”, and “SMS”.
This section helps to understand how quickly agents respond to customer requests and can guide efforts to reduce response times.
Total conversations
This section allows users to monitor the total number of conversations for each channel over a specific period.
- Radio buttons (left) : users can filter the data by channel, selecting between “Email”, “Voice”, “Live Chat”, and “SMS”.
- Radio buttons (right) : users can view data for “Answered”, “Unanswered”, and “Transferred” conversations.
By hovering over the peaks of the chart, users can see detailed data for each period.
Using the "Total conversations" section, managers can gain an overview of the volume and outcomes of conversations, thus contributing to resource allocation and performance improvement.
The "Chart of conversations by channel" is a powerful tool for visually analyzing various aspects of conversations, enabling managers to make informed decisions and implement strategies to improve customer service and efficiency.
Chart of conversation outcomes by channel
The "Chart of conversation outcomes by channel" provides a visual representation of the outcomes of conversations handled across different communication channels. The chart is divided into three sections, each providing specific information about the conversation outcomes.
Total results
This section displays columns arranged horizontally for each channel, representing the total results of "Answered", "Unanswered", and "Transferred" conversations. By examining these columns, users can get a quick overview of the distribution of conversation results across different channels.
Pie charts
The chart is divided into three sections represented by pie charts:
Replies by channel : this pie chart provides a visual breakdown of answered conversations across different channels. Users can view the data for all channels combined or select an individual channel to view its specific data.
No answer per channel : this pie chart displays the distribution of unanswered conversations across different channels. Users can view the data for all channels combined or select an individual channel to view its specific data.
Transferred by channel : this pie chart shows the distribution of transferred conversations across different channels. Users can view the data for all channels combined or select an individual channel to view its specific data.
These pie charts allow users to easily compare and analyze the distribution of conversation outcomes across different channels.
Summary by channel
This section provides a pie chart that summarizes the conversation results for each channel. Users can display data from all channels combined or select an individual channel to display its specific data. The pie chart provides a complete view of the distribution of conversation results (answered, unanswered, and transferred) for the selected channel(s).
Using the "Conversation outcomes chart by channel", managers can visually analyze conversation outcomes across different channels, identify trends and implement strategies to improve customer service and efficiency.
Queue statistics
The Queue Statistics section provides information about the distribution and handling of conversations across different channels and queues. Use this data to optimize queue management and ensure that customers receive timely assistance.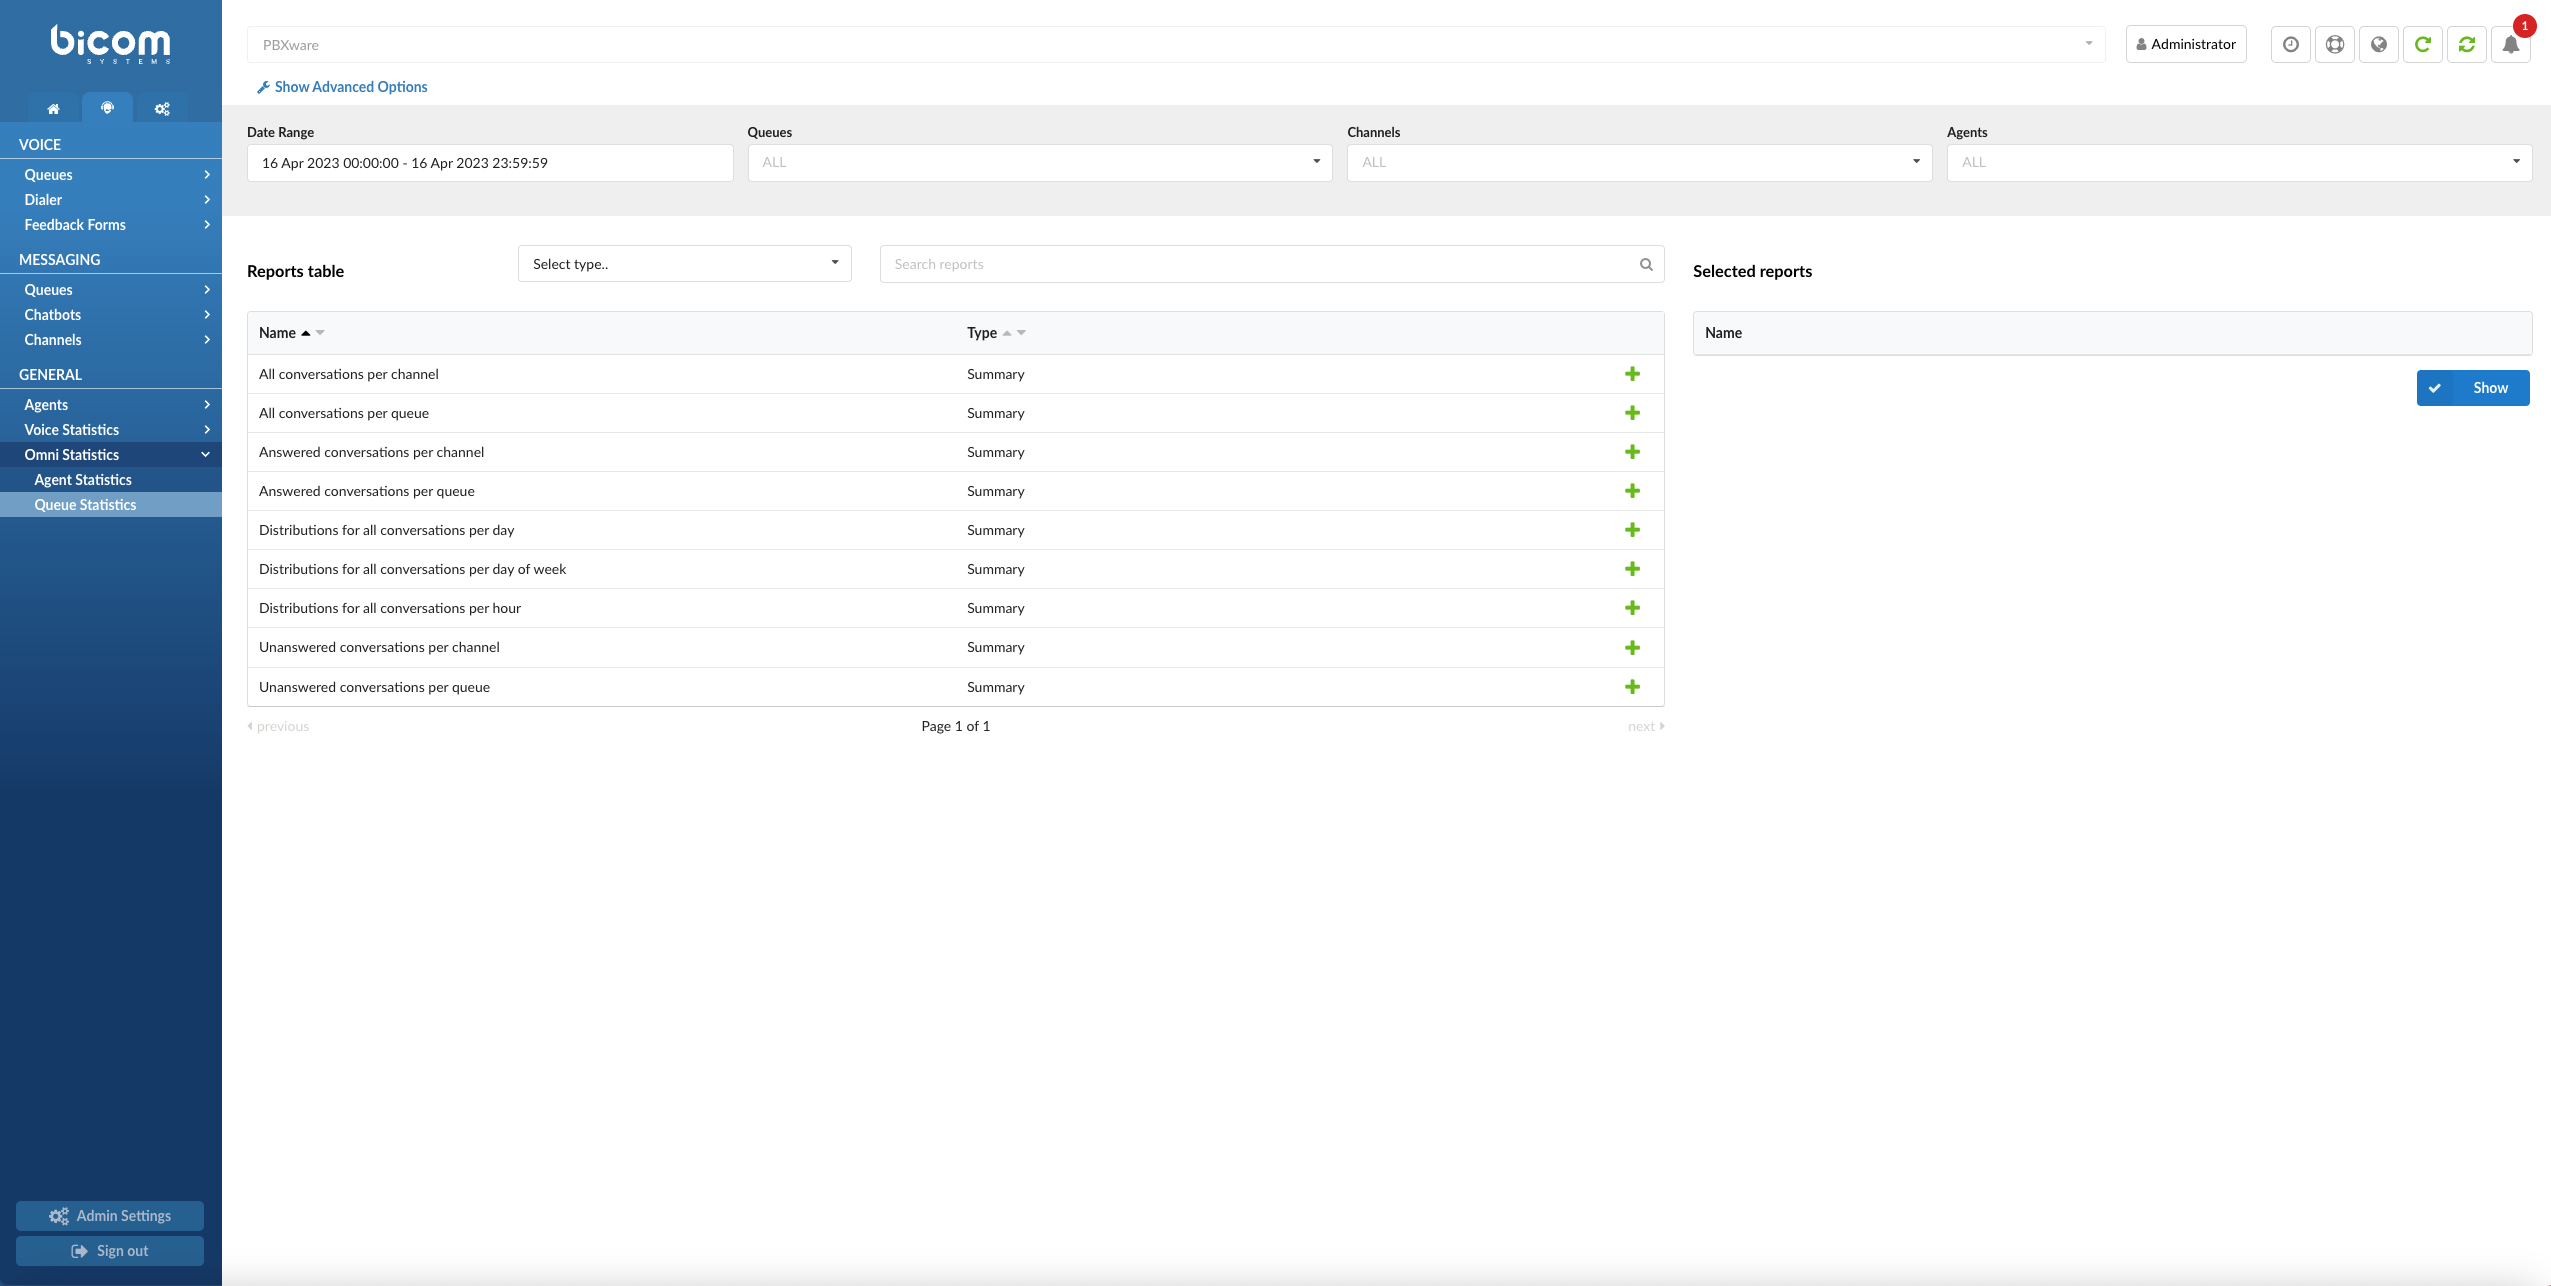
The Queue Statistics page offers a comprehensive and customizable view of various queue-related metrics. With multiple filters, adjustable time formats, and reporting capabilities, this page allows you to effectively analyze and optimize queue performance. Here is an overview of the features and options available on the Queue Statistics home page.
Filters
This page offers several filters to help you refine the displayed data:
- By date: select a specific date range to display data for that period. This allows you to analyze trends over time or focus on a particular period.
- By queue: filter the data by specific queue to analyze its performance and the distribution of conversations.
- By channel: choose a communication channel (for example, voice, live chat, SMS, email) to display data only for that channel, which helps you understand channel-specific queue performance.
- By agent: filter the data based on specific agents. This can help you assess individual agents' contributions to queue management.
- Time format adjustment: you can adjust the time format displayed on the page according to your preferences or to match your organization's standard time format.
Report type selection
Currently, the landing page supports queue report generation. Choose the "Queue" report type to generate and display metrics related to queue performance and conversation distribution.
Search for reports
The search feature allows you to quickly find specific reports based on keywords or phrases. Simply enter your search term and the system will display the relevant reports in the results.
Adding reports to the display list
To create a custom report, you can add specific reports to your generation list by clicking the green plus button next to each report. This allows you to select only the metrics that interest you, thus creating a targeted and personalized report.
Once you have added the desired reports to your list, click the “Display” button to create a report based on the selected metrics. The generated report can then be viewed, printed, or exported for further analysis.
With its versatile filters, customization options, and reporting capabilities, the Queue Statistics home page offers a powerful tool for analyzing and optimizing your organization’s queue management processes.
All conversations by channel
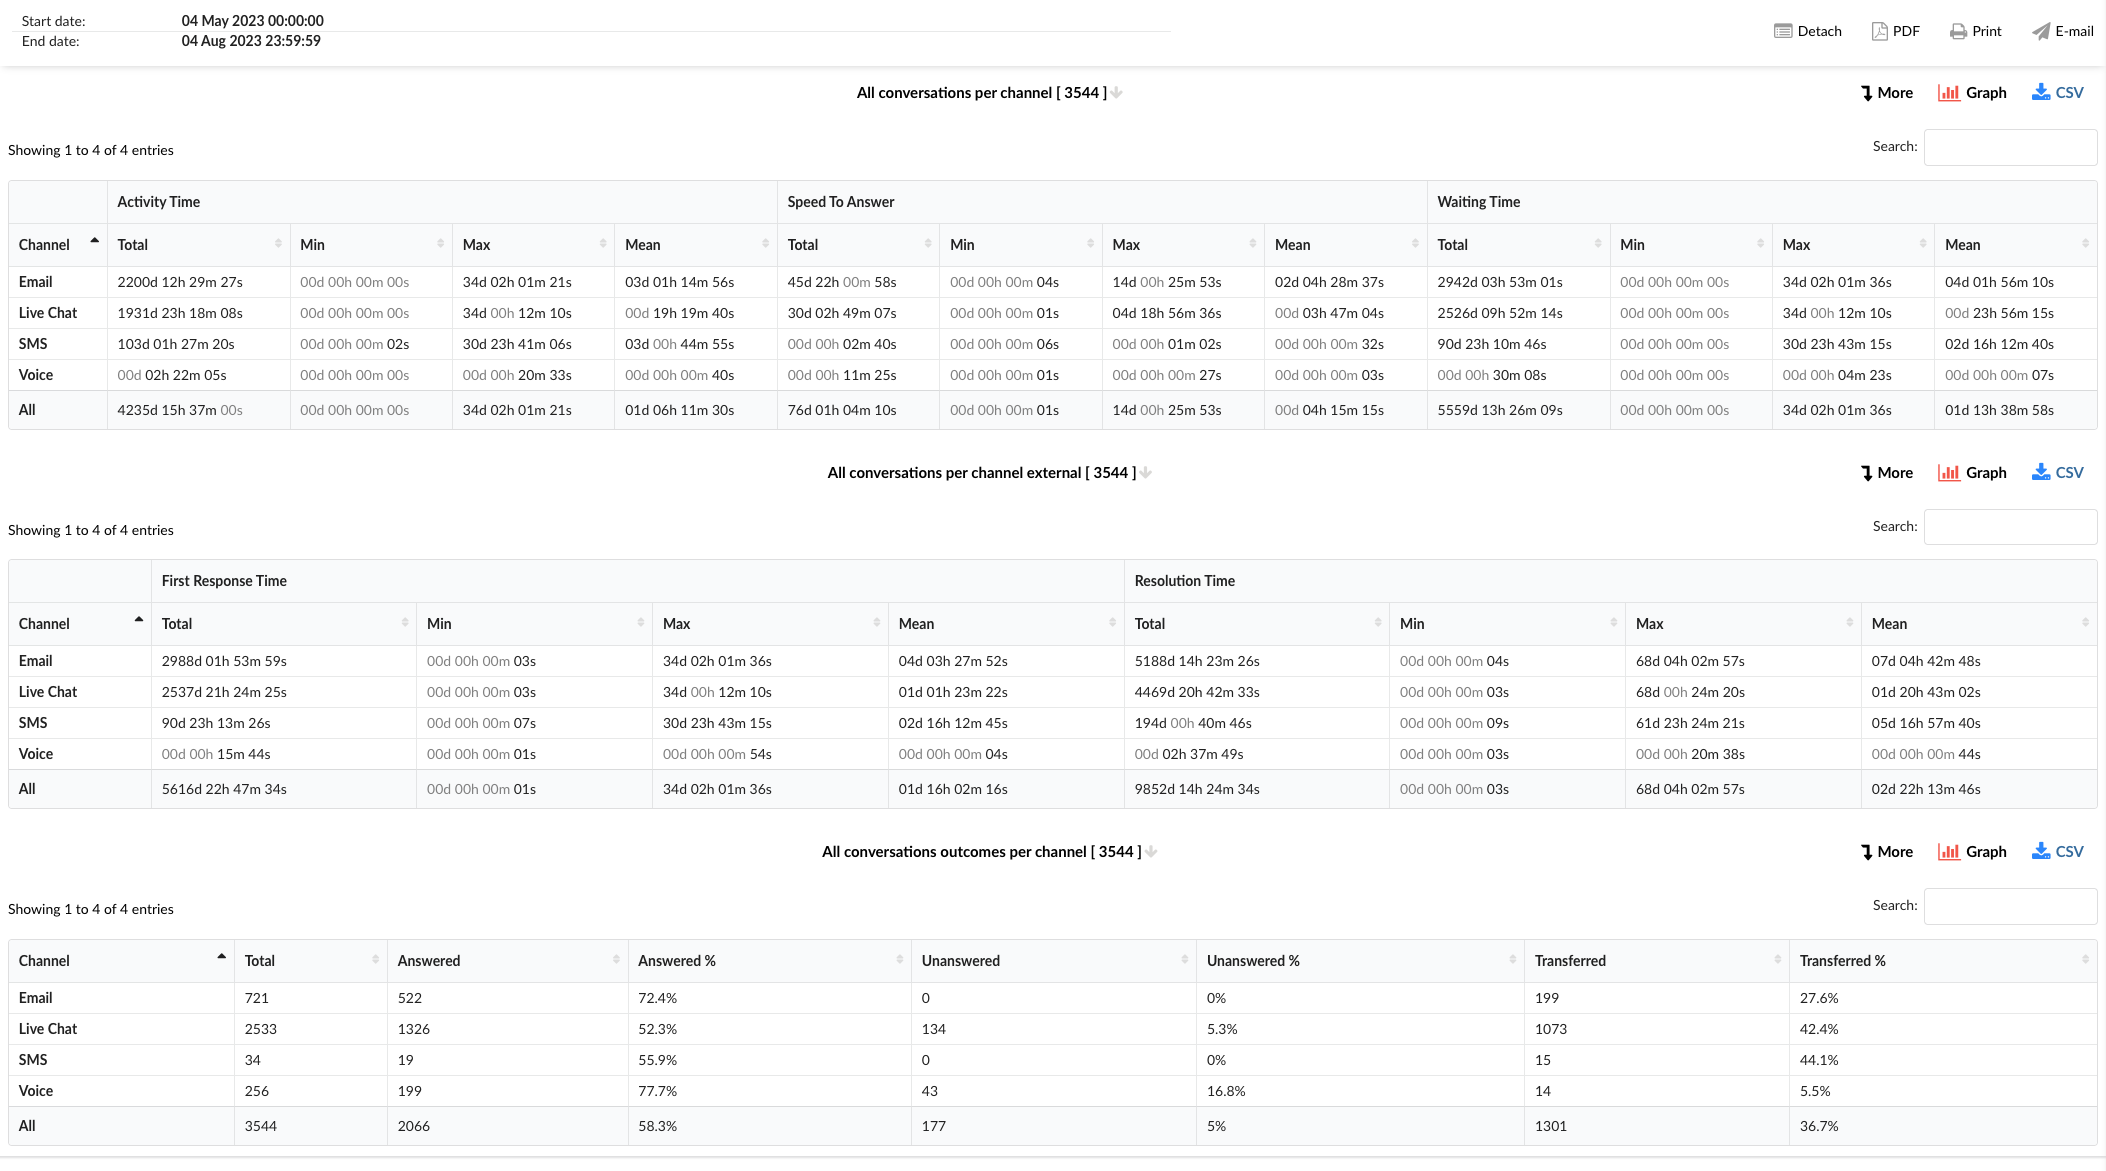
The "All conversations by channel" report provides a comprehensive overview of customer interactions across different communication channels. This report aggregates key indicators to measure the efficiency and effectiveness of communication. Users can gain insight into various key parameters such as active time, response speed, wait time, first response time, and resolution time. In addition, it details the total number of conversations, the percentage of answered, unanswered, and transferred responses.
The “All conversations by channel” statistics are divided into three tables, each providing specific information about the conversations handled across different communication channels.
All conversations by channel
This table provides a comprehensive overview of all conversations handled across different channels.
Channel : this column lists the communication channels, including email, live chat, SMS, voice and an option for All channels combined.
Uptime : This column is divided into four sub-columns:
- Total : displays the total activity time for each channel.
- Min : Displays the shortest activity time recorded for each channel.
- Max : Represents the longest activity time recorded for each channel.
- Average : Indicates the average uptime for each channel.
Answer speed : This column is also divided into four sub-columns:
- Total : Displays the total speed to answer for each channel.
- Min : Displays the shortest answer speed recorded for each channel.
- Max : Represents the longest response speed recorded for each channel.
- Average : Indicates the average speed of answer for each channel.
Wait time : This column is divided into four sub-columns:
- Total : Displays the total waiting time for each channel.
- Min : Displays the shortest waiting time recorded for each channel.
- Max : Represents the longest wait time recorded for each channel.
- Average : Indicates the average waiting time for each channel.
All conversations by external channel
This table gives an overview of the first response time and resolution time of conversations across different channels.
Channel : This column lists the communication channels.
First response time : This column is divided into four sub-columns:
- Total : displays the total first response time for each channel.
- Min : Displays the shortest first response time recorded for each channel.
- Max : Represents the longest first response time recorded for each channel.
- Average : Indicates the average first response time for each channel.
Resolution time : This column is divided into four sub-columns:
- Total : Displays the total resolution time for each channel.
- Min : Displays the shortest resolution time recorded for each channel.
- Max : Represents the longest resolution time recorded for each channel.
- Average : Indicates the average resolution time for each channel.
All conversation results by channel
This table provides detailed information on the outcomes of conversations handled across different communication channels.
Channel : This column lists the communication channels.
Total : This column displays the total number of conversations for each channel.
Answered : this column displays the number of conversations that were answered in each channel.
% answered : this column represents the percentage of conversations that were answered in each channel.
No answer : this column displays the number of conversations that remained unanswered in each channel.
% unanswered : This column represents the percentage of conversations that went unanswered in each channel.
Transferred : this column displays the number of conversations that were transferred to another agent or another queue in each channel.
% transferred : This column represents the percentage of conversations that were transferred in each channel.
Using the "All conversations by channel" statistics tables, managers can gain an overview of performance across different channels, identify areas for improvement and implement strategies to improve efficiency and customer service.
Distribution of all conversations by channel
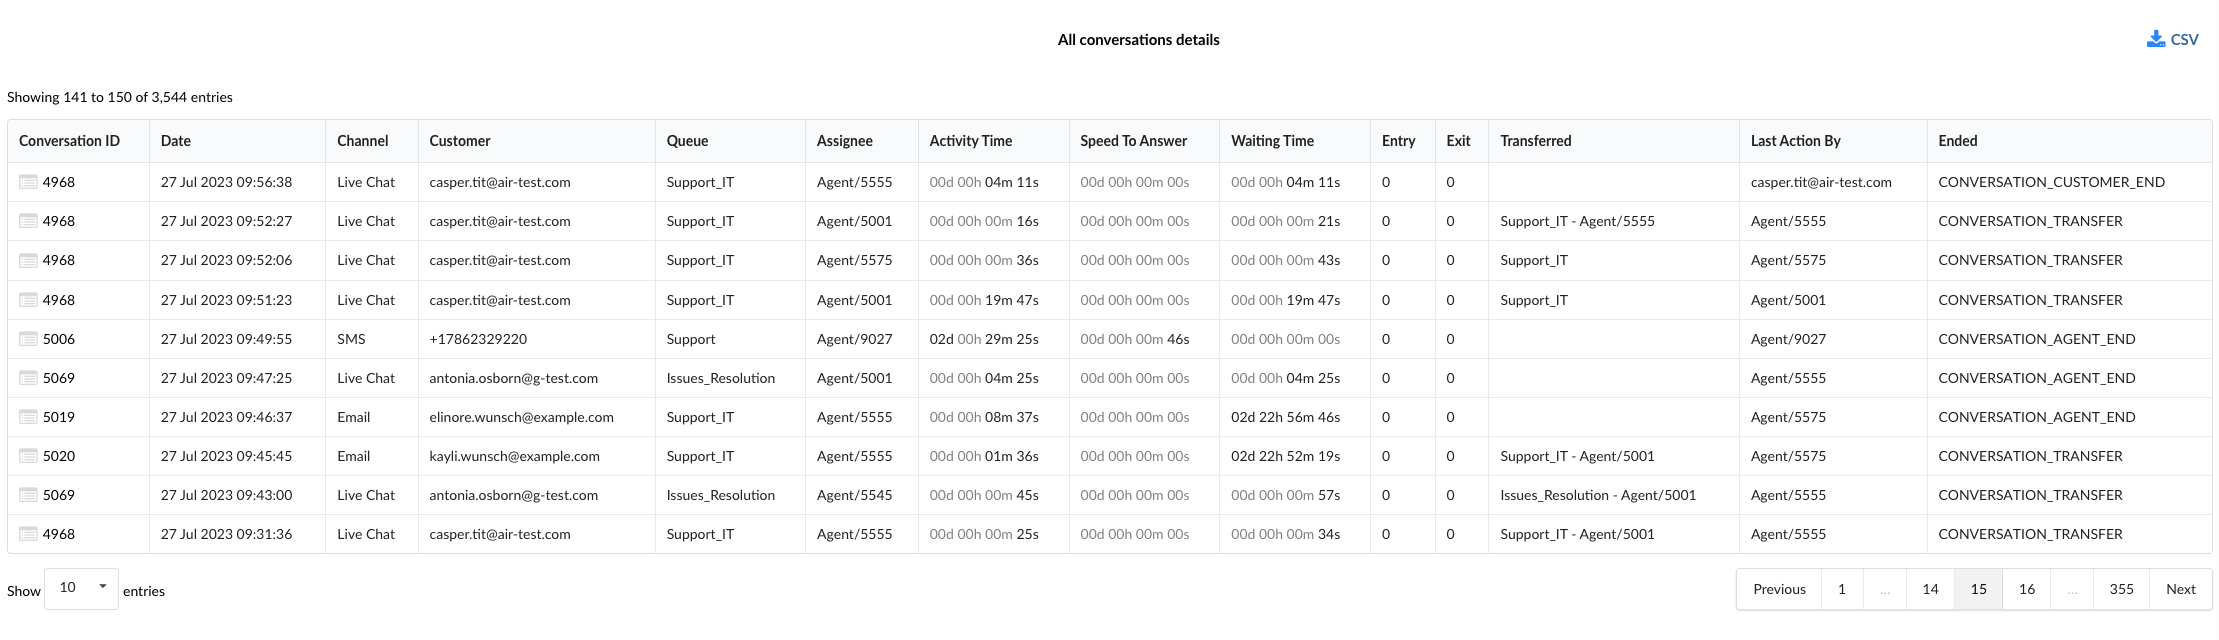
The "All conversations by channel breakdown" statistics table provides detailed information about each conversation handled across different communication channels. The table consists of fourteen columns, each offering specific information about the conversations.
Conversation ID : this column lists the unique identifiers of each conversation.
Date : This column indicates the date on which each conversation took place.
Channel : This column indicates the communication channel used for each conversation, such as chat, email, or messaging.
Client : This column lists the customers involved in each conversation.
Queue : This column displays the queue in which each conversation was handled.
Assignee : This column lists the agent assigned to each conversation.
Uptime : this column displays the total time that the agent spent on each conversation.
Answer speed : This column represents the time taken by the agent to answer each conversation.
Wait time : This column shows how much time each conversation spent waiting in the queue before receiving an answer.
Input : This column indicates the time at which each conversation entered the queue.
Output : this column indicates the time at which each conversation left the queue.
Transferred : This column indicates whether each conversation was transferred to another agent or another queue.
Last action by : this column indicates who performed the last action in the conversation, whether it was the agent or the customer.
Completed : This column indicates how each conversation ended.
Using the "All conversations by channel" statistics table, managers can gain a granular understanding of each conversation, identify patterns and implement strategies to improve agent performance and customer service.
External distribution of all conversations by channel
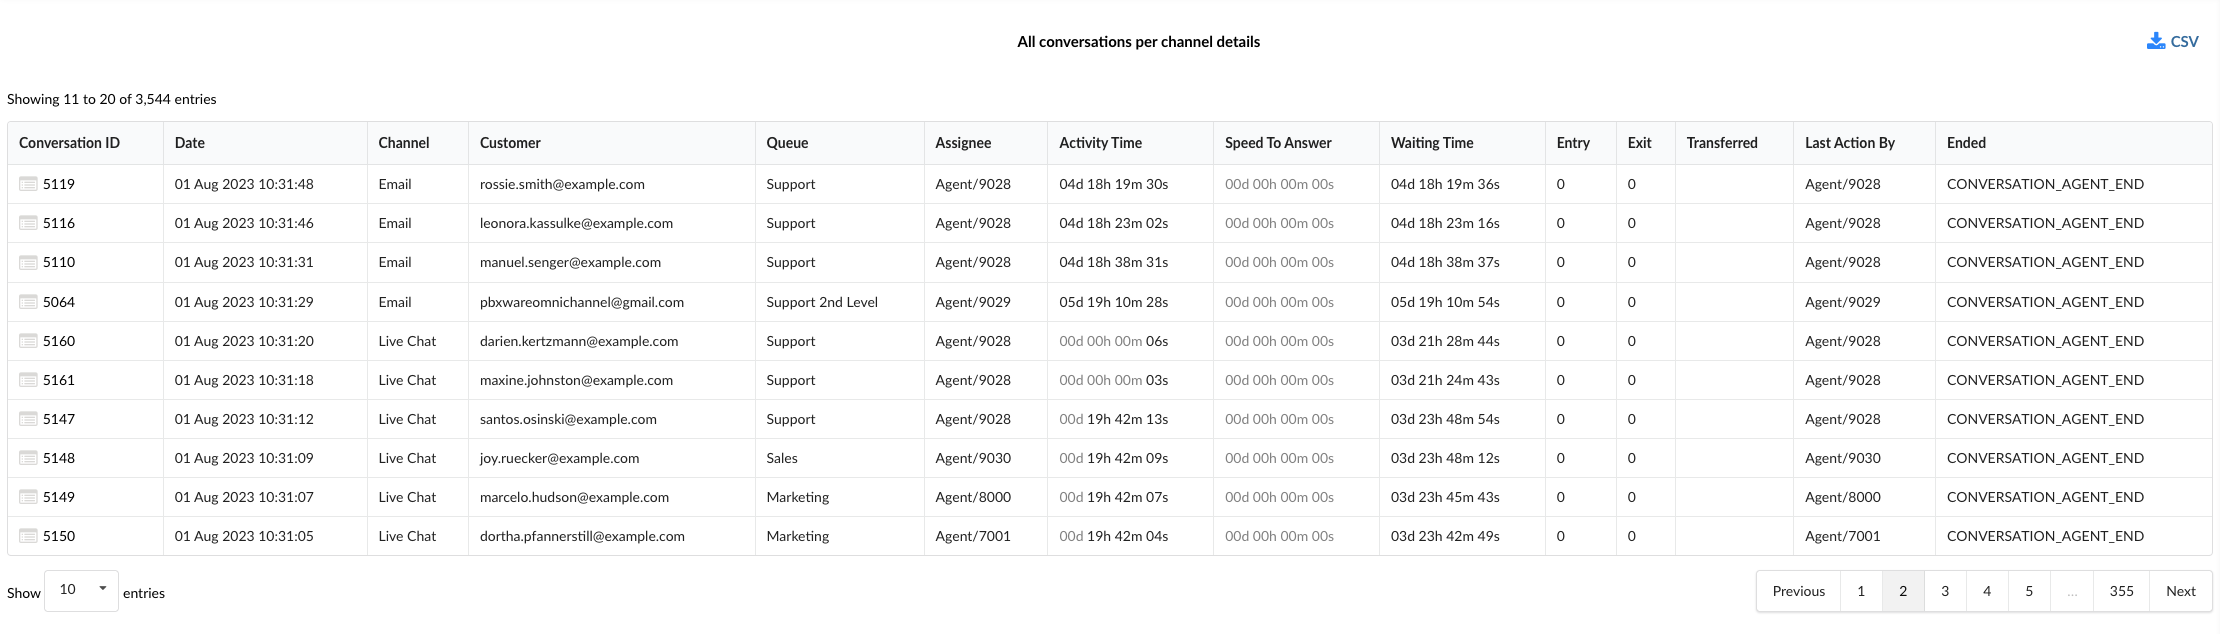
The "All conversations by external channel breakdown" statistics table provides detailed information about each conversation handled across different communication channels, with a focus on external interactions. The table consists of fourteen columns, each offering specific information about the conversations.
Conversation ID : this column lists the unique identifiers of each conversation.
Date : This column indicates the date on which each conversation took place.
Channel : This column indicates the communication channel used for each conversation, such as chat, email, or messaging.
Client : This column lists the customers involved in each conversation.
Queue : This column displays the queue in which each conversation was handled.
Assignee : This column lists the agent assigned to each conversation.
Uptime : this column displays the total time that the agent spent on each conversation.
Answer speed : This column represents the time taken by the agent to answer each conversation.
Wait time : This column shows how much time each conversation spent waiting in the queue before receiving an answer.
Input : This column indicates the time at which each conversation entered the queue.
Output : this column indicates the time at which each conversation left the queue.
Transferred : This column indicates whether each conversation was transferred to another agent or another queue.
Last action by : this column indicates who performed the last action in the conversation, whether it was the agent or the customer.
Completed : This column indicates how each conversation ended.
Using the "External breakdown of all conversations by channel" statistics table, managers can gain a granular understanding of each conversation, identify patterns in external interactions and implement strategies to improve agent performance and customer service.
Distribution of all conversation results by channel
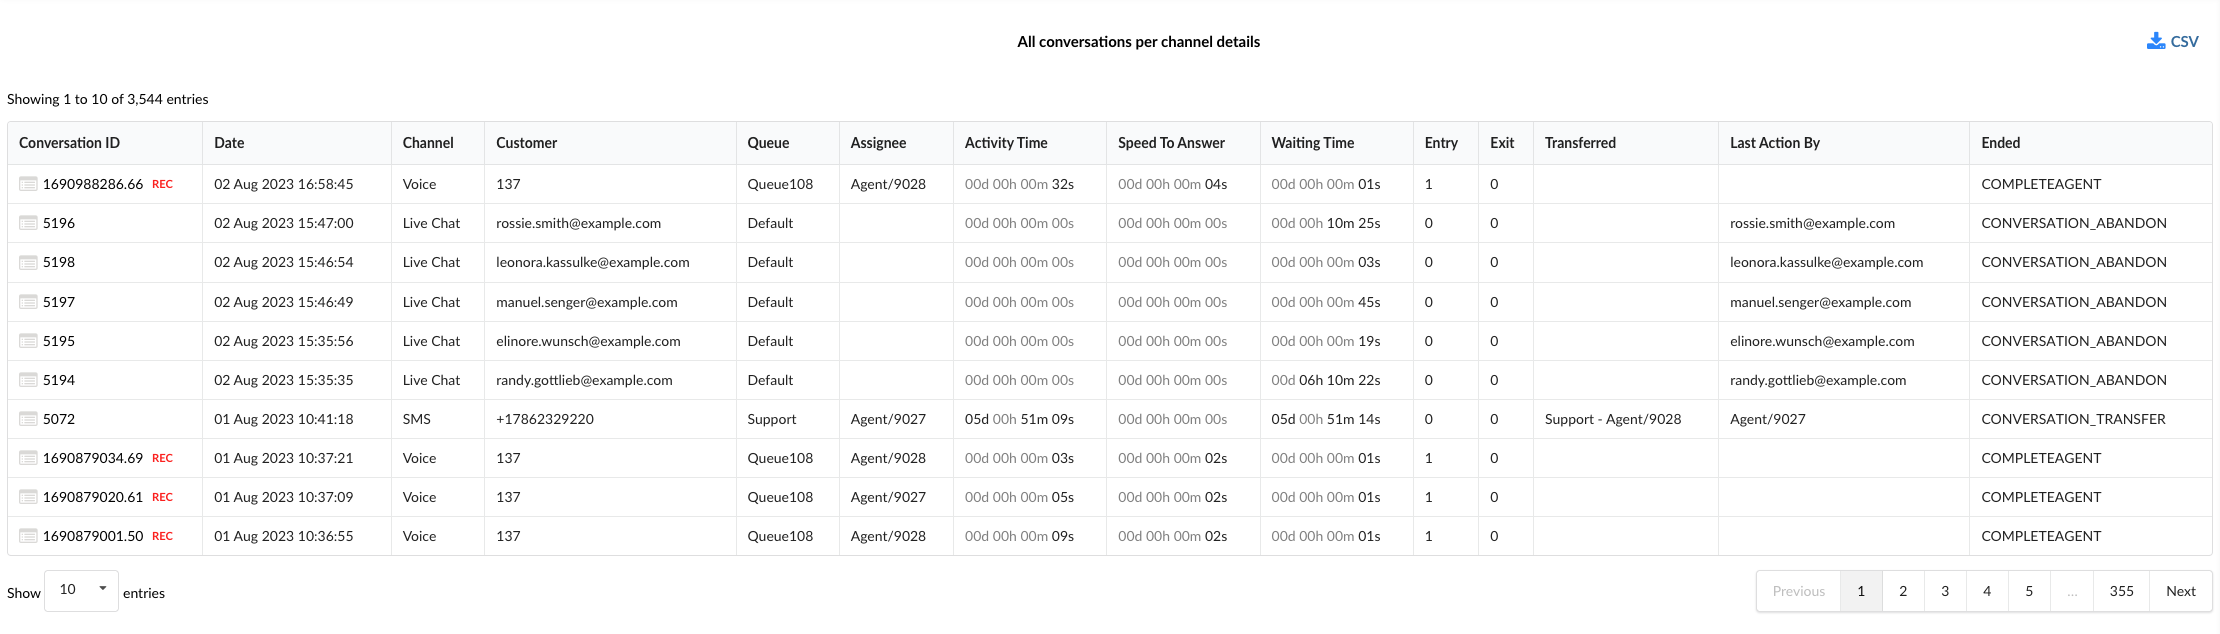
The "All conversation outcomes by channel breakdown" statistics table provides detailed information about each conversation handled across different communication channels, with a focus on the outcomes of these conversations. The table consists of fourteen columns, each offering specific information about the conversations and their outcomes.
Conversation ID : this column lists the unique identifiers of each conversation.
Date : This column indicates the date on which each conversation took place.
Channel : This column indicates the communication channel used for each conversation, such as chat, email, or messaging.
Client : This column lists the customers involved in each conversation.
Queue : This column displays the queue in which each conversation was handled.
Assignee : This column lists the agent assigned to each conversation.
Uptime : this column displays the total time that the agent spent on each conversation.
Answer speed : This column represents the time taken by the agent to answer each conversation.
Wait time : This column shows how much time each conversation spent waiting in the queue before receiving an answer.
Input : This column indicates the time at which each conversation entered the queue.
Output : this column indicates the time at which each conversation left the queue.
Transferred : This column indicates whether each conversation was transferred to another agent or another queue.
Last action by : this column indicates who performed the last action in the conversation, whether it was the agent or the customer.
Completed : this column indicates how each conversation ended, thereby providing an overview of the conversation outcomes.
Using the "All conversation outcomes by channel" statistics table, managers can gain a granular understanding of each conversation, identify patterns in conversation outcomes and implement strategies to improve agent performance and customer service.
Chart of all conversations by channel
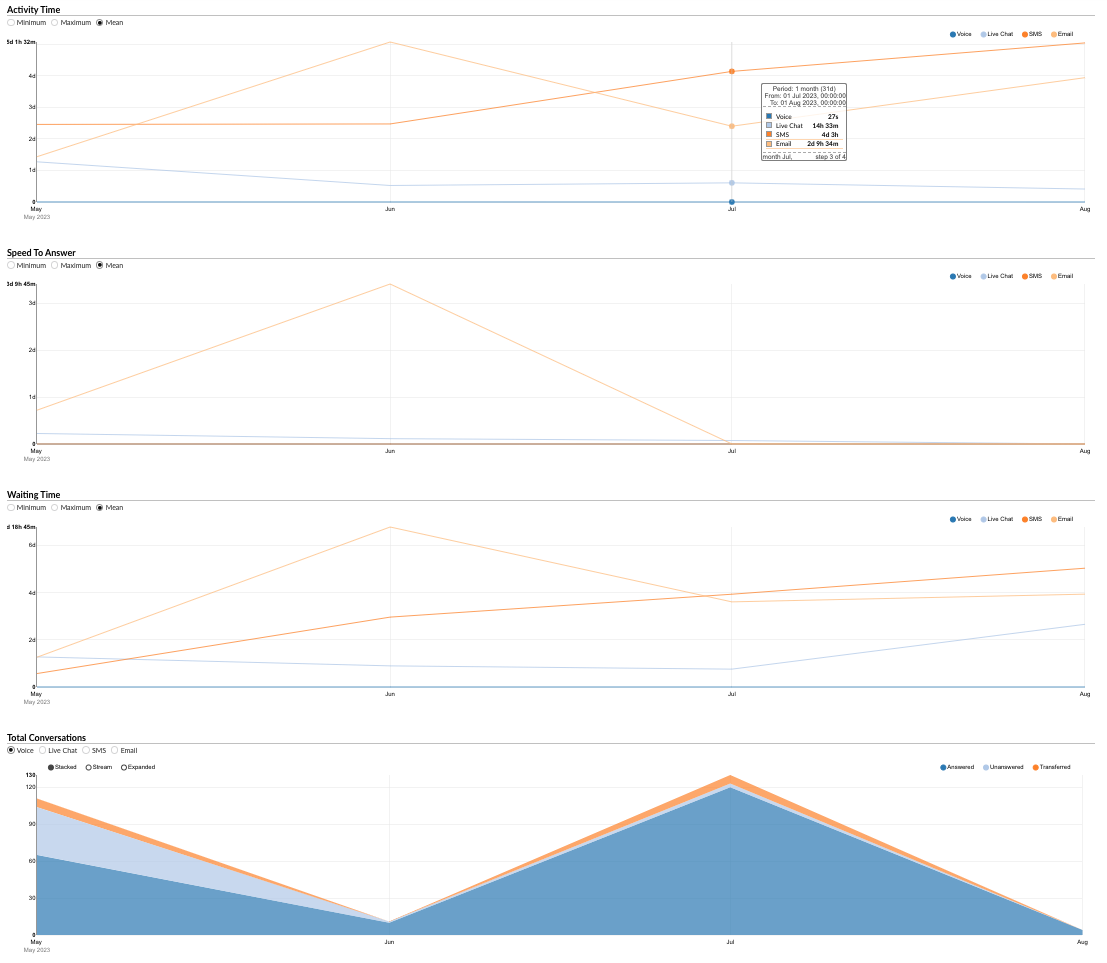
The "Chart of all conversations by channel" provides a visual representation of various aspects of all conversations handled across different communication channels. The chart is divided into four sections, each focusing on a specific aspect of the conversations.
Uptime
This section allows users to monitor the durations of conversations for each channel over a specific period.
- Radio buttons (left) : users can choose between “Minimum”, “Maximum”, and “Average” to display the corresponding data for the activity duration.
- Radio buttons (right) : users can filter the data by channel, selecting between “Voice”, “Live Chat”, “SMS”, and “Email”.
Using this section, managers can analyze trends in conversation duration and identify areas for improvement.
Answer speed
This section gives an overview of the speed at which agents respond to conversations across different channels.
- Radio buttons (left) : users can choose between “Minimum”, “Maximum”, and “Average” to display the corresponding data for the response speed.
- Radio buttons (right) : users can filter the data by channel, selecting between “Email”, “Voice”, “Live Chat”, and “SMS”.
This section helps to understand how quickly agents respond to customer requests and can guide efforts to reduce response times.
Wait time
This section allows users to track the wait times of conversations for each channel over a specific period.
- Radio buttons (left) : users can choose between “Minimum”, “Maximum”, and “Average” to display the corresponding data for the wait time.
- Radio buttons (right) : users can filter the data by channel, selecting between “Voice”, “Live Chat”, “SMS”, and “Email”.
Using this section, managers can analyze wait time trends and identify areas for improvement.
Total conversations
This section allows users to monitor the total number of conversations for each channel over a specific period.
- Radio buttons (left) : users can filter the data by channel, selecting between “Email”, “Voice”, “Live Chat”, and “SMS”.
- Radio buttons (right) : users can view data for “Answered”, “Unanswered”, and “Transferred” conversations.
Using the "Total conversations" section, managers can gain an overview of the volume and outcomes of conversations, thus contributing to resource allocation and performance improvement.
The "Chart of all conversations by channel" is a powerful tool for visually analyzing various aspects of conversations, enabling managers to make informed decisions and implement strategies to improve customer service and efficiency.
External chart of all conversations by channel
The “All conversations by external channel” chart provides a visual representation of various aspects of all external conversations handled across different communication channels. The chart is divided into three sections, each focusing on a specific aspect of the conversations.
First response time
This section allows users to track the first response times of conversations for each channel over a specified period.
- Radio buttons (left) : users can choose between “Minimum”, “Maximum”, and “Average” to display the corresponding data for the first response time.
- Radio buttons (right) : users can filter the data by channel, selecting between “Voice”, “Live Chat”, “SMS”, and “Email”.
Using this section, managers can analyze first response time trends and identify areas for improvement.
Resolution time
This section gives an overview of the resolution times of conversations across different channels.
- Radio buttons (left) : users can choose between “Minimum”, “Maximum”, and “Average” to display the corresponding data for the resolution time.
- Radio buttons (right) : users can filter the data by channel, selecting between “Email”, “Voice”, “Live Chat”, and “SMS”.
This section helps to understand how quickly agents resolve customer requests and can guide efforts to reduce resolution times.
Total conversations
This section allows users to monitor the total number of external conversations for each channel over a specific period.
- Radio buttons (left) : users can filter the data by channel, selecting between “Email”, “Voice”, “Live Chat”, and “SMS”.
- Radio buttons (right) : users can view data for “Answered”, “Unanswered”, and “Transferred” conversations.
Using the "Total conversations" section, managers can gain an overview of the volume and outcomes of external conversations, thus contributing to resource allocation and performance improvement.
The "External chart of all conversations by channel" is a powerful tool for visually analyzing various aspects of external conversations, enabling managers to make informed decisions and implement strategies to improve customer service and efficiency.
Chart of all conversation outcomes by channel
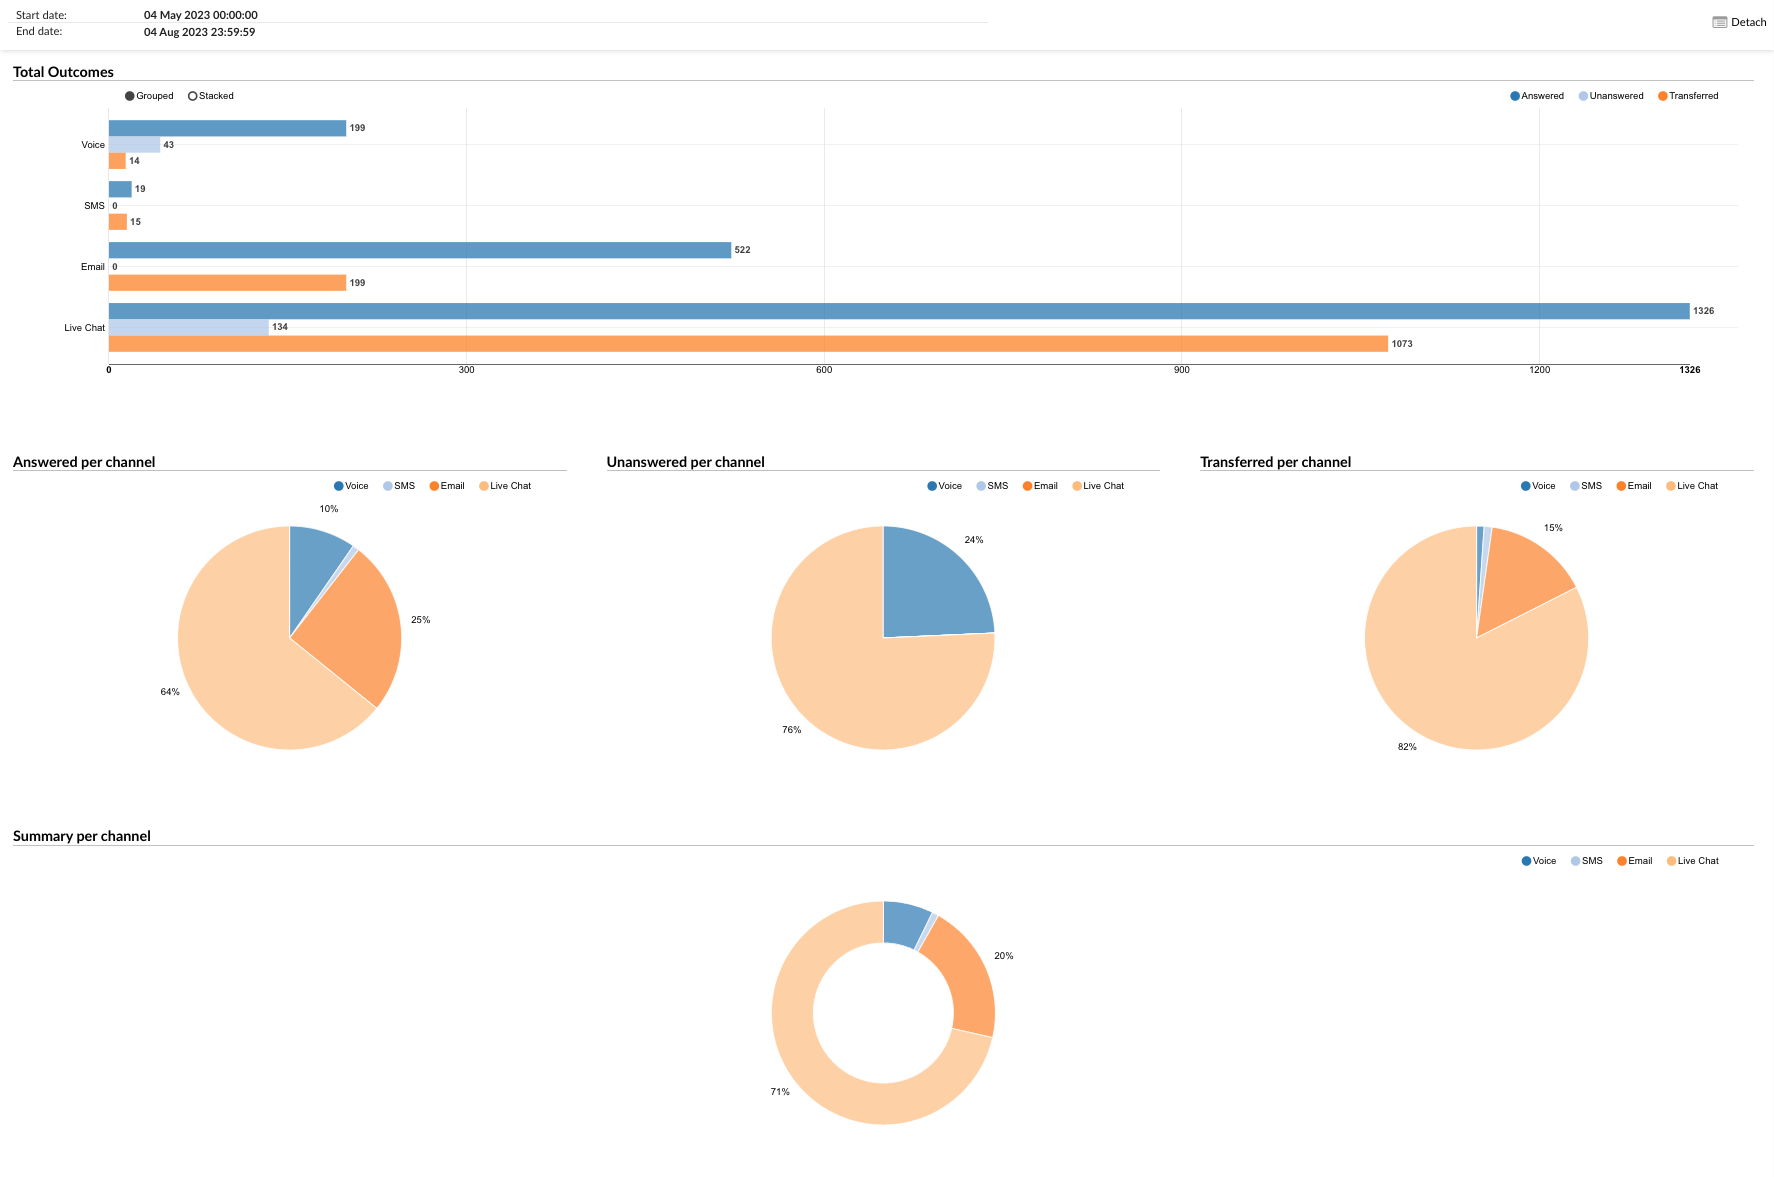
The “All conversation outcomes by channel” chart provides a visual representation of the outcomes of all conversations handled across different communication channels. The chart is divided into five sections, each focusing on a specific aspect of the conversation outcomes.
Total results
This section presents a horizontal bar chart showing the "Answered", "Unanswered", and "Transferred" conversations for each channel.
- Radio buttons : users can filter the data by selecting the desired outcome (Answered, Unanswered, Transferred) to display the corresponding data for each channel.
Reply by channel
This section provides a pie chart that represents the proportion of answered conversations for each channel.
- Radio buttons : users can filter the data by channel, selecting between “Voice”, “Live Chat”, “SMS”, and “Email”.
No answer per channel
This section provides a pie chart that represents the proportion of unanswered conversations for each channel.
- Radio buttons : users can filter the data by channel, selecting between “Voice”, “Live Chat”, “SMS”, and “Email”.
Transferred by channel
This section provides a pie chart that represents the proportion of transferred conversations for each channel.
- Radio buttons : users can filter the data by channel, selecting between “Voice”, “Live Chat”, “SMS”, and “Email”.
Summary by channel
This section provides a summary pie chart that represents the overall distribution of conversation results for each channel.
- Radio buttons : users can filter the data by channel, selecting between “Voice”, “Live Chat”, “SMS”, and “Email”.
The “All conversation outcomes by channel” chart is a powerful tool for visually analyzing conversation outcomes, allowing managers to identify trends, make informed decisions and implement strategies to improve customer service and efficiency.
All conversations by queue
This feature provides a complete overview of all the conversations that have taken place in each queue. The information is divided into three tables:
All conversations by queue
This table provides a detailed breakdown of each conversation by queue. The columns in this table are:
- Queue : The specific queue where the conversation took place.
- Channel : The communication channel used for the conversation.
- Uptime : This column is divided into four sub-columns:
- Total : the total activity duration for all conversations in the queue.
- Min : The shortest activity time recorded in the queue.
- Max : The longest activity time recorded in the queue.
- Average : the average activity duration of all conversations in the queue.
- Response speed : This column is divided into four sub-columns:
- Total : The total time needed to answer all conversations in the queue.
- Min : The shortest time needed to answer a conversation in the queue.
- Max : The longest time needed to answer a conversation in the queue.
- Average : The average time needed to answer conversations in the queue.
- Wait time : This column is divided into four sub-columns:
- Total : The total wait time for all conversations in the queue.
- Min : The shortest wait time recorded in the queue.
- Max : The longest wait time recorded in the queue.
- Average : The average wait time of all conversations in the queue.
All conversations by queue (external)
This table provides a detailed breakdown of each external conversation by queue. The columns in this table are:
- Queue : The specific queue where the conversation took place.
- Channel : The communication channel used for the conversation.
- First response time : This column is divided into four sub-columns:
- Total : the total first response time for all external conversations in the queue.
- Min : The shortest first response time recorded in the queue.
- Max : The longest first response time recorded in the queue.
- Average : the average first response time of all external conversations in the queue.
- Resolution time : This column is divided into four sub-columns:
- Total : The total resolution time of all external conversations in the queue.
- Min : The shortest resolution time recorded in the queue.
- Max : The longest resolution time recorded in the queue.
- Average : The average resolution time of all external conversations in the queue.
All conversation results by queue
This table provides a detailed breakdown of the outcomes of each conversation by queue. The columns in this table are:
- Queue : The specific queue where the conversation took place.
- Channel : The communication channel used for the conversation.
- Total : The total number of conversations in the queue.
- Answered : total number of answered conversations in the queue.
- No answer : total number of conversations left unanswered in the queue.
- Ended by the agent (%) : percentage of conversations ended by the agent.
- Ended by the customer (%) : percentage of conversations ended by the customer.
- Transferred (%) : percentage of conversations transferred to another queue or another agent.
- Abandoned (%) : percentage of conversations abandoned by the customer before receiving a response.
- Output with key (%) : percentage of conversations where the customer left the queue using a key.
- Timeout (%) : percentage of conversations that timed out before receiving a response.
This documentation provides a comprehensive overview of the "All conversations by queue" feature. For more detailed information or assistance, please refer to the official product documentation or contact our support team.
Distribution of all conversations by queue
This feature provides a detailed overview of each conversation that has taken place in each queue. The information is presented in a table with the following columns:
Conversation ID : a unique identifier for each conversation. This can be used to track or reference a specific conversation.
Date : The date on which the conversation took place.
Channel : The communication channel used for the conversation. This can be by phone, email, chat, etc.
Client : The customer involved in the conversation. This may be the customer’s name, ID, or any other identifier used in your system.
Queue : The specific queue where the conversation took place.
Recipient : the agent or representative in charge of handling the conversation.
Uptime : The total duration of activity for the conversation. This includes the time the agent spent talking to the customer, as well as any after-call work.
Answer speed : time needed for the agent to respond to the conversation after it is launched.
Wait time : The time the customer spent waiting before the agent answered the conversation.
Input : The method or entry point of the conversation into the queue. It may be a direct call, a transfer from another queue, etc.
Quit : The method or exit point of the conversation from the queue. It may be a hang-up, a transfer to another queue, etc.
Transferred : Indicates whether the conversation was transferred to another queue or another agent. It could be a “Yes” or a “No”, or it may provide more detailed information.
Last action by : The last person (either an agent or the customer) who performed an action in the conversation.
Completed : Indicates how the conversation ended. It could be “By agent”, “By customer”, “Timeout”, etc.
External distribution of all conversations by queue
The "All conversations by external queue breakdown" statistics table provides detailed information about each conversation handled across different communication channels, with a focus on external interactions. The table consists of fourteen columns, each offering specific information about the conversations.
Conversation ID : this column lists the unique identifiers of each conversation.
Date : This column indicates the date on which each conversation took place.
Channel : This column indicates the communication channel used for each conversation, such as chat, email, or messaging.
Client : This column lists the customers involved in each conversation.
Queue : This column displays the queue in which each conversation was handled.
Assignee : This column lists the agent assigned to each conversation.
Uptime : this column displays the total time that the agent spent on each conversation.
Answer speed : This column represents the time taken by the agent to answer each conversation.
Wait time : This column shows how much time each conversation spent waiting in the queue before receiving an answer.
Input : This column indicates the time at which each conversation entered the queue.
Output : this column indicates the time at which each conversation left the queue.
Transferred : This column indicates whether each conversation was transferred to another agent or another queue.
Last action by : this column indicates who performed the last action in the conversation, whether it was the agent or the customer.
Completed : This column indicates how each conversation ended.
Using the "All conversations by external queue breakdown" statistics table, managers can gain a granular understanding of each conversation, identify patterns in external interactions and implement strategies to improve agent performance and customer service.
This documentation provides a comprehensive overview of the "All conversations by queue breakdown" feature. For more detailed information or assistance, please refer to the official product documentation or contact our support team.
Results of all conversations by queue breakdown
The "All conversation outcomes by queue breakdown" statistics table provides detailed information about each conversation handled across different communication channels, with a focus on the outcomes of these conversations. The table consists of fourteen columns, each offering specific information about the conversations and their outcomes.
Conversation ID : this column lists the unique identifiers of each conversation.
Date : This column indicates the date on which each conversation took place.
Channel : This column indicates the communication channel used for each conversation, such as chat, email, or messaging.
Client : This column lists the customers involved in each conversation.
Queue : This column displays the queue in which each conversation was handled.
Assignee : This column lists the agent assigned to each conversation.
Uptime : this column displays the total time that the agent spent on each conversation.
Answer speed : This column represents the time taken by the agent to answer each conversation.
Wait time : This column shows how much time each conversation spent waiting in the queue before receiving an answer.
Input : This column indicates the time at which each conversation entered the queue.
Output : this column indicates the time at which each conversation left the queue.
Transferred : This column indicates whether each conversation was transferred to another agent or another queue.
Last action by : this column indicates who performed the last action in the conversation, whether it was the agent or the customer.
Completed : this column indicates how each conversation ended, thereby providing an overview of the conversation outcomes.
Using the "All conversation outcomes by queue breakdown" statistics table, managers can gain a granular understanding of each conversation, identify patterns in conversation outcomes and implement strategies to improve agent performance and customer service.
Chart of all conversations by queue
The “All conversations by queue” chart provides a visual representation of various aspects of all conversations handled across different queues. The chart is divided into four sections, each focusing on a specific aspect of the conversations.
Uptime
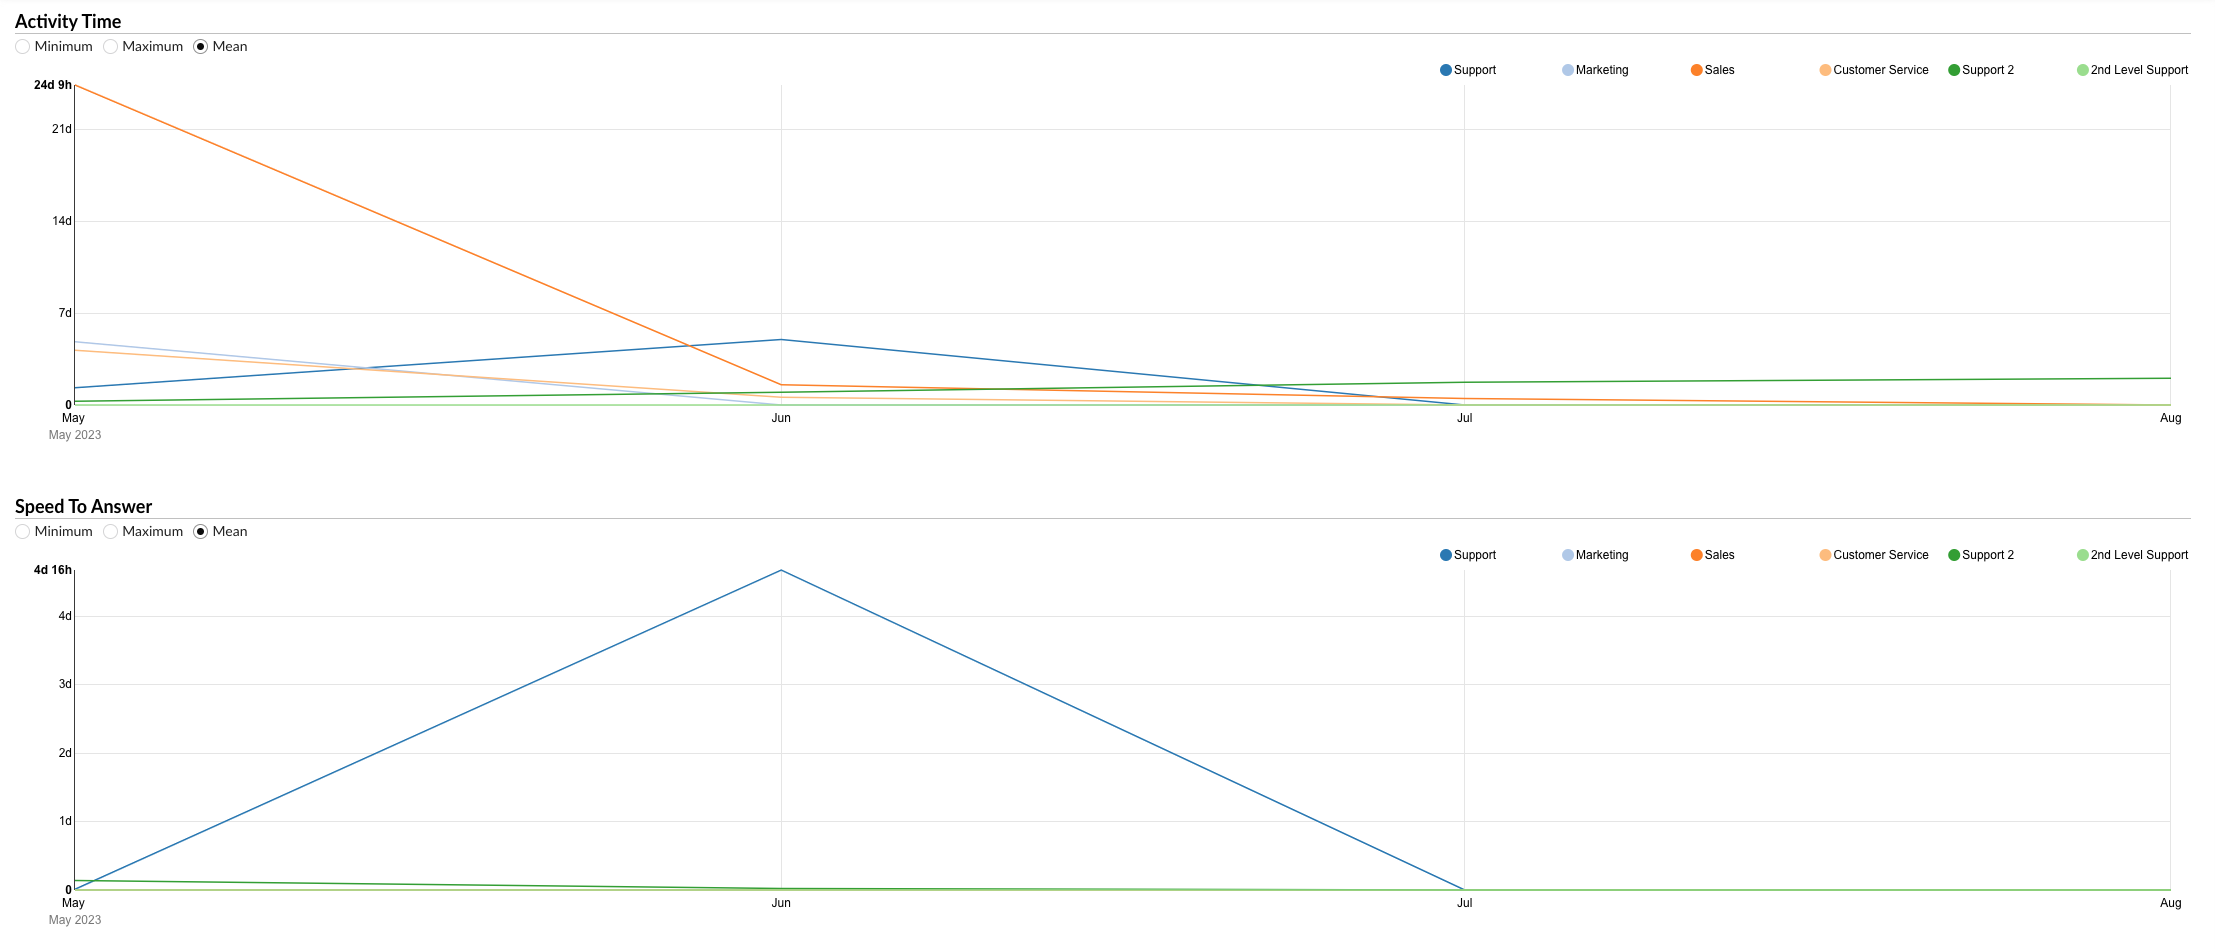
This section allows users to monitor the durations of conversations for each queue over a specific period.
- Radio buttons (left) : users can choose between “Minimum”, “Maximum”, and “Average” to display the corresponding data for the activity duration.
- Radio buttons (right) : users can filter the data by queue.
- Hover : users can hover over the chart line to see the exact data for each queue.
Answer speed
This section provides information about the speed at which agents respond to conversations in different queues.
- Radio buttons (left) : users can choose between “Minimum”, “Maximum”, and “Average” to display the corresponding data for the response speed.
- Radio buttons (right) : users can filter the data by queue.
- Hover : users can hover over the chart line to see the exact data for each queue.
Wait time
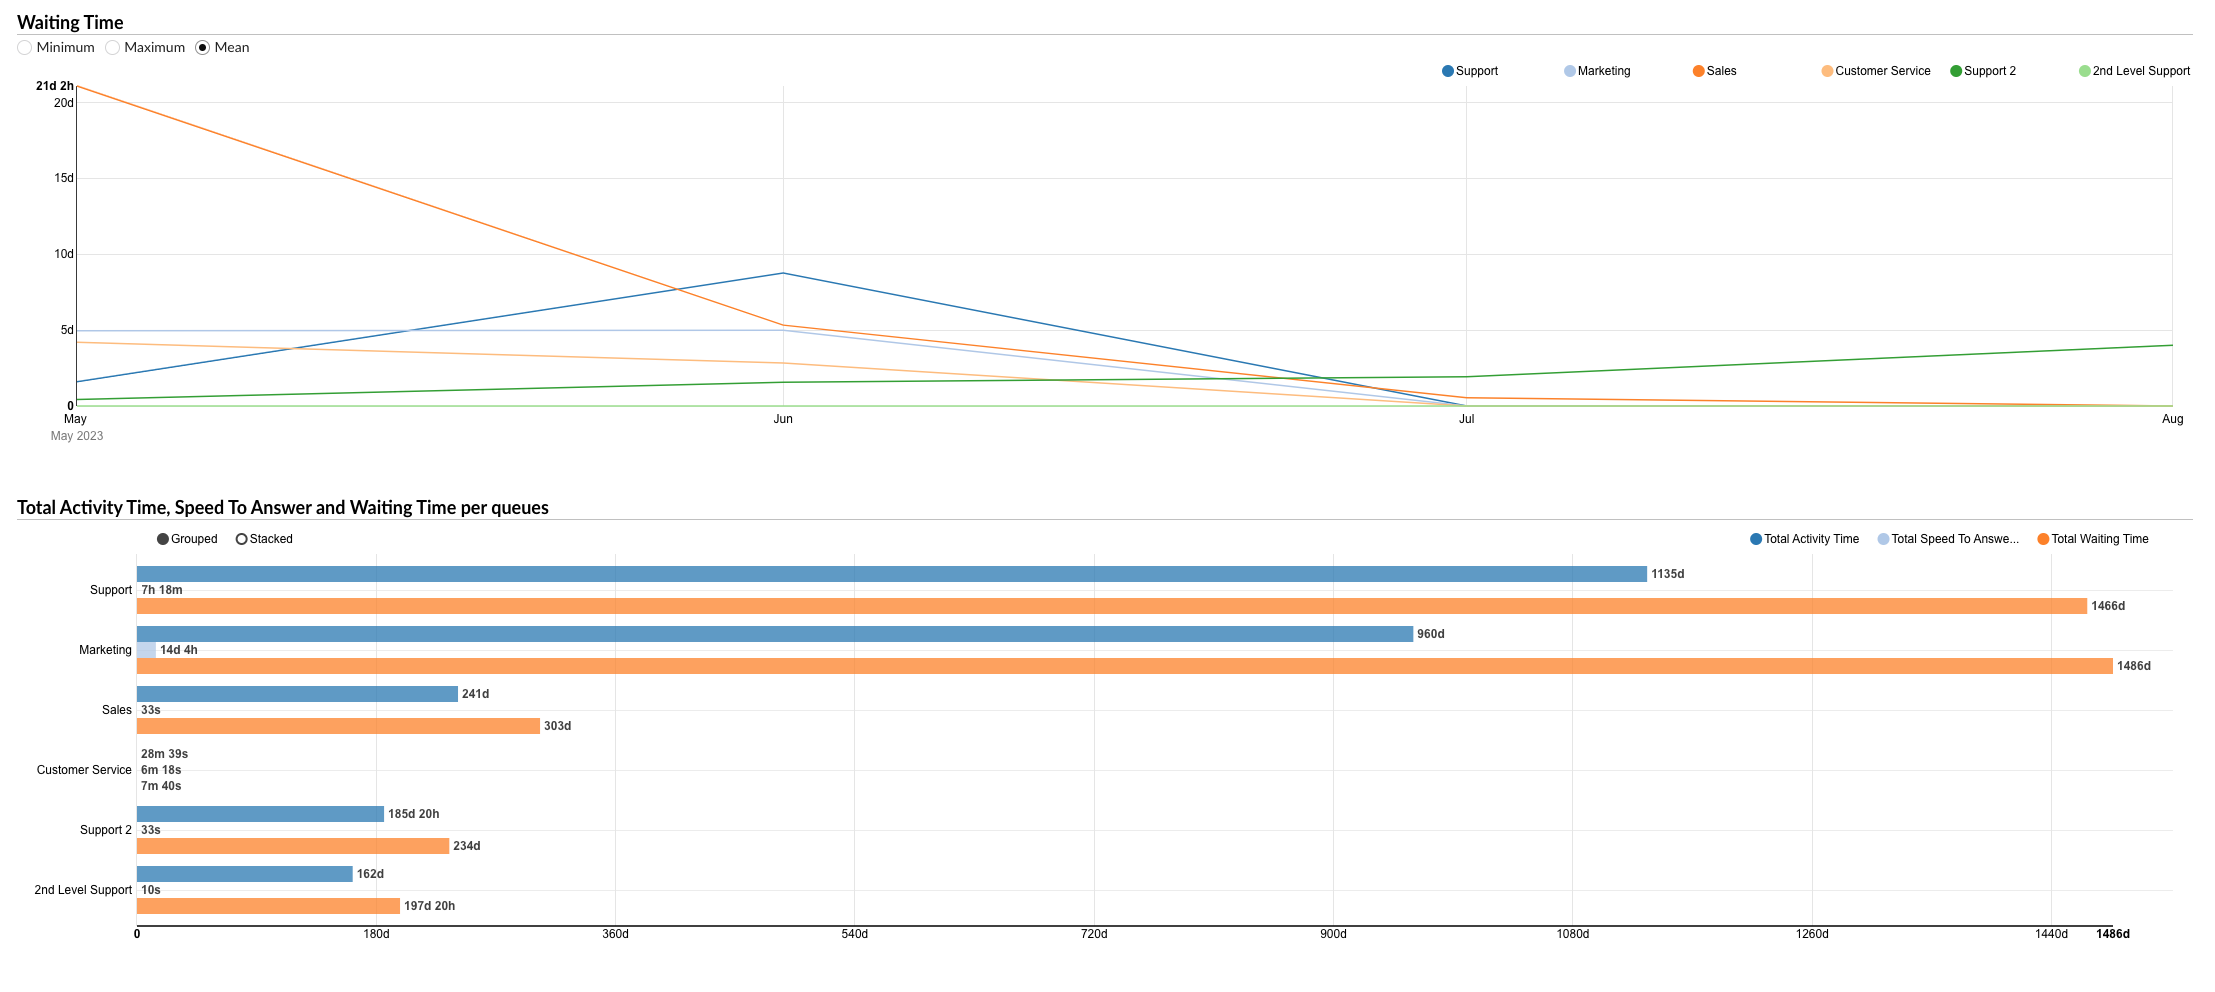
This section allows users to monitor the wait times of conversations for each queue over a specific period.
- Radio buttons (left) : users can choose between “Minimum”, “Maximum”, and “Average” to display the corresponding data for the wait time.
- Radio buttons (right) : users can filter the data by queue.
- Hover : users can hover over the chart line to see the exact data for each queue.
Total active time, response speed, and wait time per queue
This section presents a bar chart showing the total activity time, total answer speed, and total wait time for all queues.
- Hover : users can hover over the bars to see the exact data for each queue.
The “All conversations by queue” chart is a powerful tool for visually analyzing various aspects of conversations, allowing managers to identify trends, make informed decisions and implement strategies to improve customer service and efficiency.
Answered conversations by channel
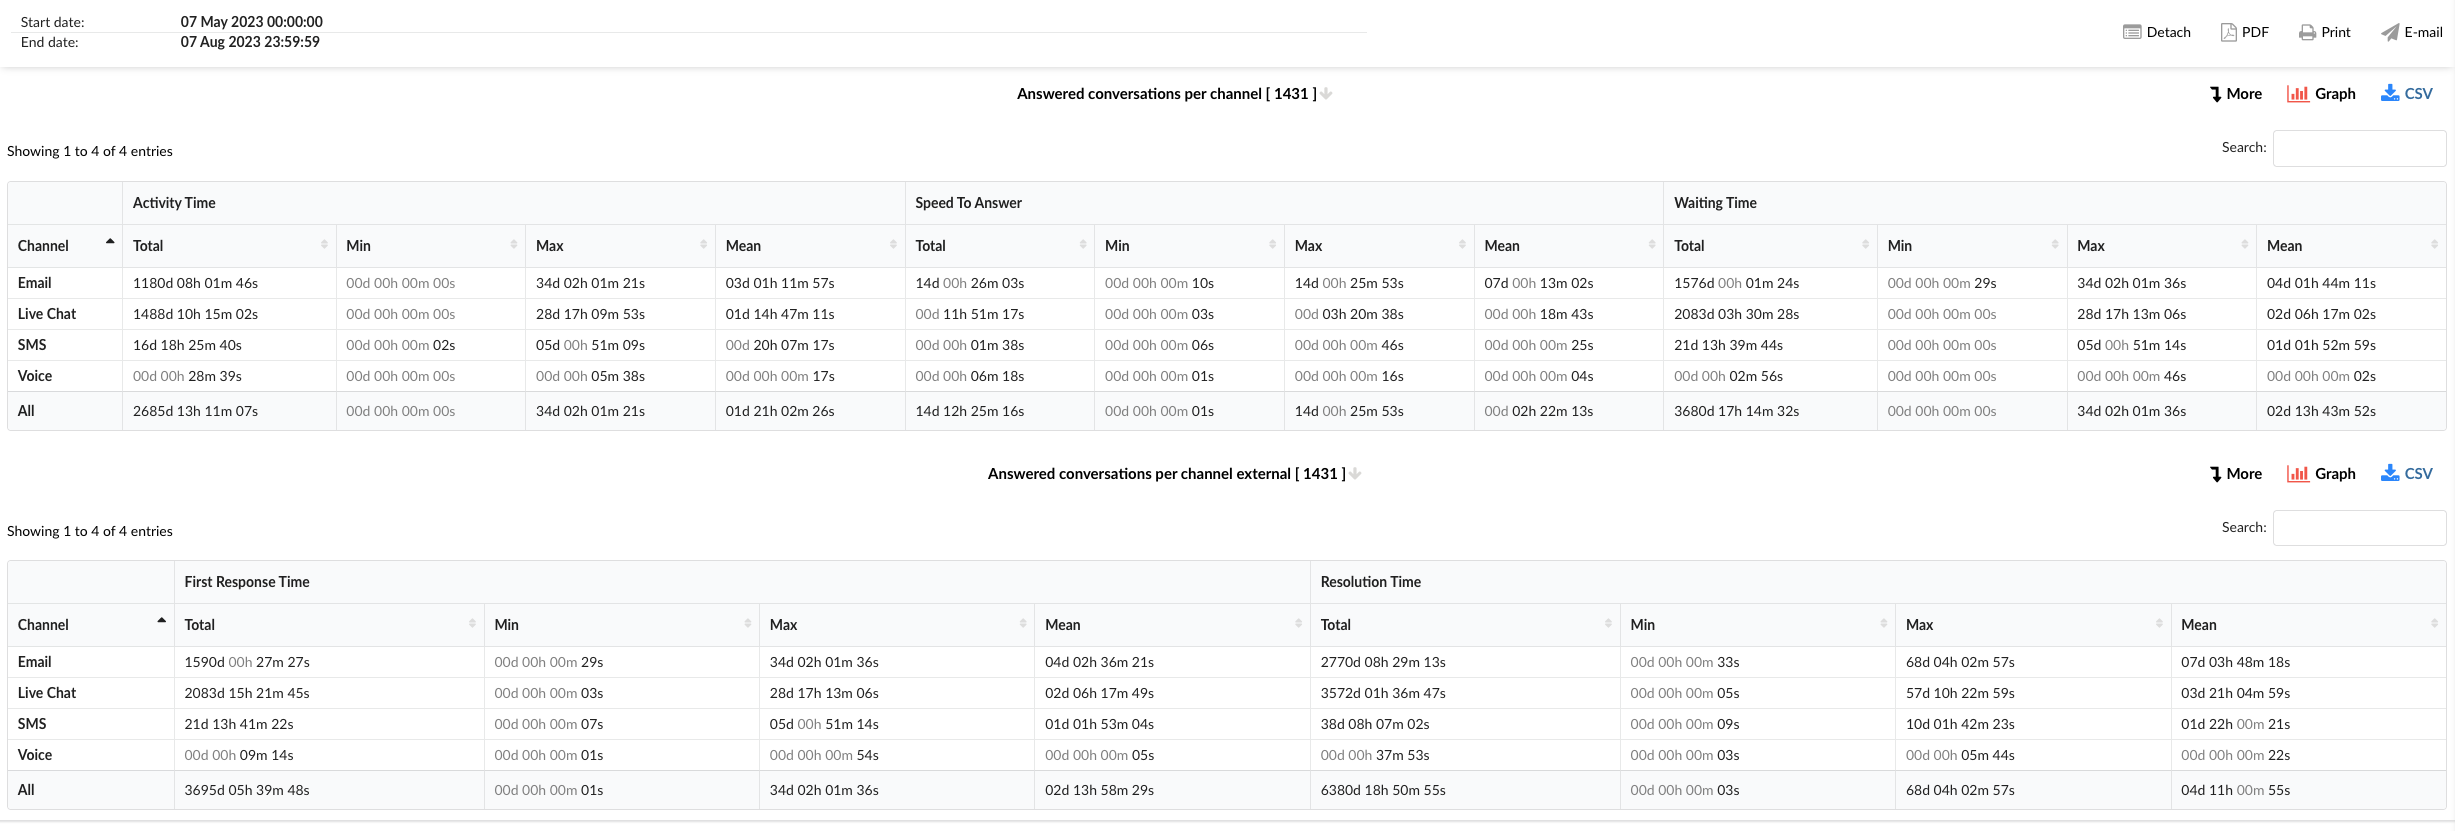
The “Answered conversations by channel” statistics provide detailed information about all answered conversations handled across different communication channels. The statistics are divided into two tables, each focusing on a specific aspect of the answered conversations.
Answered conversations by channel
This table provides information on the active time, response speed, and wait time of answered conversations for each channel.
Channel : this column lists the communication channels, including “Email”, “Live Chat”, “SMS”, “Voice” and an “All” option to display aggregated data.
Uptime : this column displays the total, minimum, maximum, and average activity time for each channel.
Answer speed : This column represents the total, minimum, maximum and average speed of answer for each channel.
Wait time : This column shows the total, minimum, maximum and average waiting time for each channel.
Conversations answered by external channel
This table gives an overview of the first response time and resolution time of answered conversations for each channel.
Channel : this column lists the communication channels, including “Email”, “Live Chat”, “SMS”, “Voice” and an “All” option to display aggregated data.
First response time : this column displays the total, minimum, maximum, and average first response time for each channel.
Resolution time : This column represents the total, minimum, maximum and average resolution time for each channel.
The “Answered conversations by channel” statistics constitute a powerful tool for analyzing agent performance in handling answered conversations, allowing managers to identify trends, make informed decisions and implement strategies to improve customer service and efficiency.
Absolutely, here is user-friendly documentation for the “Conversations answered by channel breakdown” statistics:
Distribution of answered conversations by channel
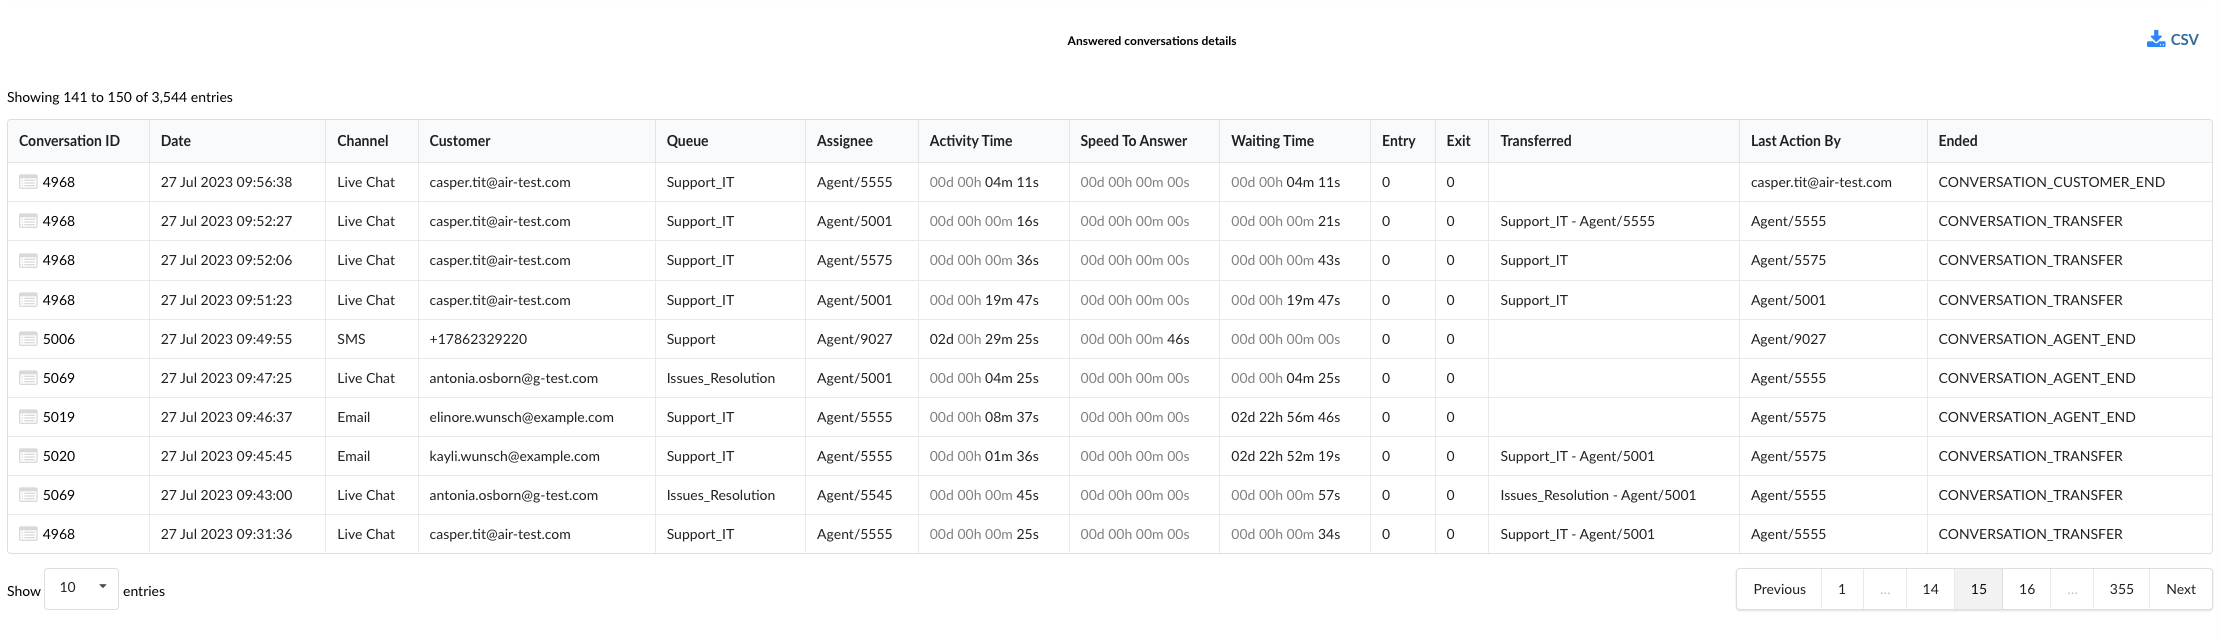
The "Answered conversations by channel breakdown" statistics table provides detailed information about each answered conversation handled across different communication channels. The table consists of fourteen columns, each offering specific information about the conversations.
Conversation ID : this column lists the unique identifiers of each conversation.
Date : This column indicates the date on which each conversation took place.
Channel : This column indicates the communication channel used for each conversation, such as chat, email, or messaging.
Client : This column lists the customers involved in each conversation.
Queue : This column displays the queue in which each conversation was handled.
Assignee : This column lists the agent assigned to each conversation.
Uptime : this column displays the total time that the agent spent on each conversation.
Answer speed : This column represents the time taken by the agent to answer each conversation.
Wait time : This column shows how much time each conversation spent waiting in the queue before receiving an answer.
Input : This column indicates the time at which each conversation entered the queue.
Output : this column indicates the time at which each conversation left the queue.
Transferred : This column indicates whether each conversation was transferred to another agent or another queue.
Last action by : this column indicates who performed the last action in the conversation, whether it was the agent or the customer.
Completed : This column indicates how each conversation ended.
Using the "Answered conversations by channel" statistics table, managers can gain a granular understanding of each conversation, identify patterns in answered interactions and implement strategies to improve agent performance and customer service.
Chart of answered conversations by channel
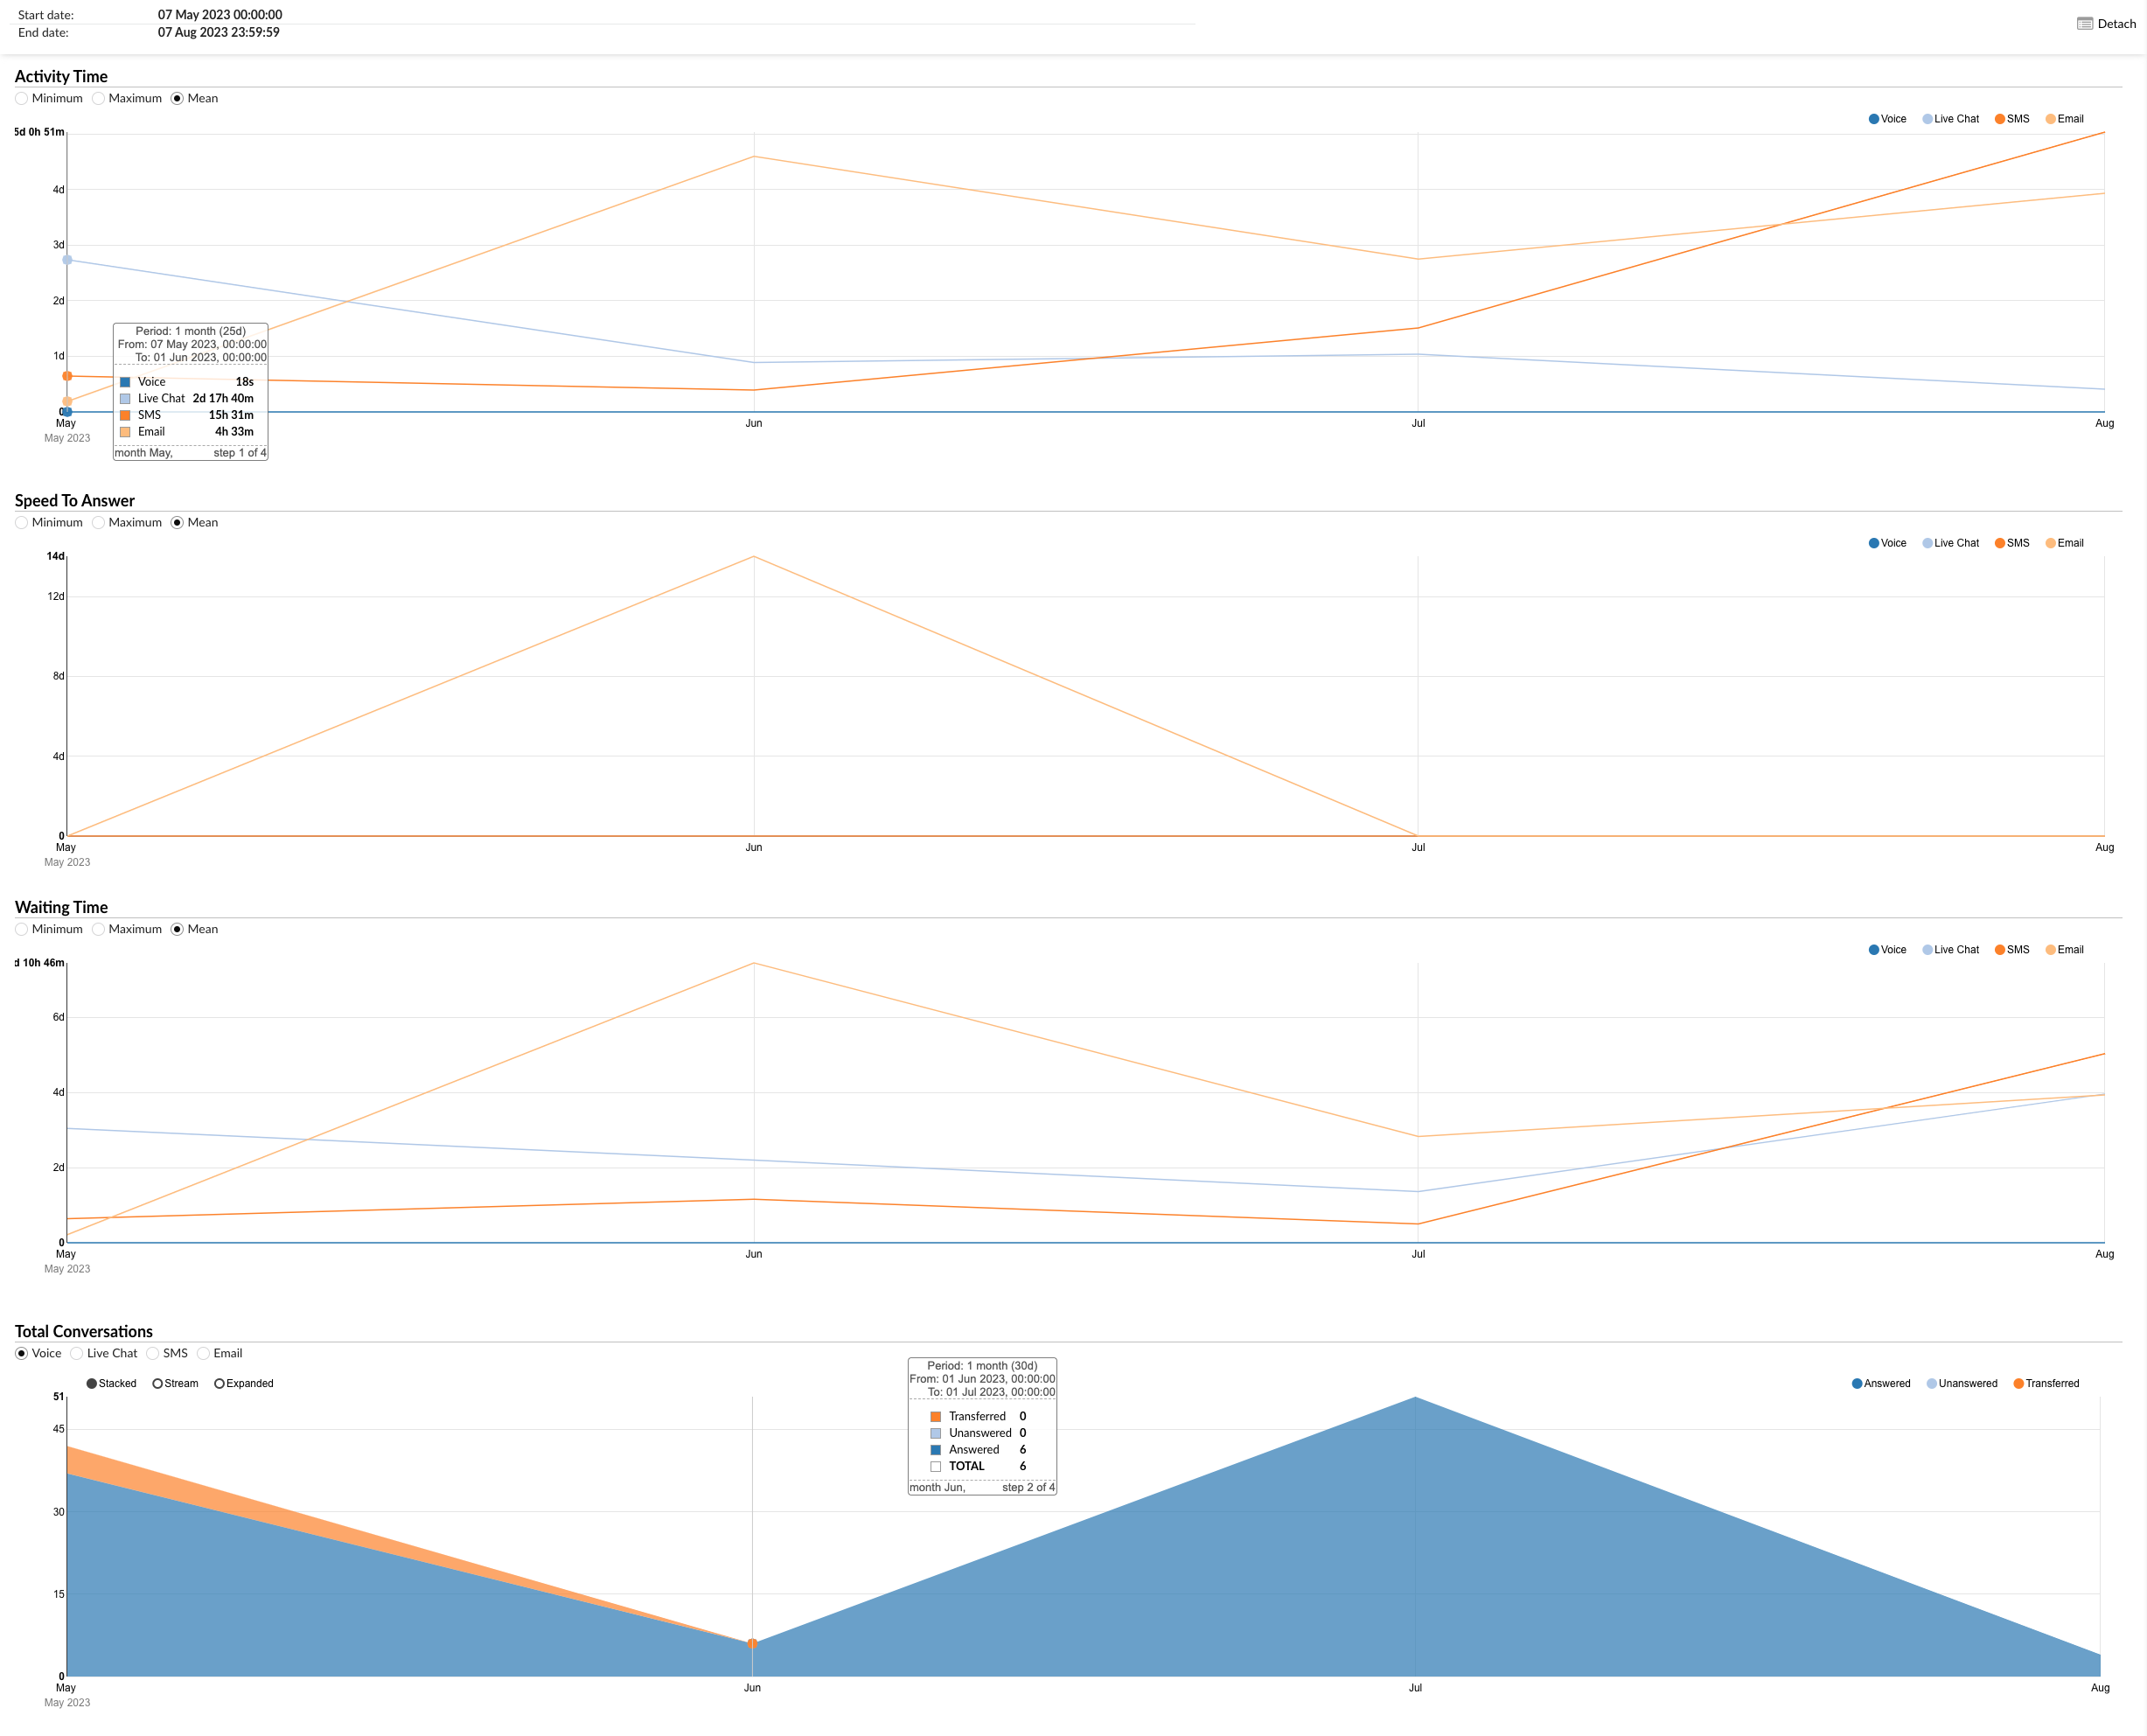
The “Answered conversations by channel” chart provides a visual representation of various aspects of all answered conversations handled across different communication channels. The chart is divided into four sections, each focusing on a specific aspect of the conversations.
Uptime
This section allows users to monitor the durations of conversations for each channel over a specific period.
- Radio buttons (left) : users can choose between “Minimum”, “Maximum”, and “Average” to display the corresponding data for the activity duration.
- Radio buttons (right) : users can filter the data by channel (Voice, Live Chat, SMS, Email).
- Hover : users can hover over the chart line to see the exact data for each channel.
Answer speed
This section gives an overview of the speed at which agents respond to conversations across different channels.
- Radio buttons (left) : users can choose between “Minimum”, “Maximum”, and “Average” to display the corresponding data for the response speed.
- Radio buttons (right) : users can filter the data by channel (Voice, Live Chat, SMS, Email).
- Hover : users can hover over the chart line to see the exact data for each channel.
Wait time
This section allows users to track the wait times of conversations for each channel over a specific period.
- Radio buttons (left) : users can choose between “Minimum”, “Maximum”, and “Average” to display the corresponding data for the wait time.
- Radio buttons (right) : users can filter the data by channel (Voice, Live Chat, SMS, Email).
- Hover : users can hover over the chart line to see the exact data for each channel.
Total conversations
This section presents a bar chart showing the total number of answered, unanswered, and transferred conversations for all channels.
- Radio buttons (left) : users can filter the data by channel (Voice, Live Chat, SMS, Email).
- Radio buttons (right) : users can filter the data by conversation outcome (Answered, Unanswered, Transferred).
- Hover : users can hover over the bars to see the exact data for each channel.
The “Answered conversations by channel” chart is a powerful tool for visually analyzing various aspects of conversations, allowing managers to identify trends, make informed decisions and implement strategies to improve customer service and efficiency.
Absolutely, here is user-friendly documentation for the “Conversations answered by external channel” chart:
Conversations answered by channel Graph exdull
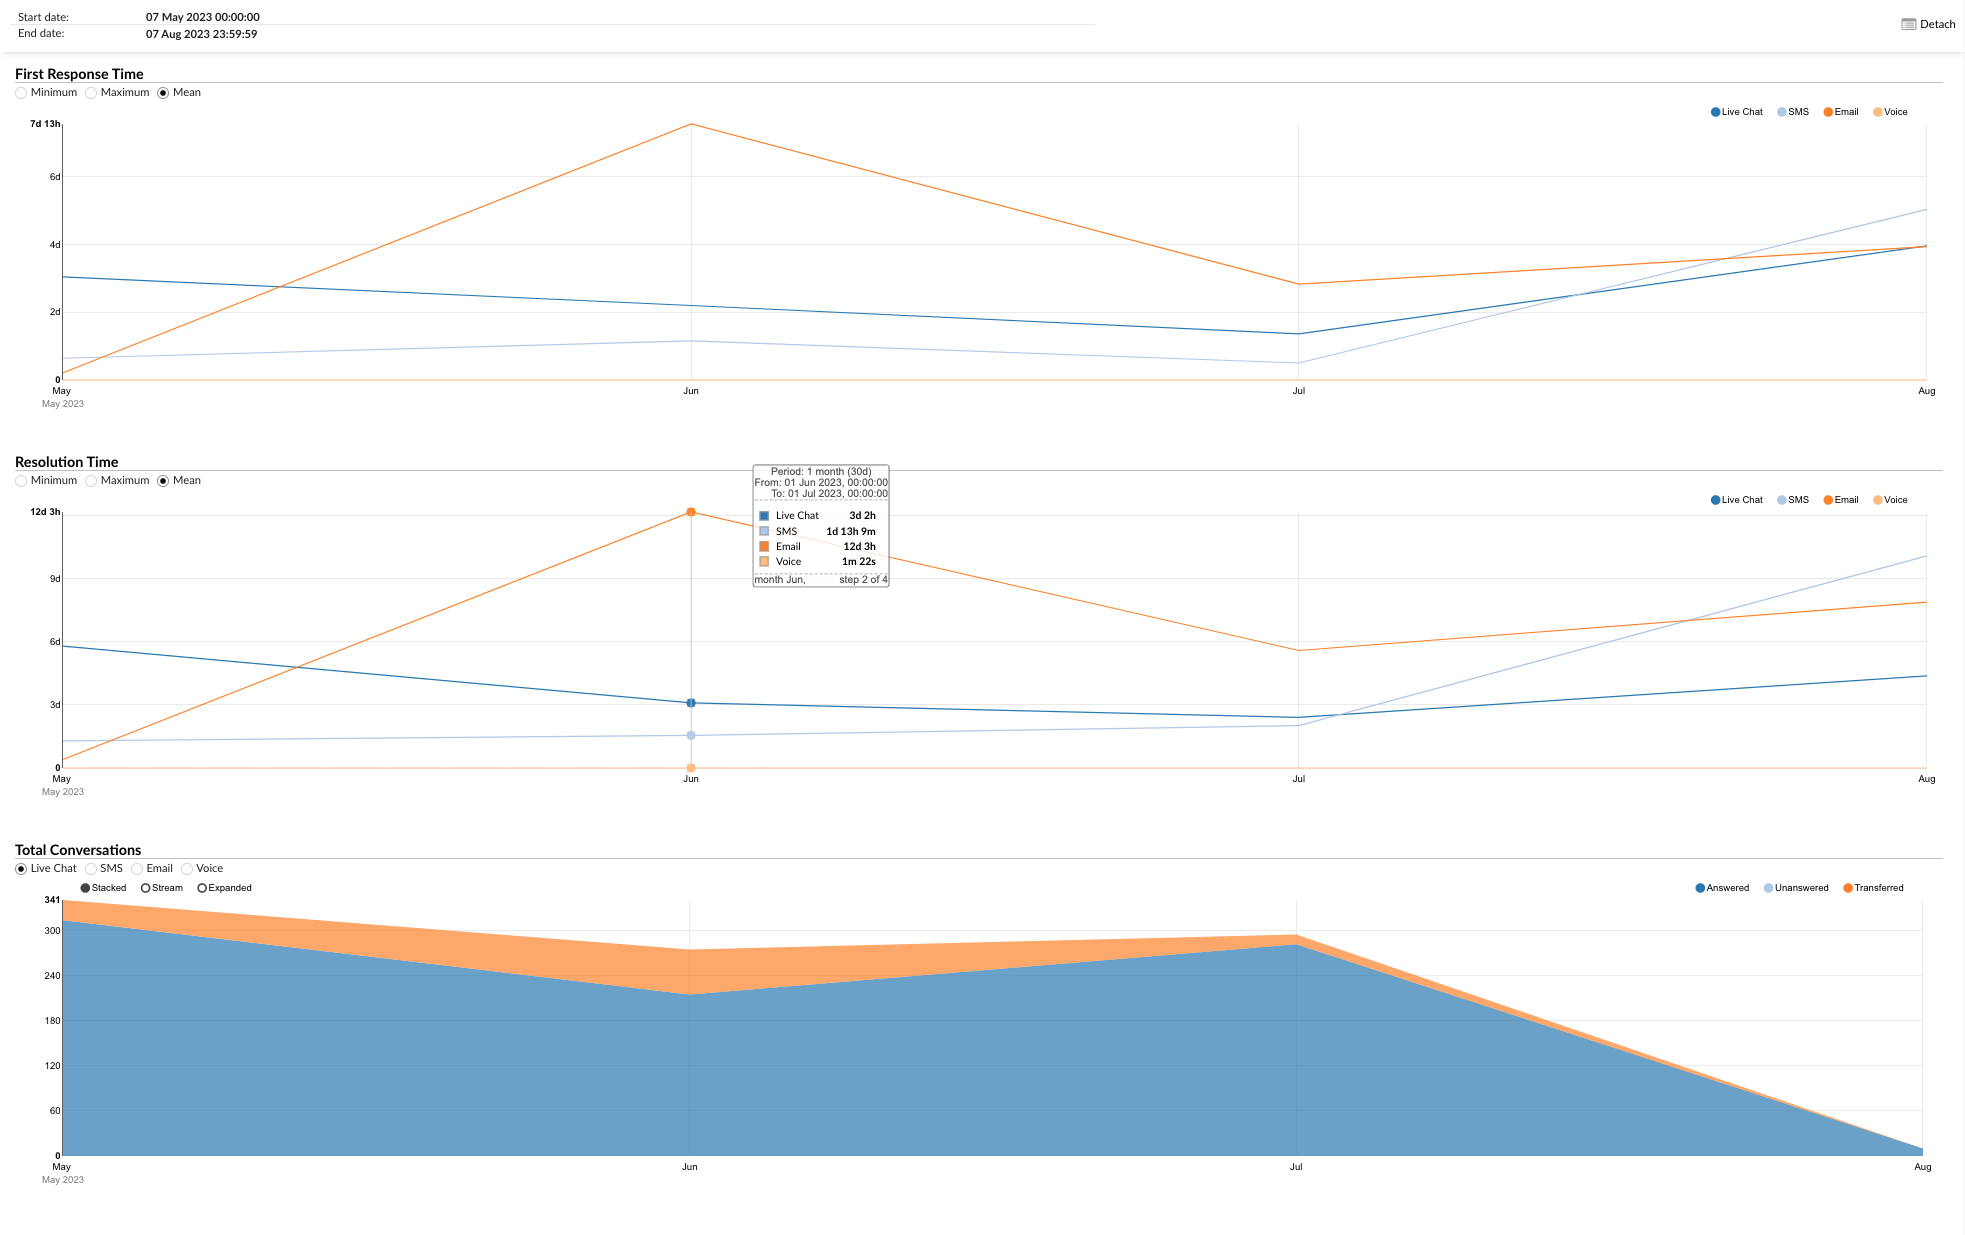
The “Answered conversations by external channel” chart provides a visual representation of various aspects of all answered conversations handled across different communication channels. The chart is divided into three sections, each focusing on a specific aspect of the conversations.
First response time
This section allows users to track the first response times of conversations for each channel over a specified period.
- Radio buttons (left) : users can choose between “Minimum”, “Maximum”, and “Average” to display the corresponding data for the first response time.
- Radio buttons (right) : users can filter the data by channel (Voice, Live Chat, SMS, Email).
- Hover : users can hover over the chart line to see the exact data for each channel.
Resolution time
This section gives an overview of the resolution times of conversations across different channels.
- Radio buttons (left) : users can choose between “Minimum”, “Maximum”, and “Average” to display the corresponding data for the resolution time.
- Radio buttons (right) : users can filter the data by channel (Voice, Live Chat, SMS, Email).
- Hover : users can hover over the chart line to see the exact data for each channel.
Total conversations
This section presents a bar chart showing the total number of answered, unanswered, and transferred conversations for all channels.
- Radio buttons (left) : users can filter the data by channel (Voice, Live Chat, SMS, Email).
- Radio buttons (right) : users can filter the data by conversation outcome (Answered, Unanswered, Transferred).
- Hover : users can hover over the bars to see the exact data for each channel.
The “Answered conversations by external channel” chart is a powerful tool for visually analyzing various aspects of conversations, allowing managers to identify trends, make informed decisions and implement strategies to improve customer service and efficiency.
Answered conversations by queue
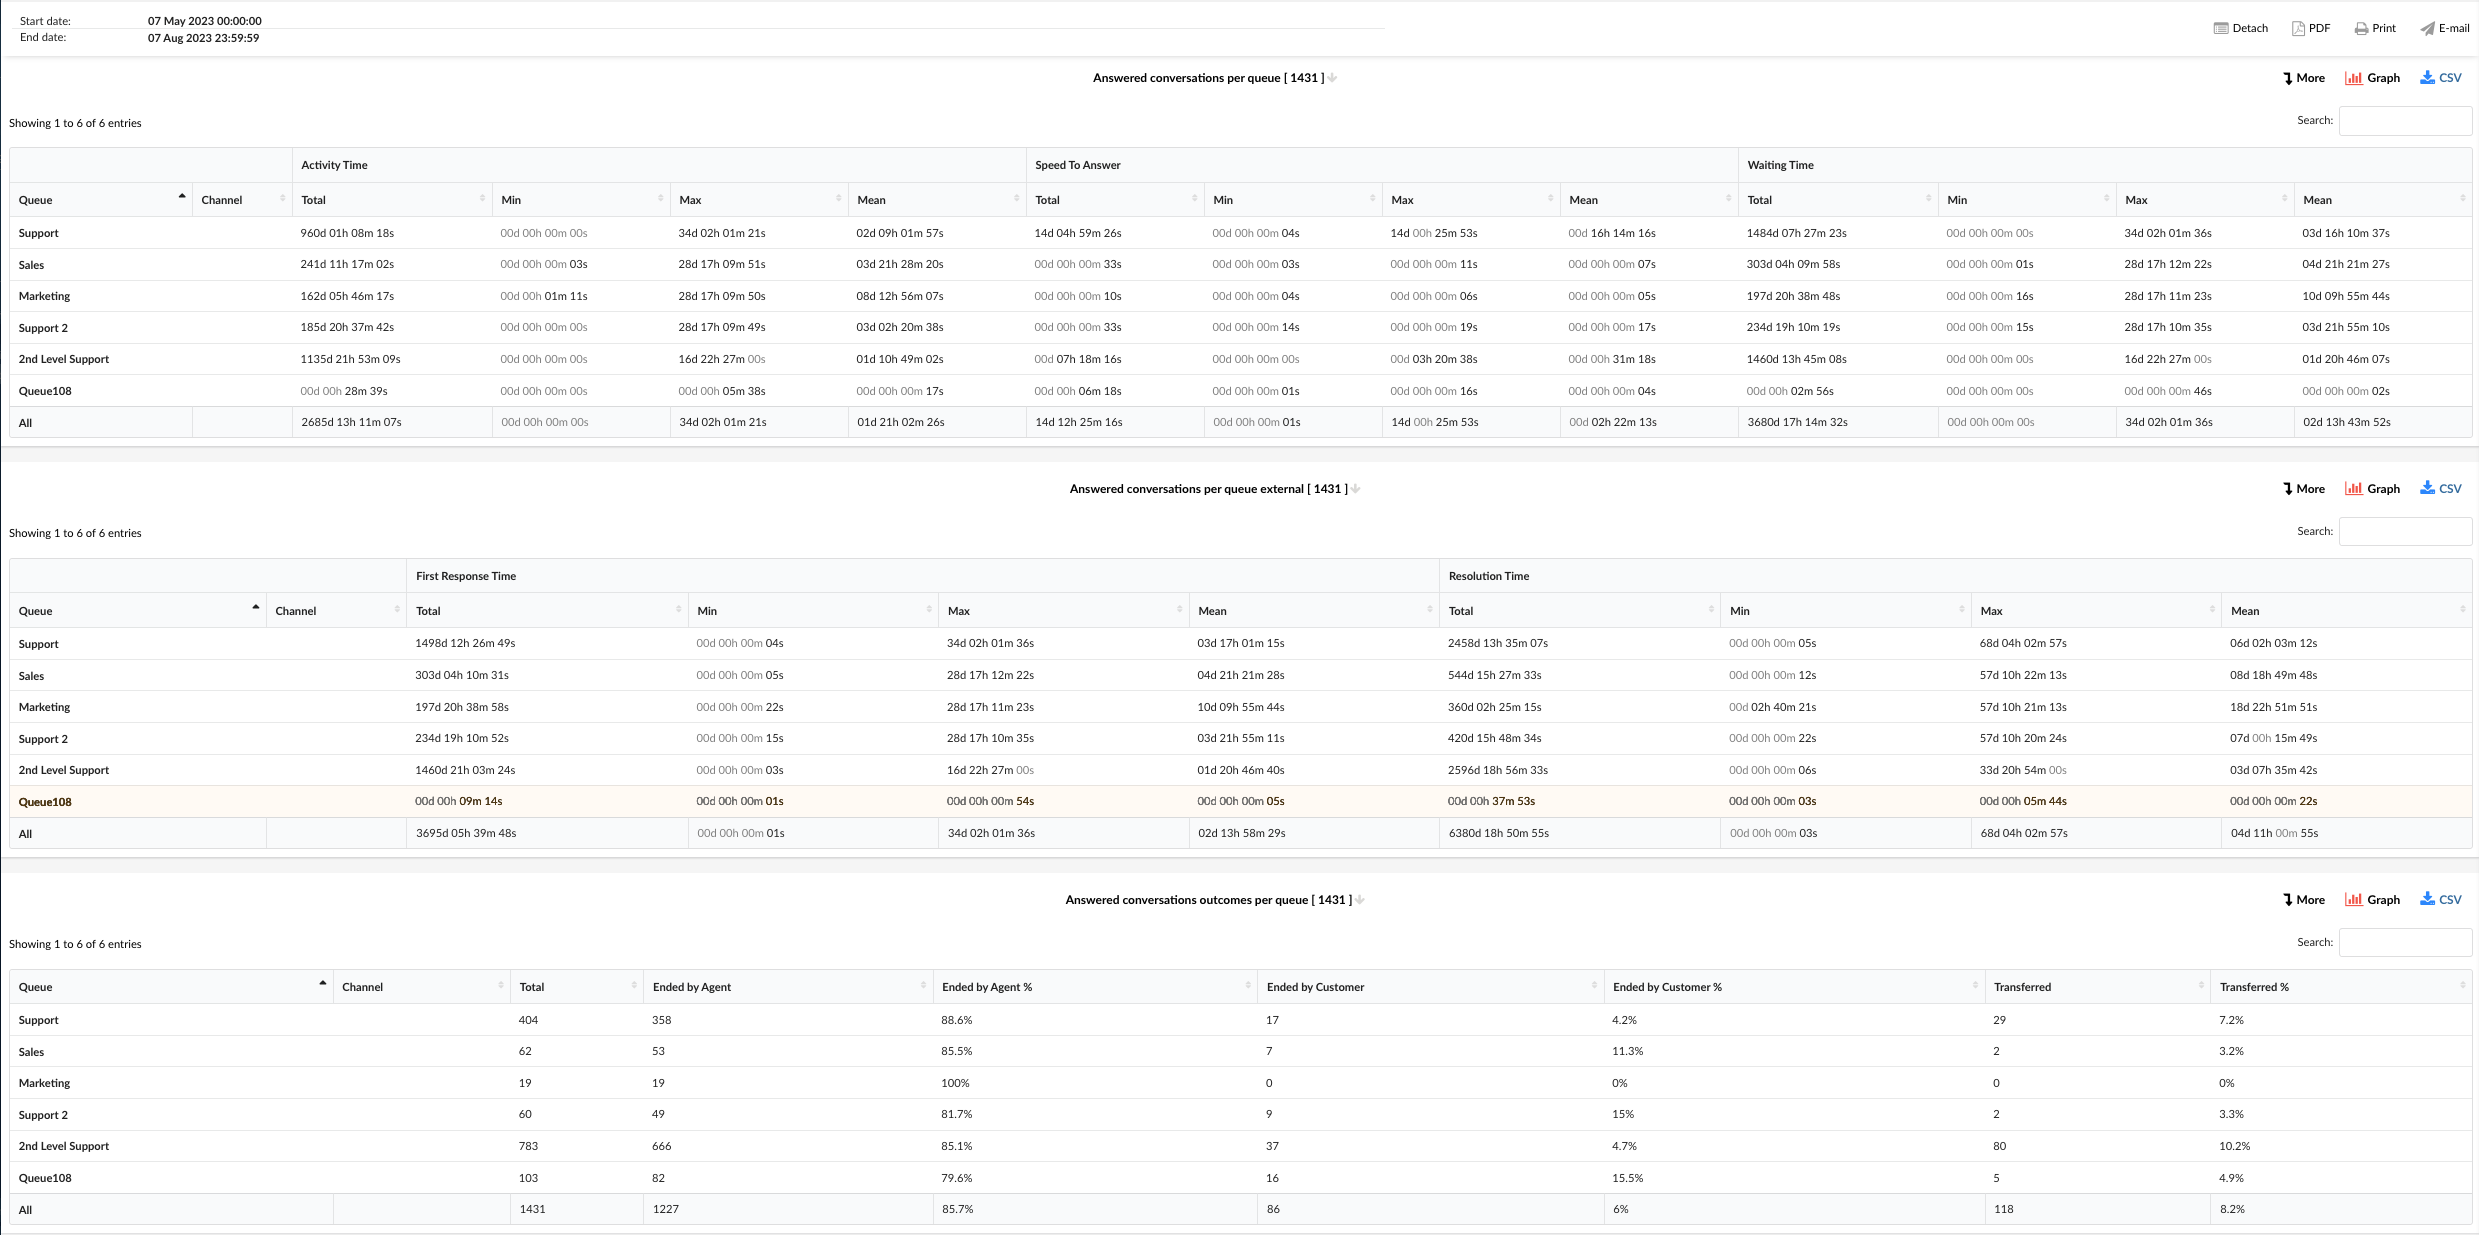
The “Answered conversations by queue” statistics provide a comprehensive overview of all answered conversations across the different queues. The statistics are divided into three tables, each focusing on a specific aspect of the answered conversations.
Answered conversations by queue
This table provides a detailed breakdown of the active time, response speed, and wait time of answered conversations for each queue.
Queue : This column lists the queues. Each queue represents a category of issues or requests handled by your customer service team.
Channel : This column indicates the communication channel used for each conversation. The channels can include chat, email, or messaging, and this column helps you understand which channels are most commonly used in each queue.
Uptime : this column provides a detailed breakdown of the time spent on each conversation in a queue. It includes:
- Total : The sum of the duration of all conversations in the queue.
- Min : the shortest conversation duration in the queue.
- Max : the longest conversation duration in the queue.
- Average : The average duration of conversations in the queue.
Answer speed : this column provides information about how quickly the agents of each queue answer conversations. It includes:
- Total : the sum of all response times in the queue.
- Min : The shortest response time in the queue.
- Max : The longest response time in the queue.
- Average : The average response time in the queue.
Wait time : this column provides information about the waiting duration of conversations in each queue before an agent answers. It includes:
- Total : The sum of all wait times in the queue.
- Min : The shortest wait time in the queue.
- Max : The longest wait time in the queue.
- Average : The average wait time in the queue.
Answered conversations by external queue
This table provides a detailed breakdown of the first response time and resolution time of answered conversations for each queue.
Queue : This column lists the queues. Each queue represents a category of issues or requests handled by your customer service team.
Channel : This column indicates the communication channel used for each conversation. The channels can include chat, email, or messaging, and this column helps you understand which channels are most commonly used in each queue.
First response time : this column provides information about how quickly the agents of each queue provide the first response to conversations. It includes:
- Total : the sum of all first response times in the queue.
- Min : The shortest first response time in the queue.
- Max : The longest first response time in the queue.
- Average : the average first response time in the queue.
Resolution time : this column provides information about the time needed to resolve conversations in each queue. It includes:
- Total : the sum of all resolution times in the queue.
- Min : The shortest resolution time in the queue.
- Max : the longest resolution time in the queue.
- Average : The average resolution time in the queue.
Results of answered conversations by queue
This table provides a summary of the outcomes of answered conversations for each queue.
Queue : This column lists the queues. Each queue represents a category of issues or requests handled by your customer service team.
Channel : This column indicates the communication channel used for each conversation. The channels can include chat, email, or messaging, and this column helps you understand which channels are most commonly used in each queue.
Total : this column displays the total number of answered conversations for each queue. This helps you understand the volume of conversations handled by each queue.
Ended by the agent : This column indicates the number and percentage of conversations that were closed by the agent. This helps you understand how often it is the agents who end the conversations in each queue.
Ended by the customer : this column displays the number and percentage of conversations concluded by the customer. This helps you understand how often it is the customers who end the conversations in each queue.
Transferred : this column represents the number and percentage of conversations that were transferred to another agent or another queue. This helps you understand how often conversations in each queue are transferred.
The “Answered conversations by queue” statistics constitute a powerful tool for analyzing agent performance in handling answered conversations, allowing managers to identify trends, make informed decisions and implement strategies to improve customer service and efficiency.
Answered conversations by queue distribution
The "Answered conversations by queue breakdown" statistics table provides detailed information about each answered conversation handled across different communication channels. The table consists of fourteen columns, each offering specific information about the conversations.
Conversation ID : this column lists the unique identifiers of each conversation.
Date : This column indicates the date on which each conversation took place.
Channel : This column indicates the communication channel used for each conversation, such as chat, email, or messaging.
Client : This column lists the customers involved in each conversation.
Queue : This column displays the queue in which each conversation was handled.
Assignee : This column lists the agent assigned to each conversation.
Uptime : this column displays the total time that the agent spent on each conversation.
Answer speed : This column represents the time taken by the agent to answer each conversation.
Wait time : This column shows how much time each conversation spent waiting in the queue before receiving an answer.
Input : This column indicates the time at which each conversation entered the queue.
Output : this column indicates the time at which each conversation left the queue.
Transferred : This column indicates whether each conversation was transferred to another agent or another queue.
Last action by : this column indicates who performed the last action in the conversation, whether it was the agent or the customer.
Completed : This column indicates how each conversation ended.
Using the "Answered conversations by queue breakdown" statistics table, managers can gain a granular understanding of each conversation, identify patterns in answered interactions and implement strategies to improve agent performance and customer service.
Chart of answered conversations by queue
The “Answered conversations by queue” chart provides a visual representation of answered conversations across different queues. The chart is divided into four sections, each focusing on a specific aspect of the answered conversations.
Uptime
This chart shows the activity time for each queue. You can filter the chart by minimum, maximum and average activity time using the options on the left. The queues are listed on the right and you can select the queues you want to display on the chart. By hovering over the chart line, you can see the exact activity time data for each queue. This allows you to quickly compare the activity times across different queues and identify the queues that may take longer than others.
Answer speed
This chart shows the response speed for each queue. Similar to the Activity Time chart, you can filter the chart by minimum, maximum and average speed to answer using the options on the left. The queues are listed on the right and you can select the queues you want to display on the chart. By hovering over the chart lines, you can see the exact speed to answer data for each queue. This helps you understand how quickly the agents of each queue respond to conversations.
Wait time
This chart shows the wait time for each queue. You can filter the chart by minimum, maximum and average wait time using the options on the left. The queues are listed on the right and you can select the queues you want to display on the chart. By hovering over the chart lines, you can see the exact wait time data for each queue. This allows you to identify the queues in which customers may wait longer than others.
Total active time, response speed, and wait time per queue
This chart shows the total duration of activity, the response speed and the wait time for all queues. The chart is organized so as to have bars for the total activity duration, the total response speed and the total wait time. This provides a comprehensive overview of the overall performance of all queues in terms of activity time, response speed and wait time.
The “Answered conversations by queue” chart is a powerful tool for visually analyzing agent performance in handling answered conversations across different queues. It allows managers to identify trends, make informed decisions and implement strategies to improve customer service and efficiency.
Answered conversations by external queue chart
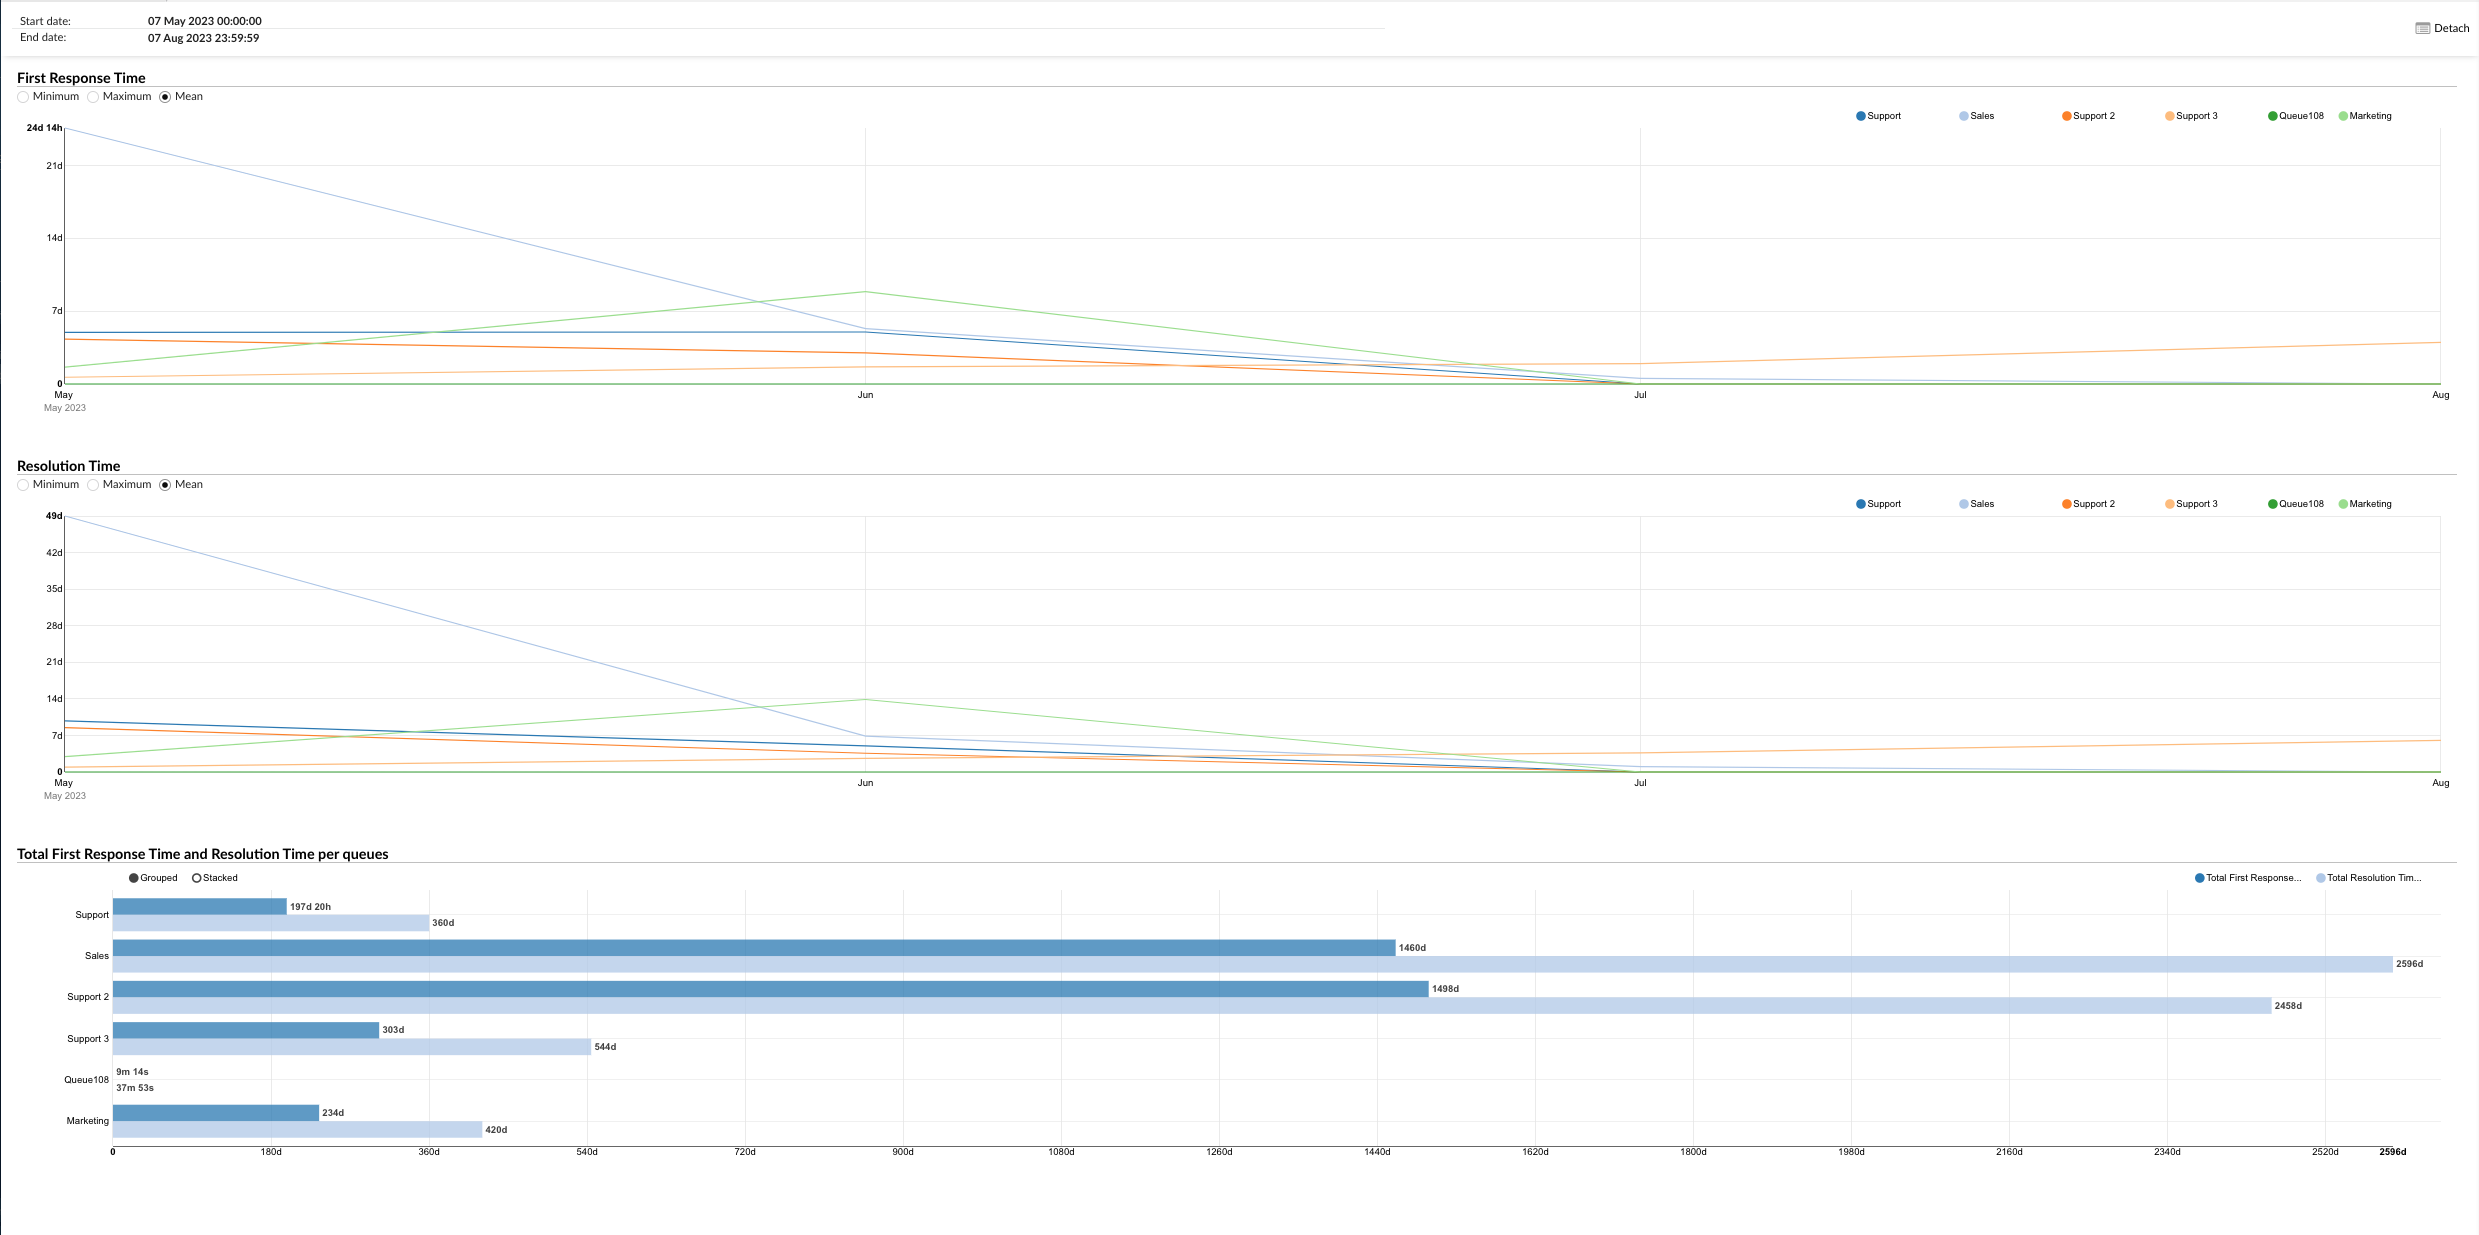
The “Answered conversations by external queue” chart provides a visual representation of the first response time and resolution time for answered conversations across different queues. The chart is divided into three sections, each focusing on a specific aspect of the answered conversations.
First response time
This chart shows the first response time for each queue. You can filter the chart by minimum, maximum and average first response time using the options on the left. The queues are listed on the right and you can select the queues you want to display on the chart. By hovering over the chart line, you can see the exact first response time data for each queue. This allows you to quickly compare the first response times across different queues and identify the queues in which the first response may take longer than others.
Resolution time
This chart shows the resolution time for each queue. Similar to the First Response Time chart, you can filter the chart by minimum, maximum and average resolution time using the options on the left. The queues are listed on the right and you can select the queues you want to display on the chart. By hovering over the chart lines, you can see the exact resolution time data for each queue. This helps you understand how quickly issues are resolved in each queue.
Total first response time and resolution time per queue
This chart shows the total first response time and the resolution time for all queues. The chart is organized so as to have horizontal bars for the total first response time and the total resolution time. You can filter the chart by total first response time and total resolution time using the radio button on the right. This provides a comprehensive overview of the overall performance of all queues in terms of first response time and resolution time.
The “Answered conversations by external queue” chart is a powerful tool for visually analyzing agent performance in handling answered conversations across different queues. It allows managers to identify trends, make informed decisions and implement strategies to improve customer service and efficiency.
Conversations answered by queue pie charts
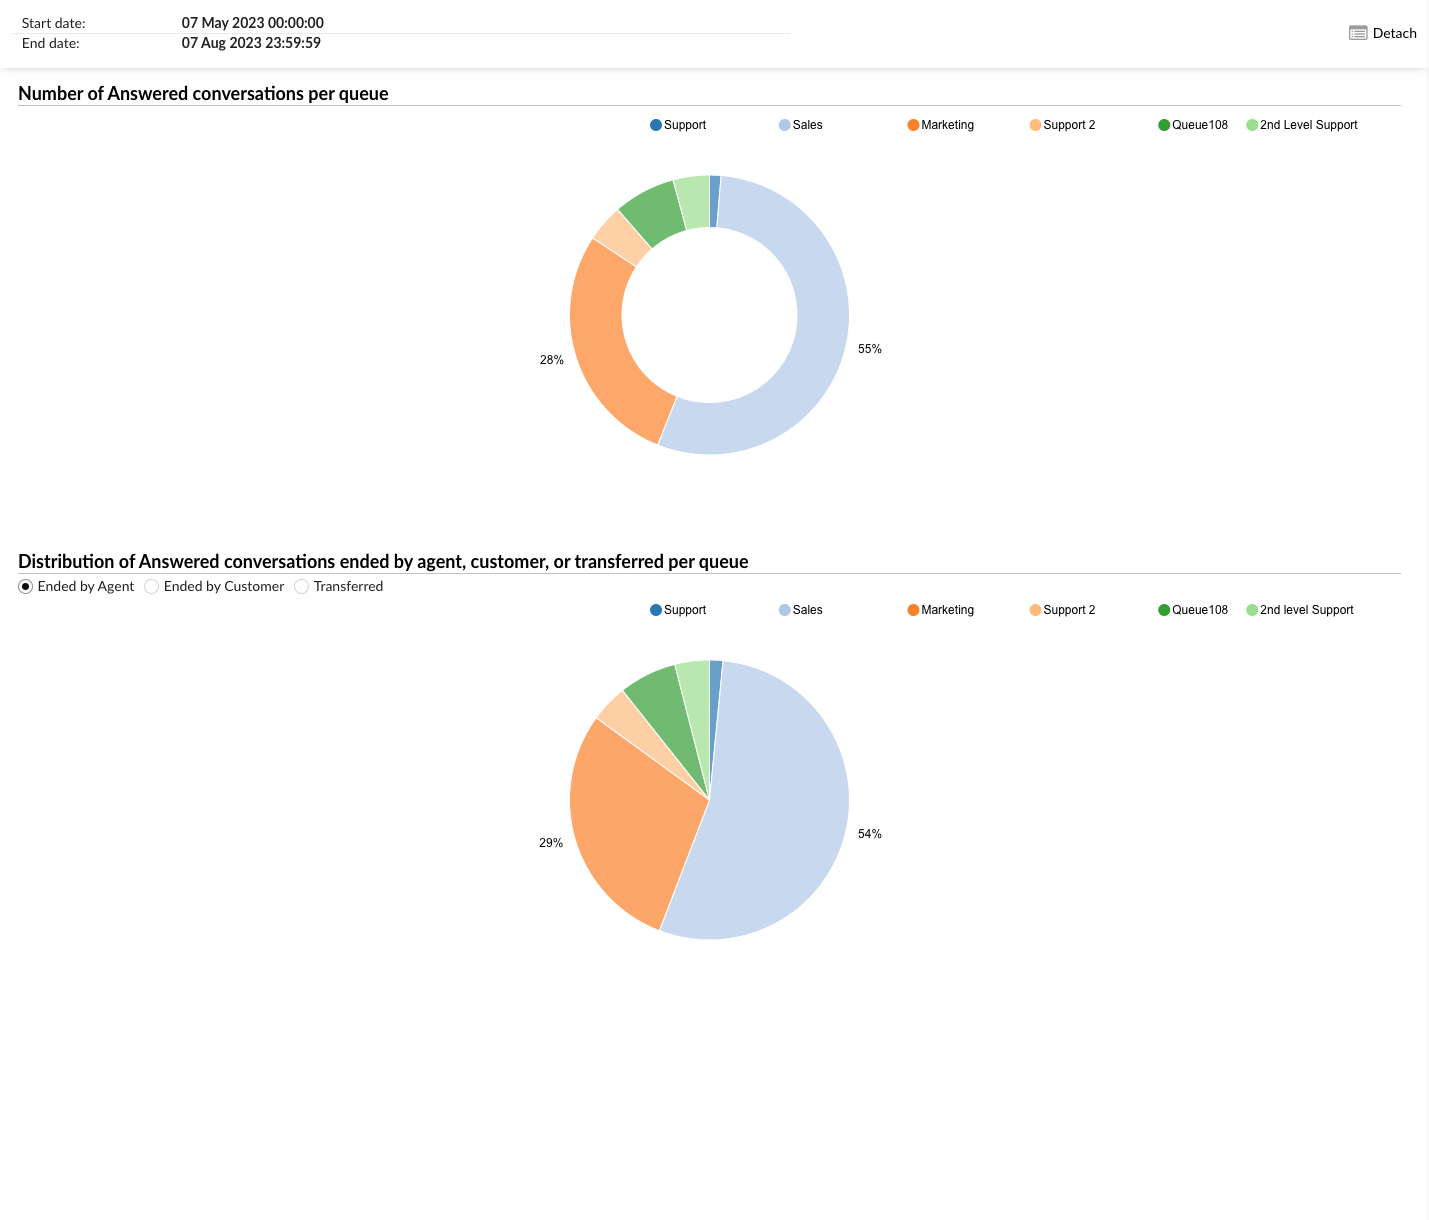
The “Answered Conversations by Queue” section provides two pie charts that offer a visual representation of the distribution of answered conversations across different queues.
Number of answered conversations per queue
The first pie chart shows the number of answered conversations by queue. Each slice of the pie represents a different queue and the size of the slice corresponds to the number of answered conversations in that queue. You can filter the data displayed on the chart by selecting the desired queues from the radio buttons on the right. This allows you to focus on specific queues and compare their performance in terms of answered conversations.
Distribution of answered conversations ended by the agent, the customer, or transferred, by queue
The second pie chart shows the distribution of answered conversations that were ended by an agent, a customer or transferred, by queue. Each slice of the pie represents a different end status (ended by the agent, ended by the customer or transferred) and the size of the slice corresponds to the number of conversations with that end status in the selected queue. You can filter the data displayed on the chart by selecting the desired end status from the radio buttons on the left and the desired queues from the radio buttons on the right. This allows you to analyze the distribution of how conversations are typically concluded in each queue.
These pie charts are a powerful tool for visually analyzing agent performance in handling answered conversations across different queues. They allow managers to identify trends, make informed decisions, and implement strategies to improve customer service and efficiency.
Distributions of conversations by channel
These reports provide valuable information on how customers prefer to interact with the company and on how these preferences may vary over time.
For example, if you analyze the distribution of conversations by channel over a specific period, you may find that customers tend to communicate more frequently via live chat at certain times of day, while email interactions are more evenly distributed throughout the day. This information can help companies allocate resources, such as staffing levels, to better adapt to different communication patterns and ensure timely responses to customers.
All reports contain the following columns, each providing specific information about the conversation:
- Time / Day / Day of the week – displays the distribution of conversations by hour, day, and day of the week.
- Channel : indicates the communication method for each conversation, including voice, chat, email or messaging.
- Total : total number of conversations for the selected period (day, hour, or day of the week).
- Answered – Number of conversations that received an answer within the chosen time interval.
- No answer – Number of conversations that did not receive an answer within the chosen time interval.
- Average time : displayed in five columns, each indicating the average time needed to answer during a specific period of time.
- Total time – Presented in five columns, each showing the cumulative time spent in answers over a specific time period.
Distributions of conversations by channel and by hour
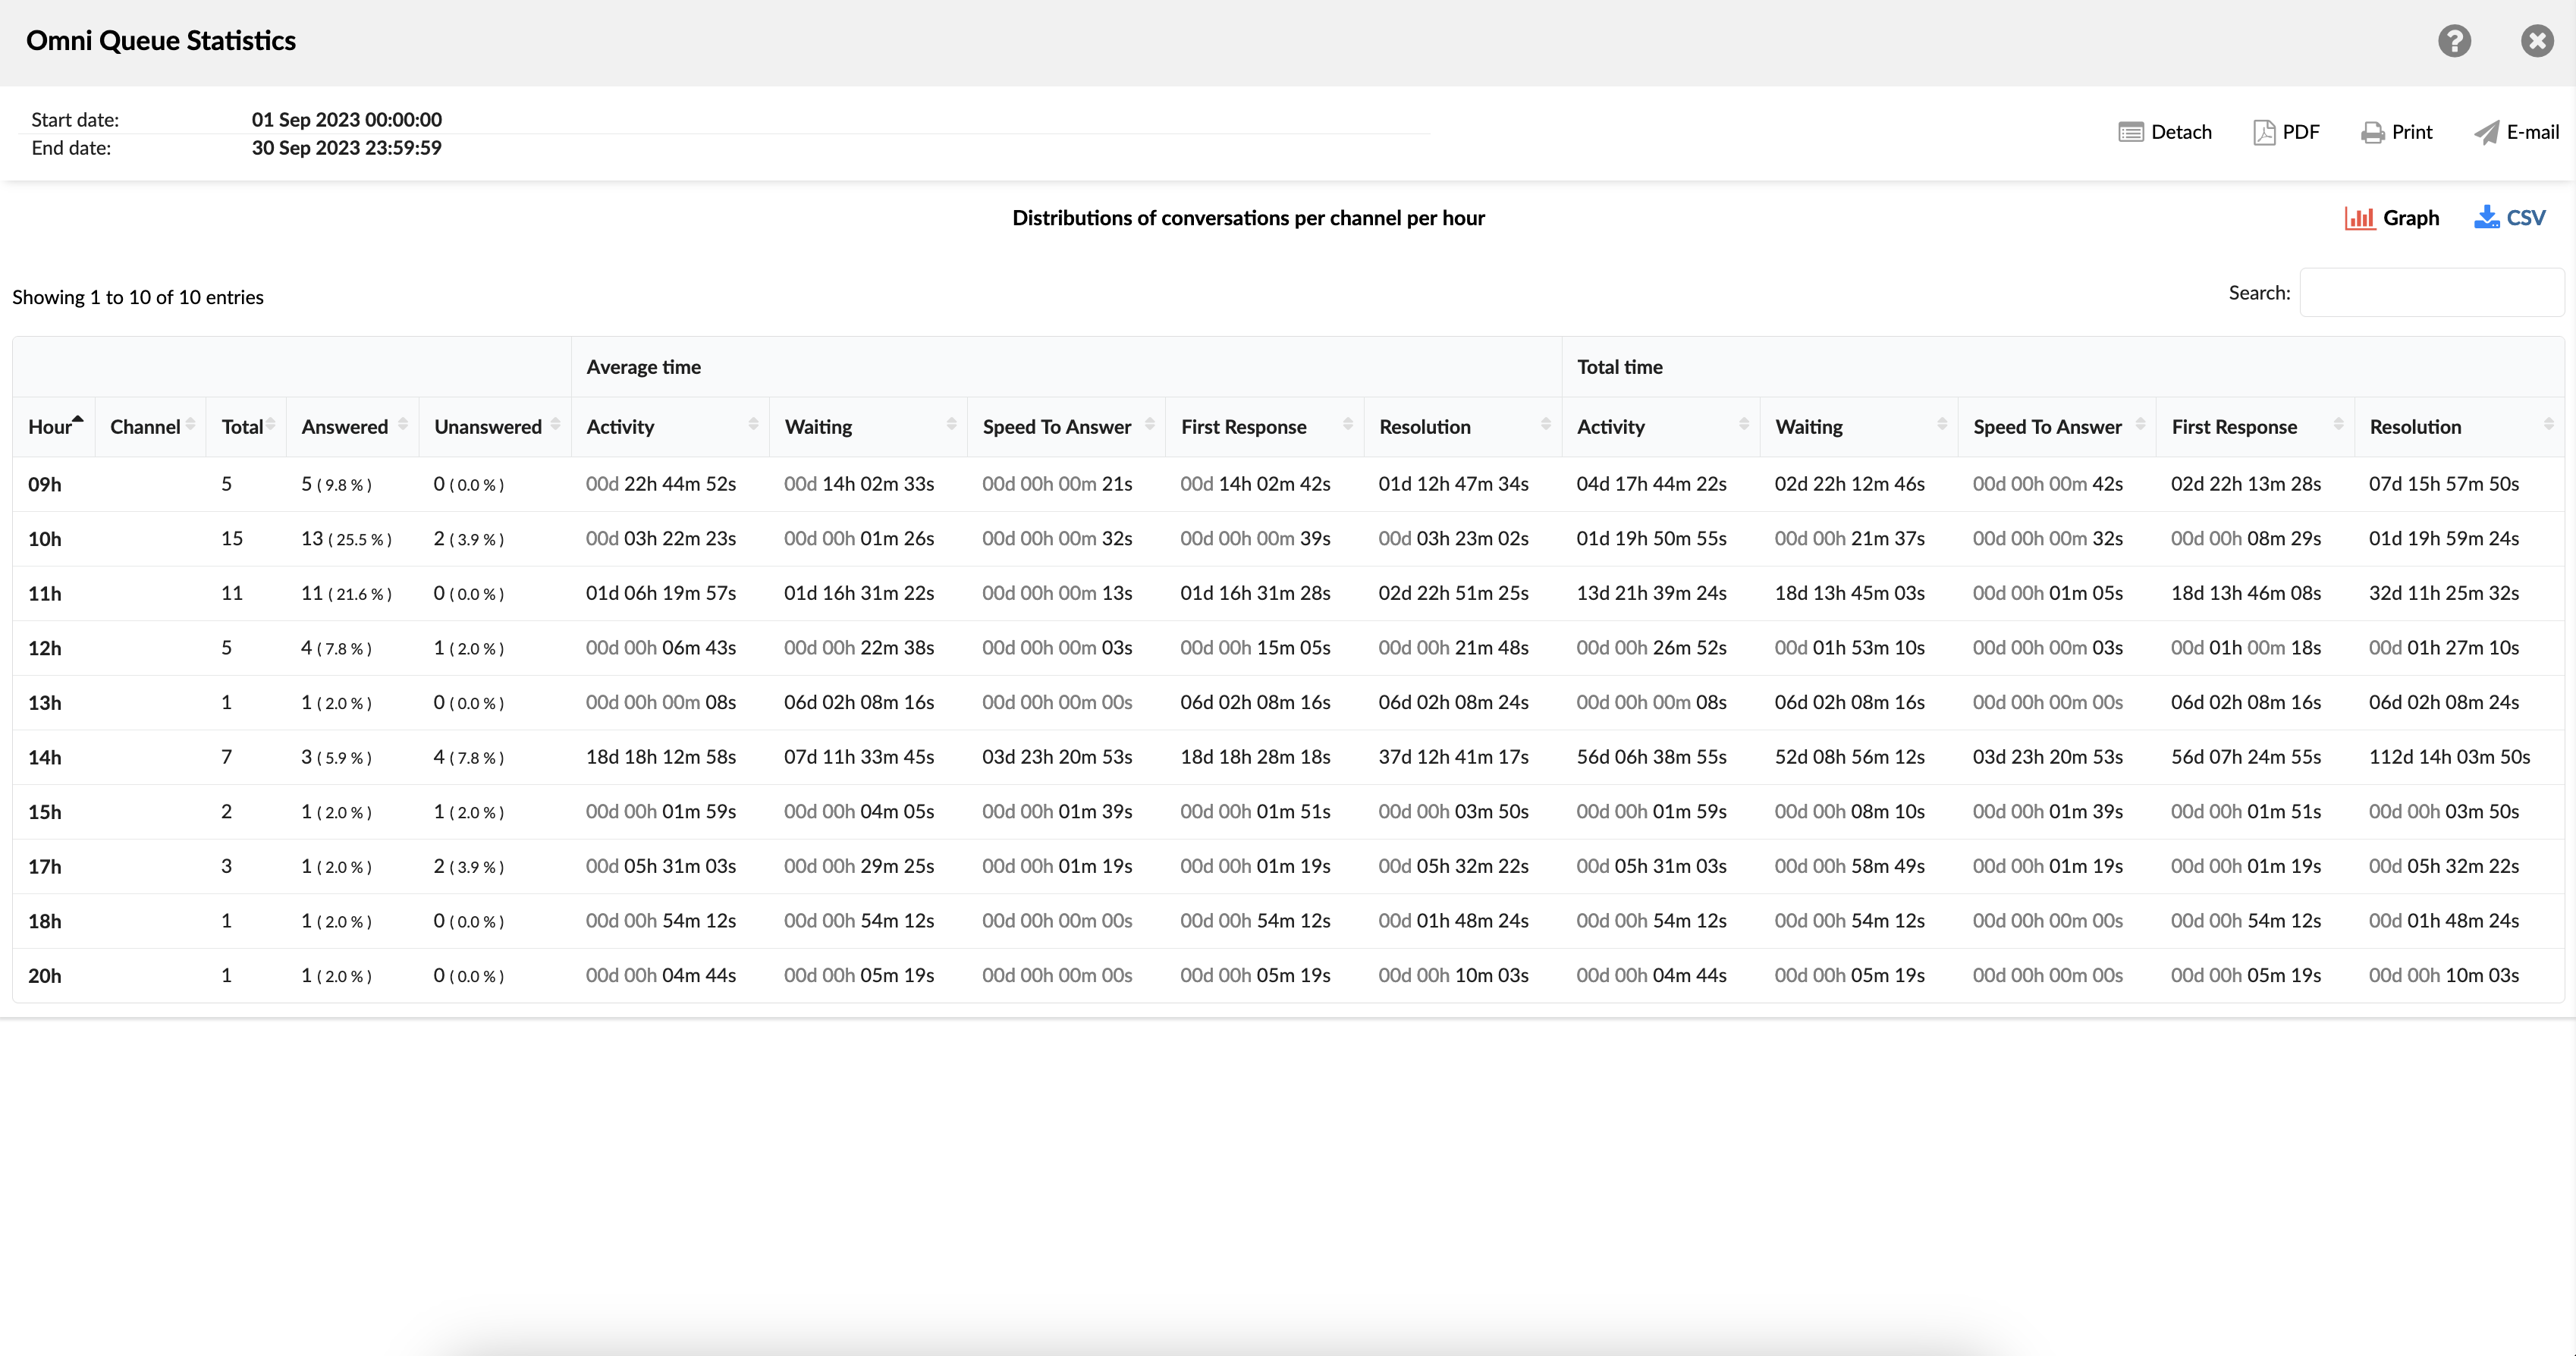
This statistic reveals how conversations are distributed by channel throughout the day, thereby helping to identify peak hours for customer communication. It is a valuable tool for making informed decisions about staffing and resource allocation strategies.
Chart of conversation distribution by channel and by hour
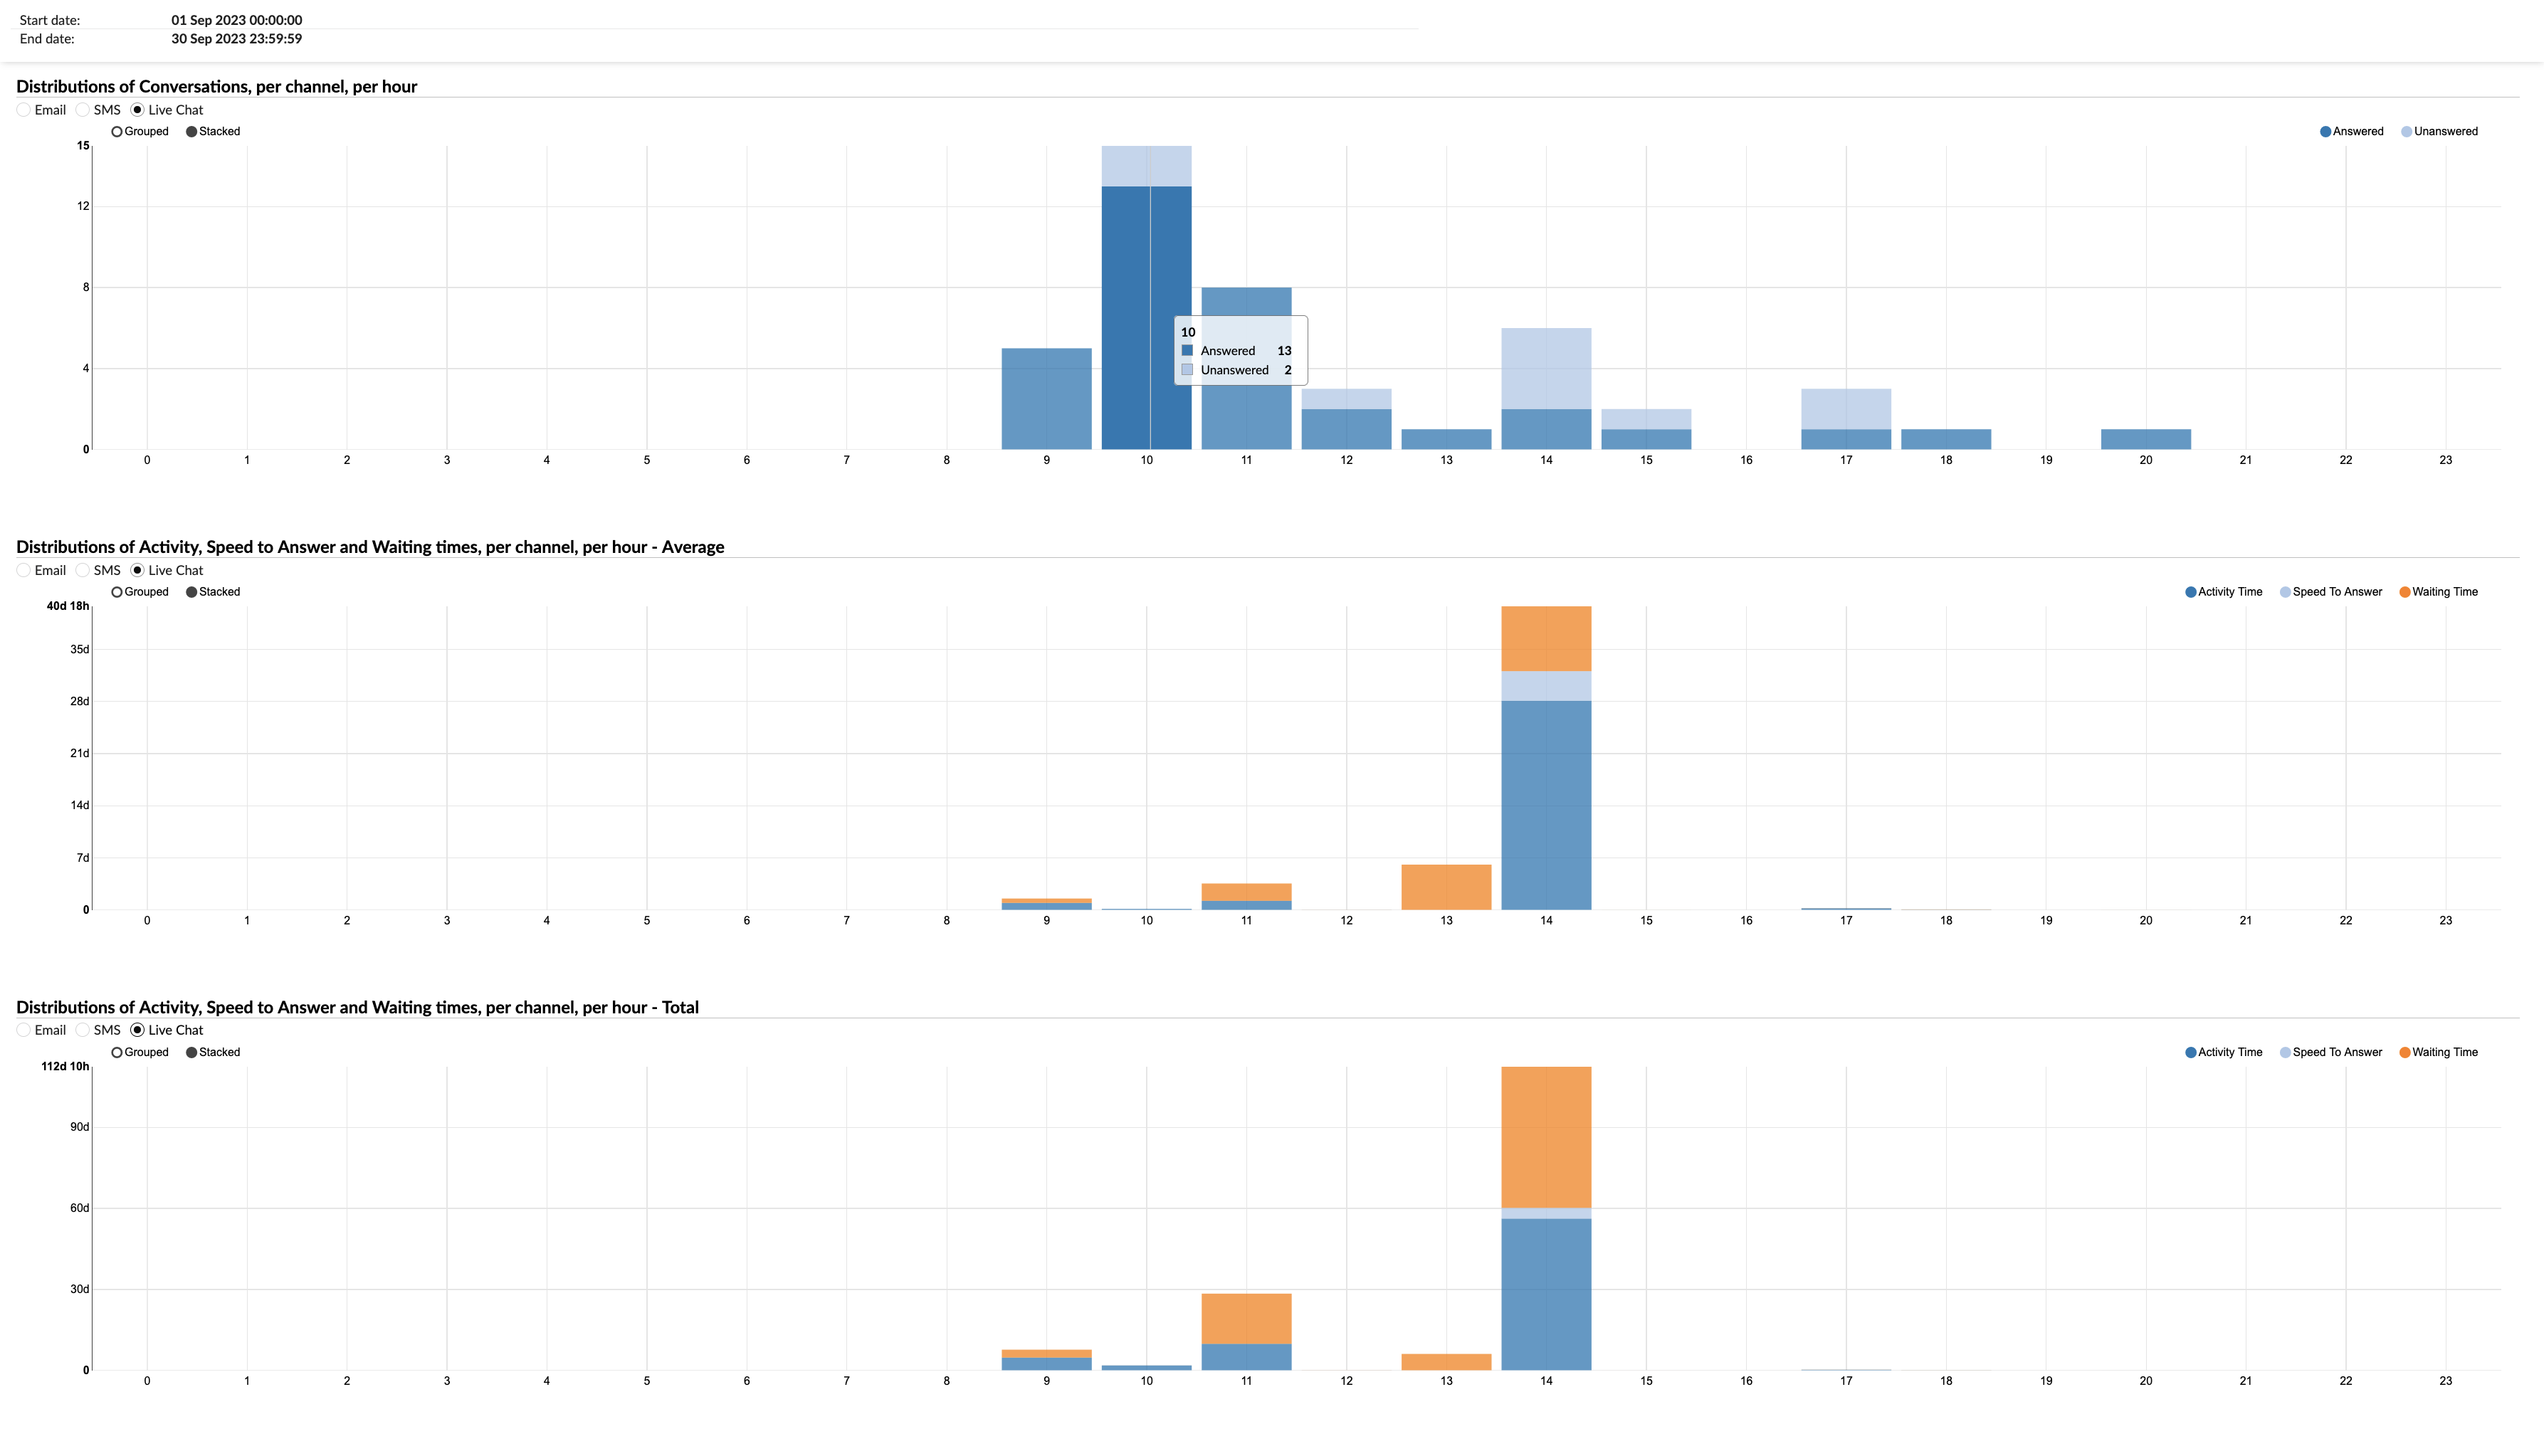
This chart consists of three additional charts. The first shows the breakdowns of conversations by channel and by hour. The second chart shows the average time of activity distribution, response speed and wait times per channel and per hour. And the third, in the same way as the second, displays the total time of activity distribution, response speed and wait times per channel and per hour.
Distributions of conversations by channel and by day
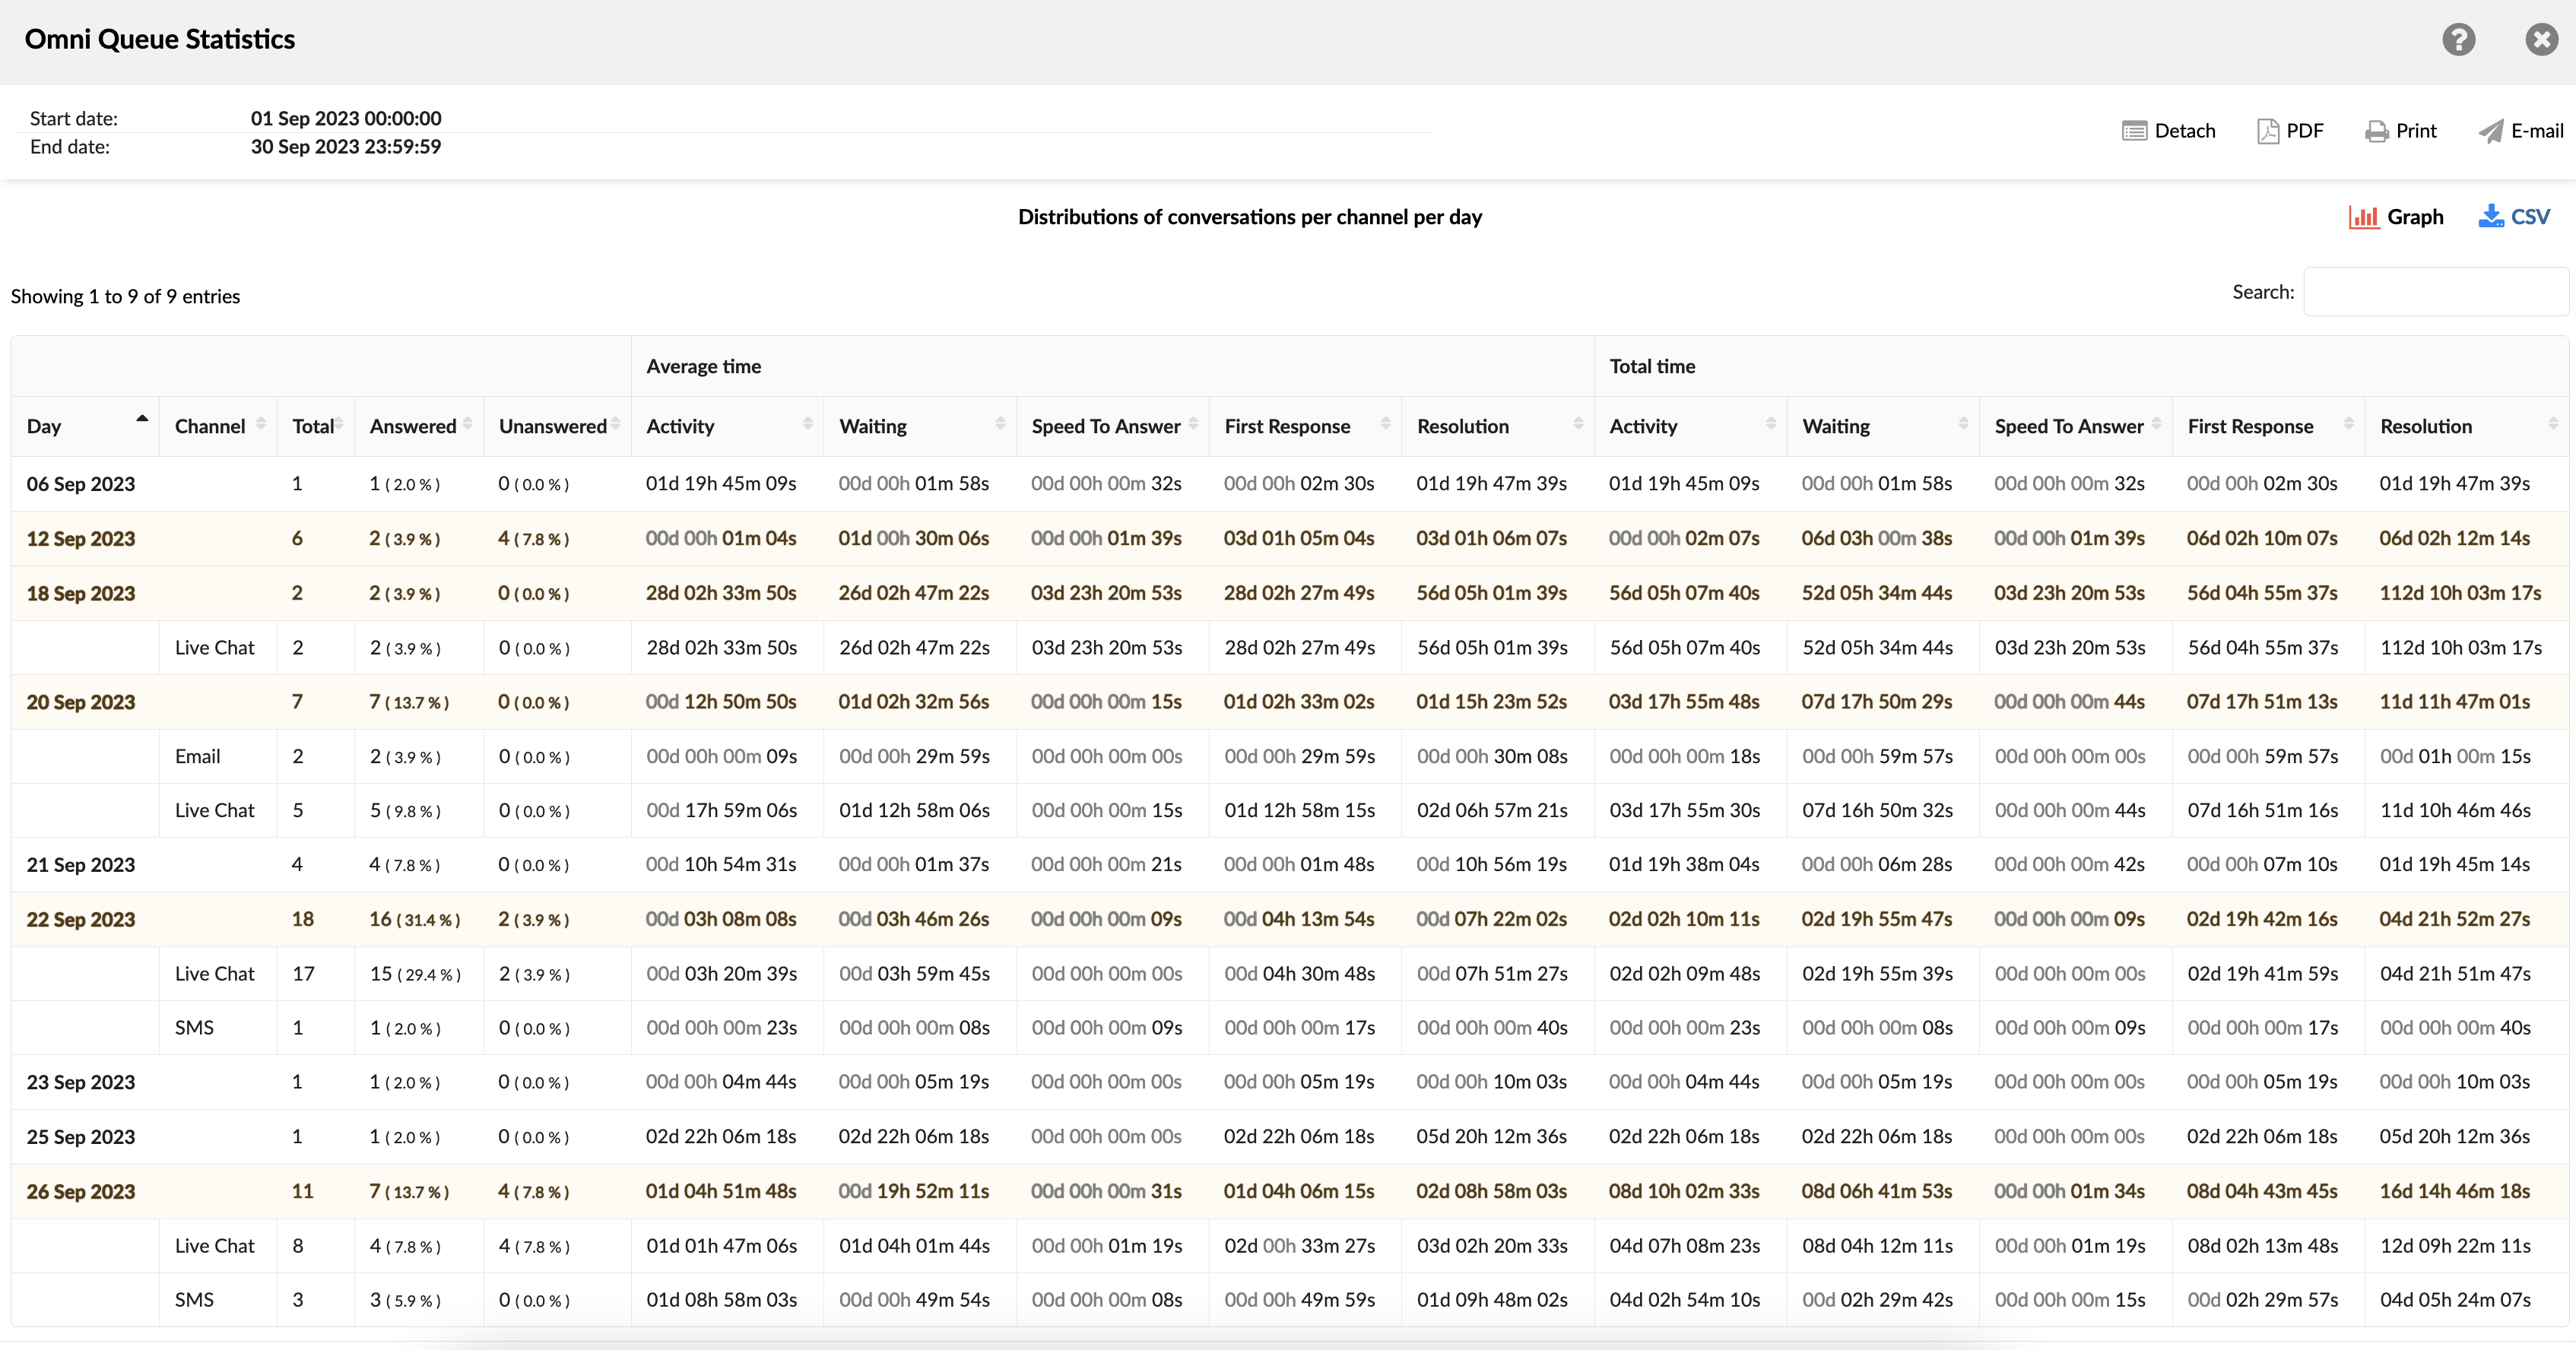
This statistic presents the daily distribution of conversations by channel, allowing users to detect patterns and trends in customer communication volume over time. It is particularly useful for tracking the dynamics of customer interactions.
Chart of conversation distribution by channel and by day
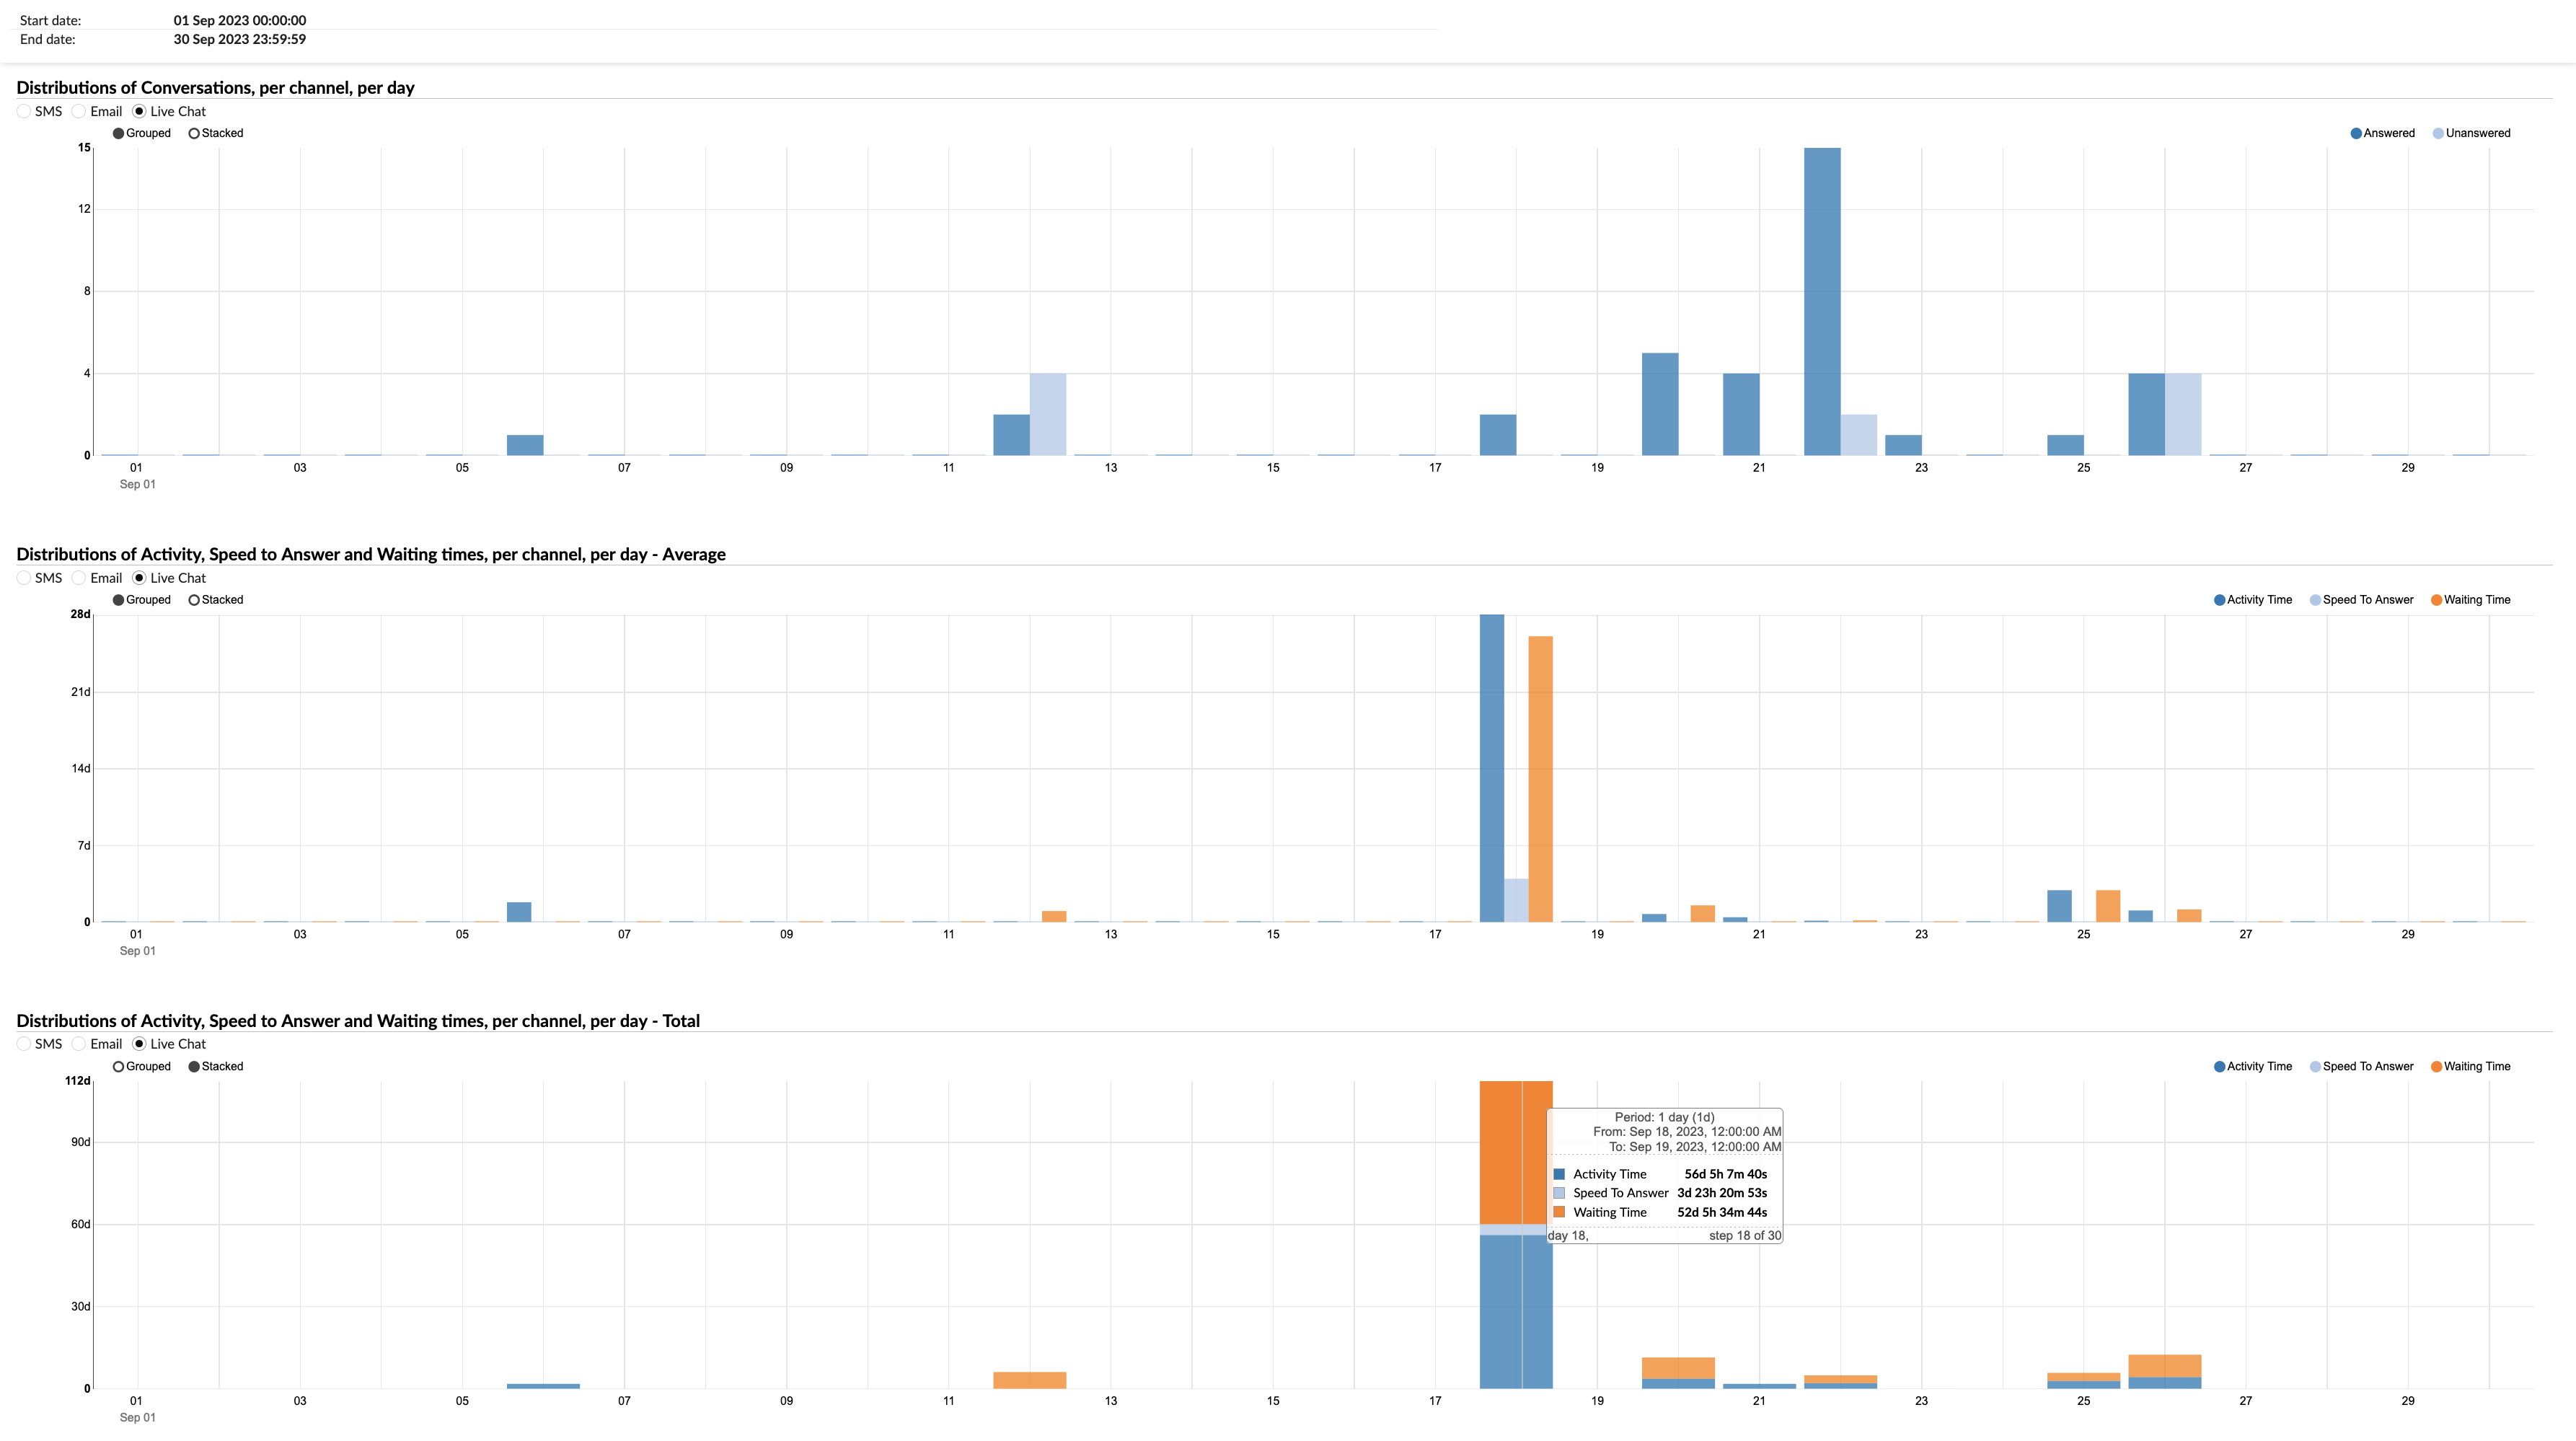
This combined chart contains three additional segments. The initial segment illustrates the daily breakdowns of conversations by channel. The second element presents a chart showing the average duration of activity distribution, response speed and wait times per channel and per day. The third segment reflects the second, displaying the cumulative time for activity distribution, response speed and wait times per channel and per day.
Distributions of conversations by channel and by day of the week
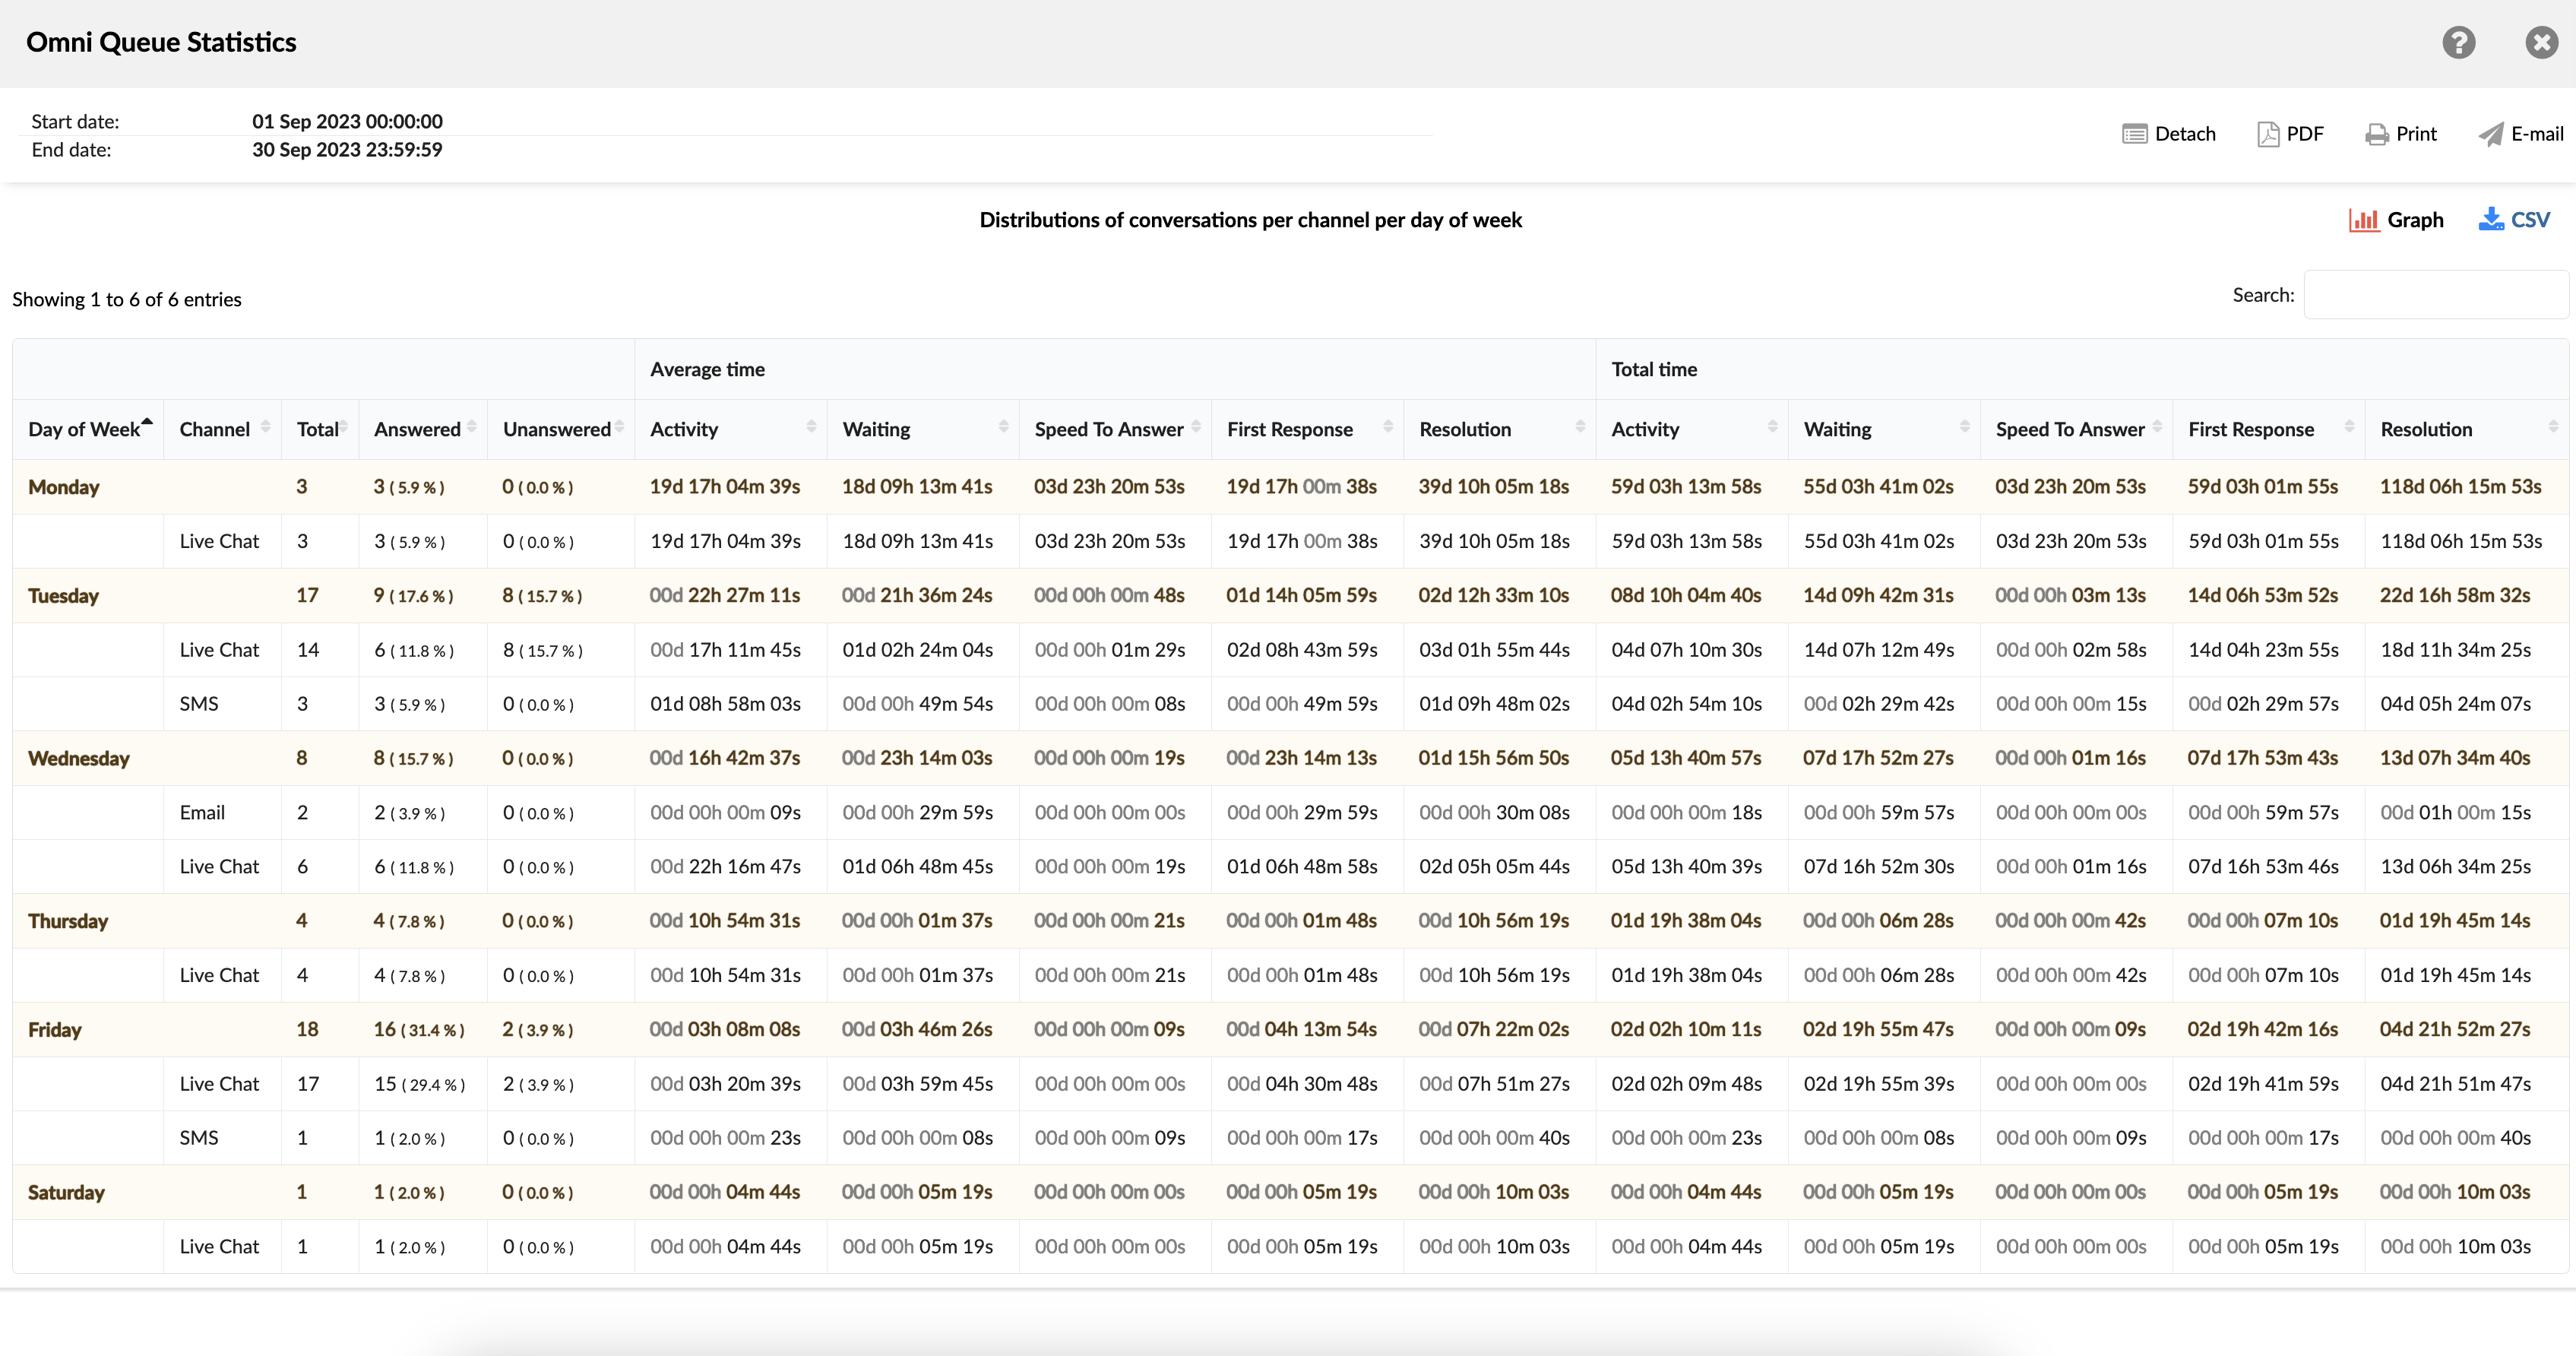
This metric presents the distribution of conversations by channel across several days of the week, providing an overview of peak days for customer communication. This information supports strategic analysis and planning of resource allocation.
Chart of conversation distribution by channel and by day of the week
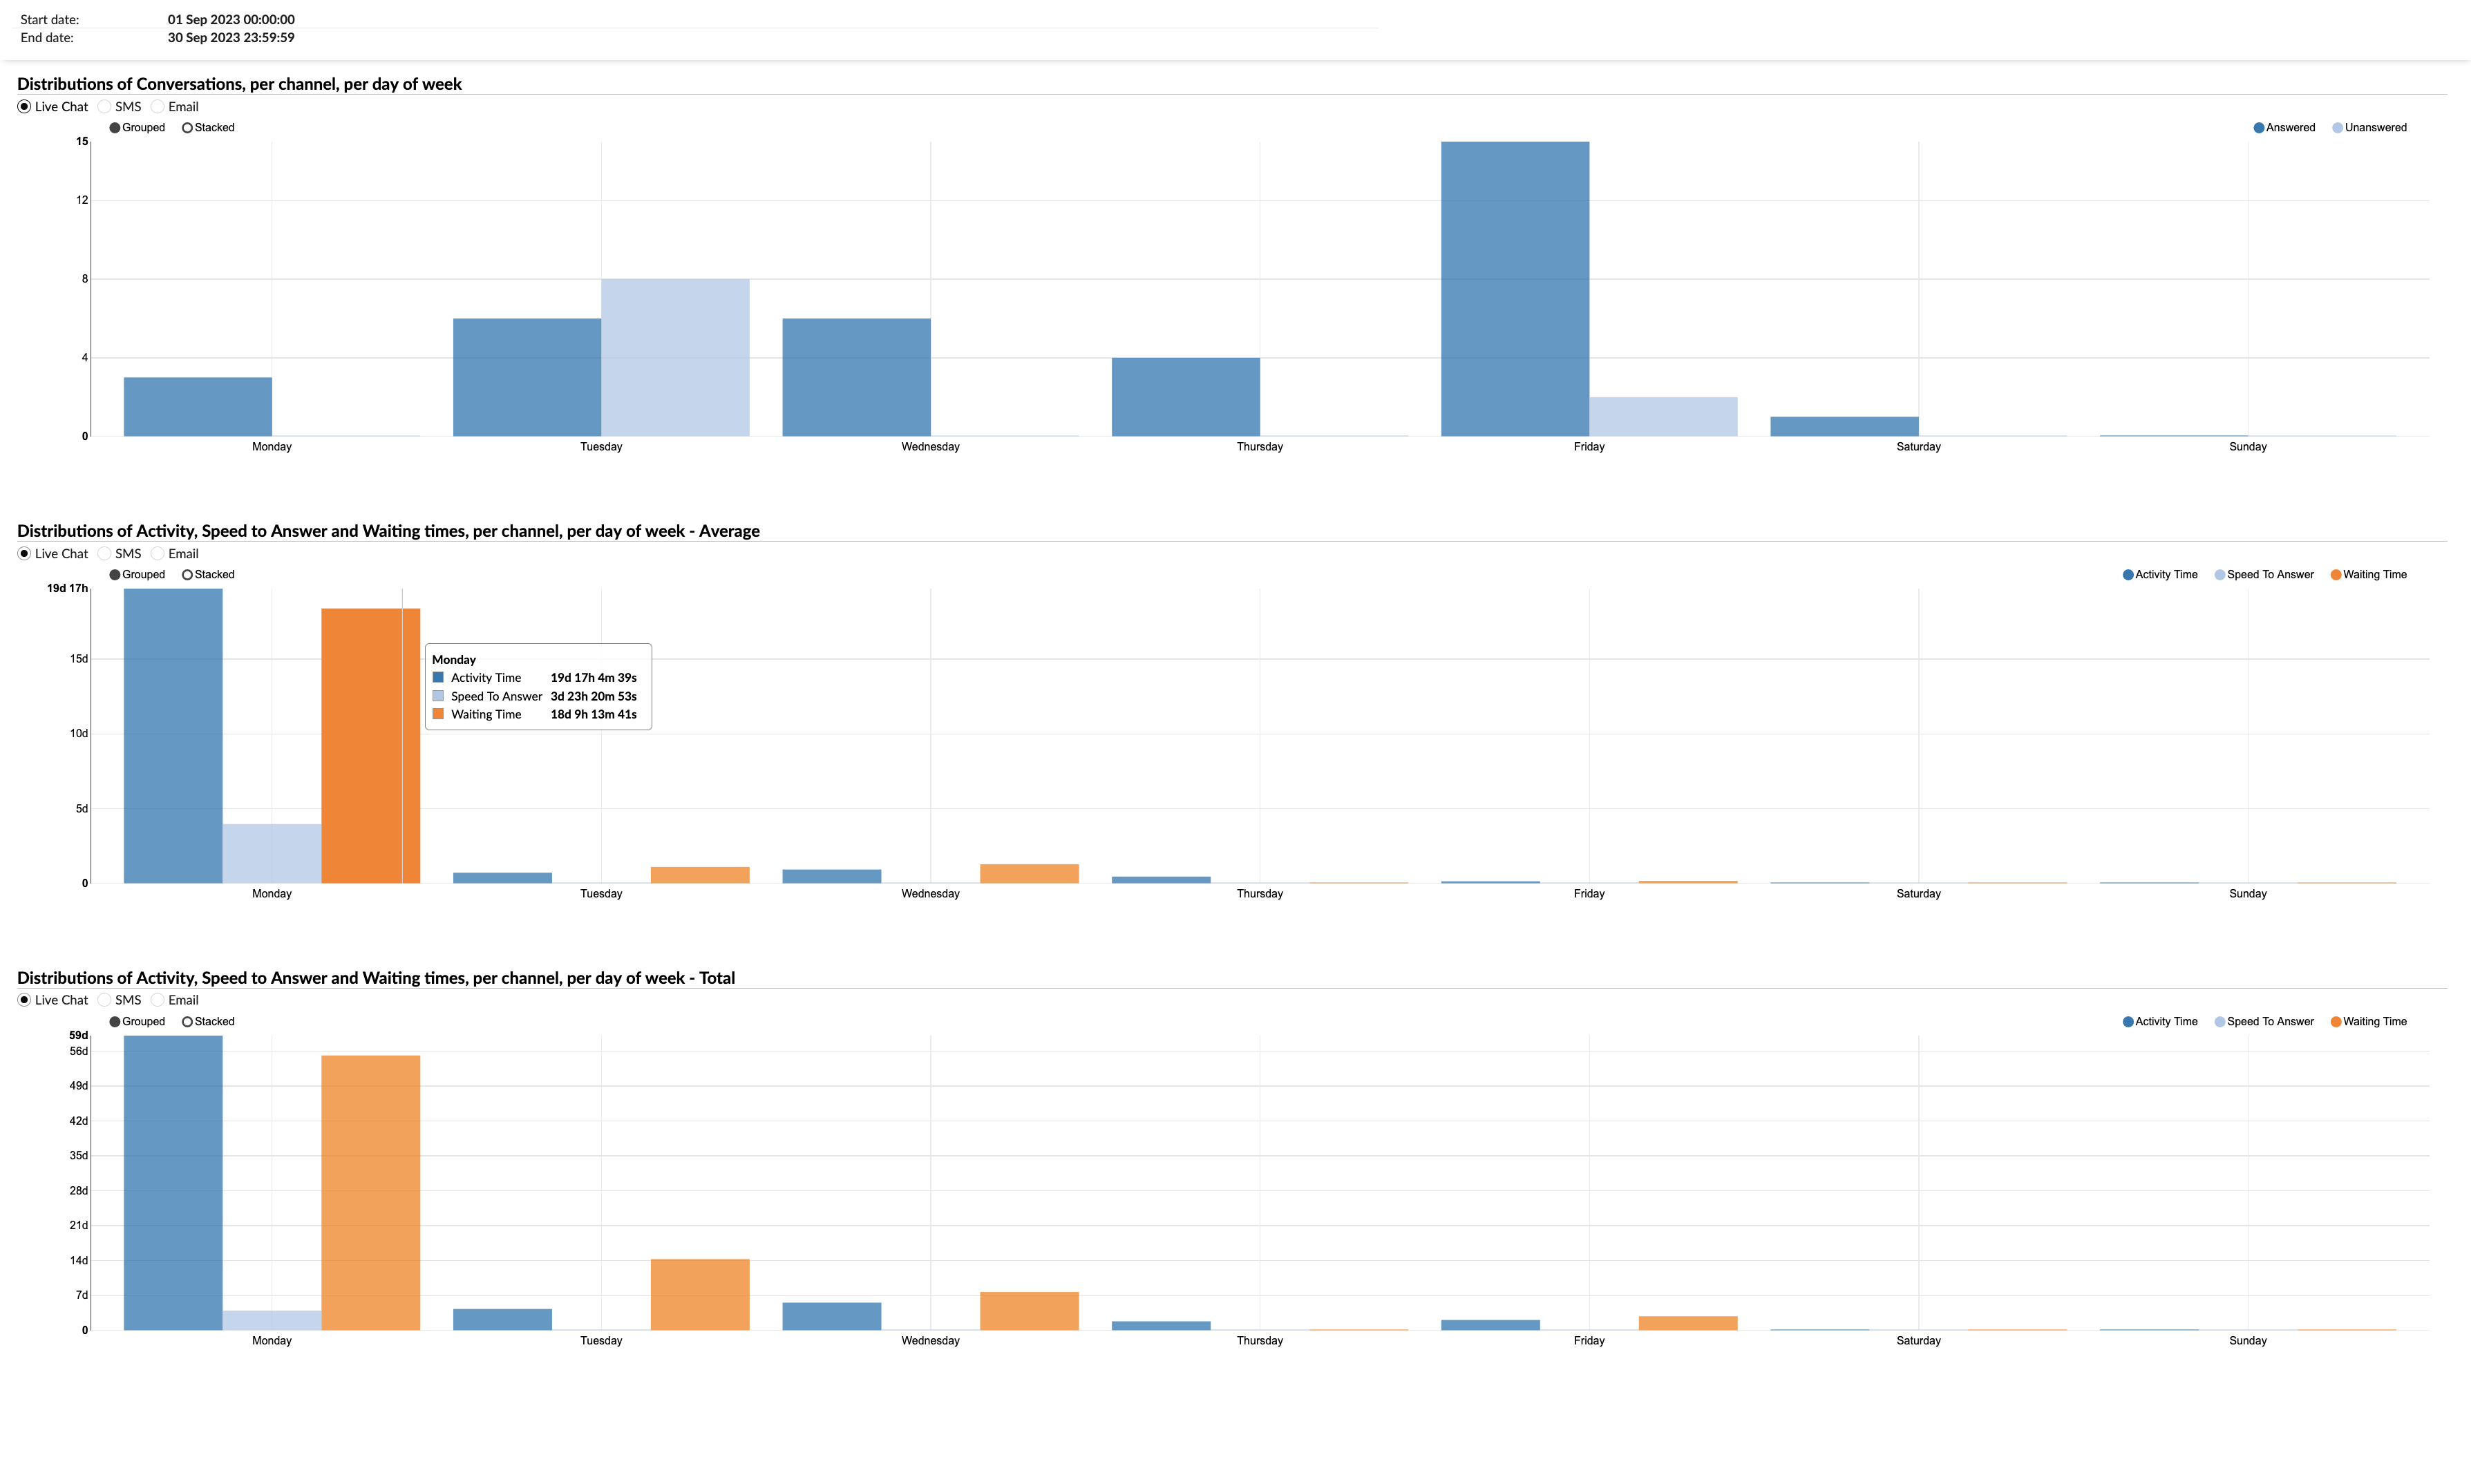
This chart is made up of three additional sections. The first section presents the breakdowns of conversations by channel for each day of the week. The second section illustrates the average duration of activity distribution, response speed and wait times per channel, classified by day of the week. Correspondingly, the third section reflects the second, displaying the cumulative time for activity distribution, response speed and wait times per channel, also segmented by day of the week.
Distributions of conversations by queue
“Conversation distribution by queue” reports involve analyzing customer interactions within a company based on designated queues. This analytical process helps users understand how customer requests or inquiries are dispersed across specialized areas.
For example, consider a company that manages queues for various functions such as technical support, billing inquiries, product information, and general customer service. By examining the distribution of conversations by queue, the company can identify areas or queues experiencing high interaction levels. This information allows staff or additional resources to be strategically allocated to meet increased demand during peak periods.
All reports contain the following columns, each providing specific information about the conversation:
- Time/Day/Day of the week : displays the distribution of conversations over the hours, days, and days of the week by queue.
- Queue – This column presents the names of all the queues where the conversations were distributed.
- Total : represents the total number of conversations per queue during the chosen period (daily, hourly, or by day of the week).
- Answered : indicates the number of conversations per queue that received answers during the chosen time interval.
- No answer : indicates the number of conversations per queue that have not yet received an answer within the chosen time interval.
- Average time – Presented in five columns, each reflecting the average response time over a specific period.
- Total time – Presented in five columns, each reflecting the cumulative response time over a specific period.
Distributions of conversations by queue and by hour
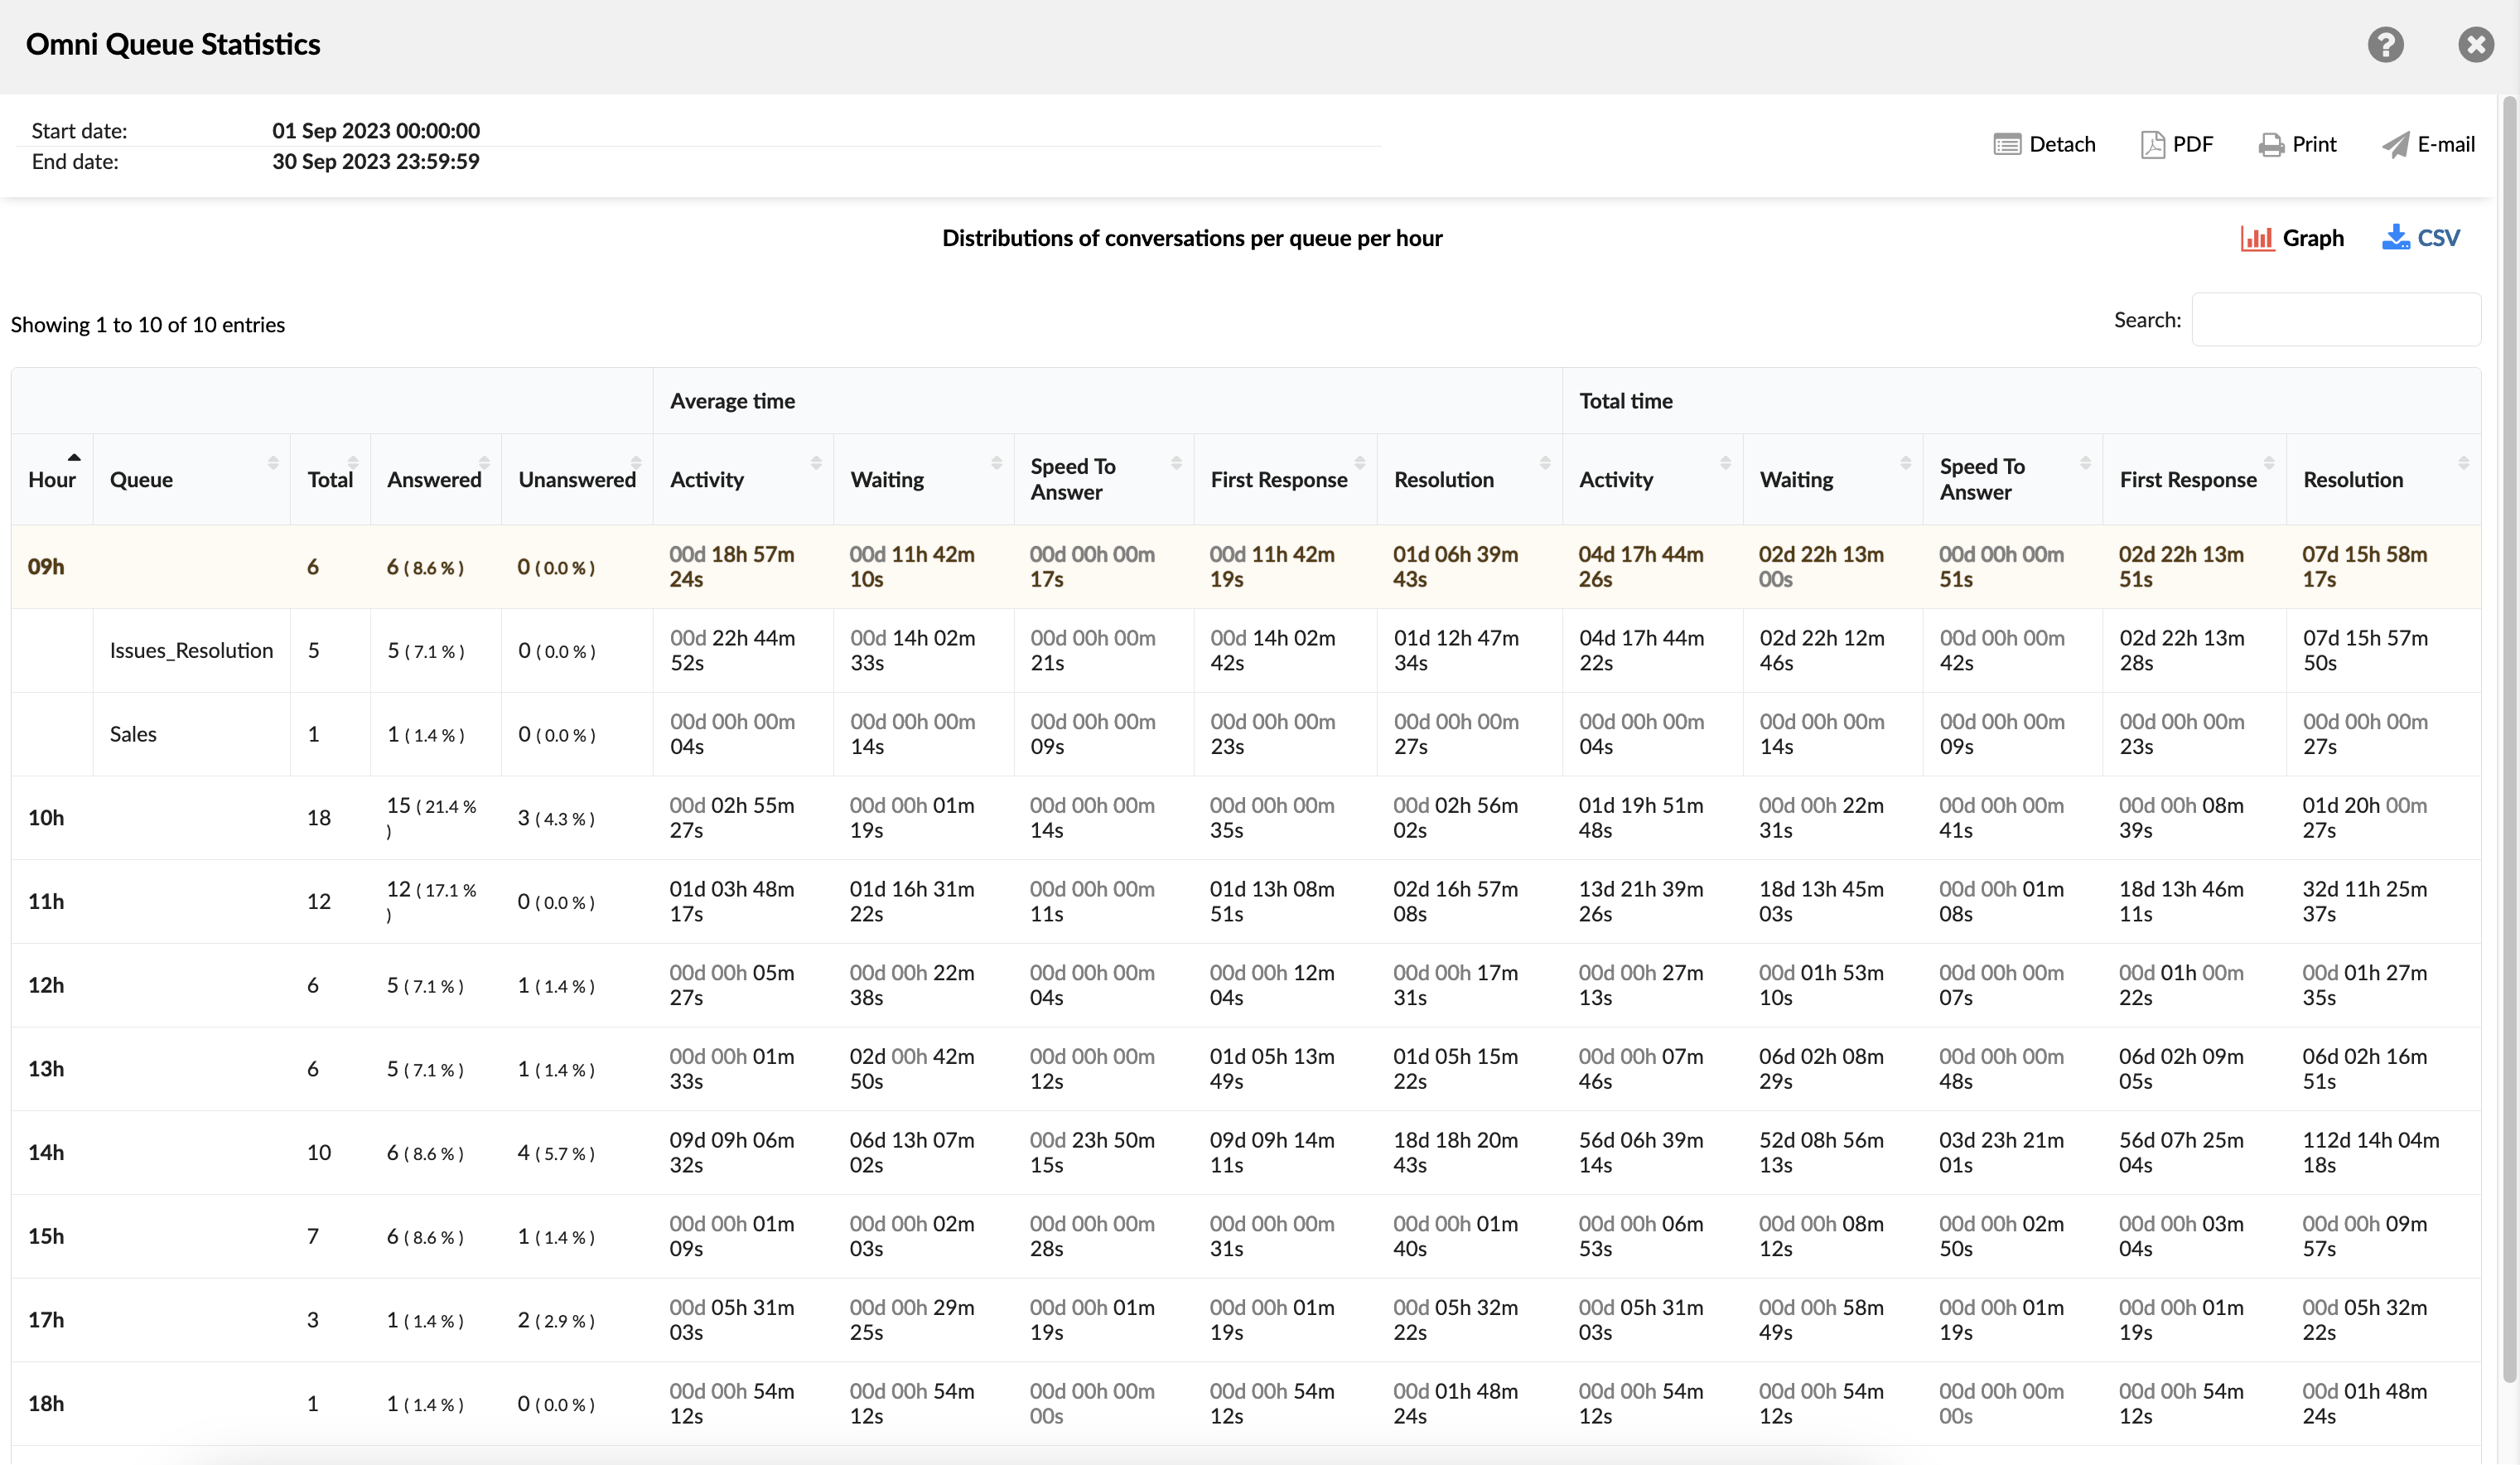
This statistical representation illustrates the dispersion of conversations across queues throughout the day. Its purpose is to facilitate the identification of peak periods for customer communication.
Chart of conversation distribution by queue and by hour
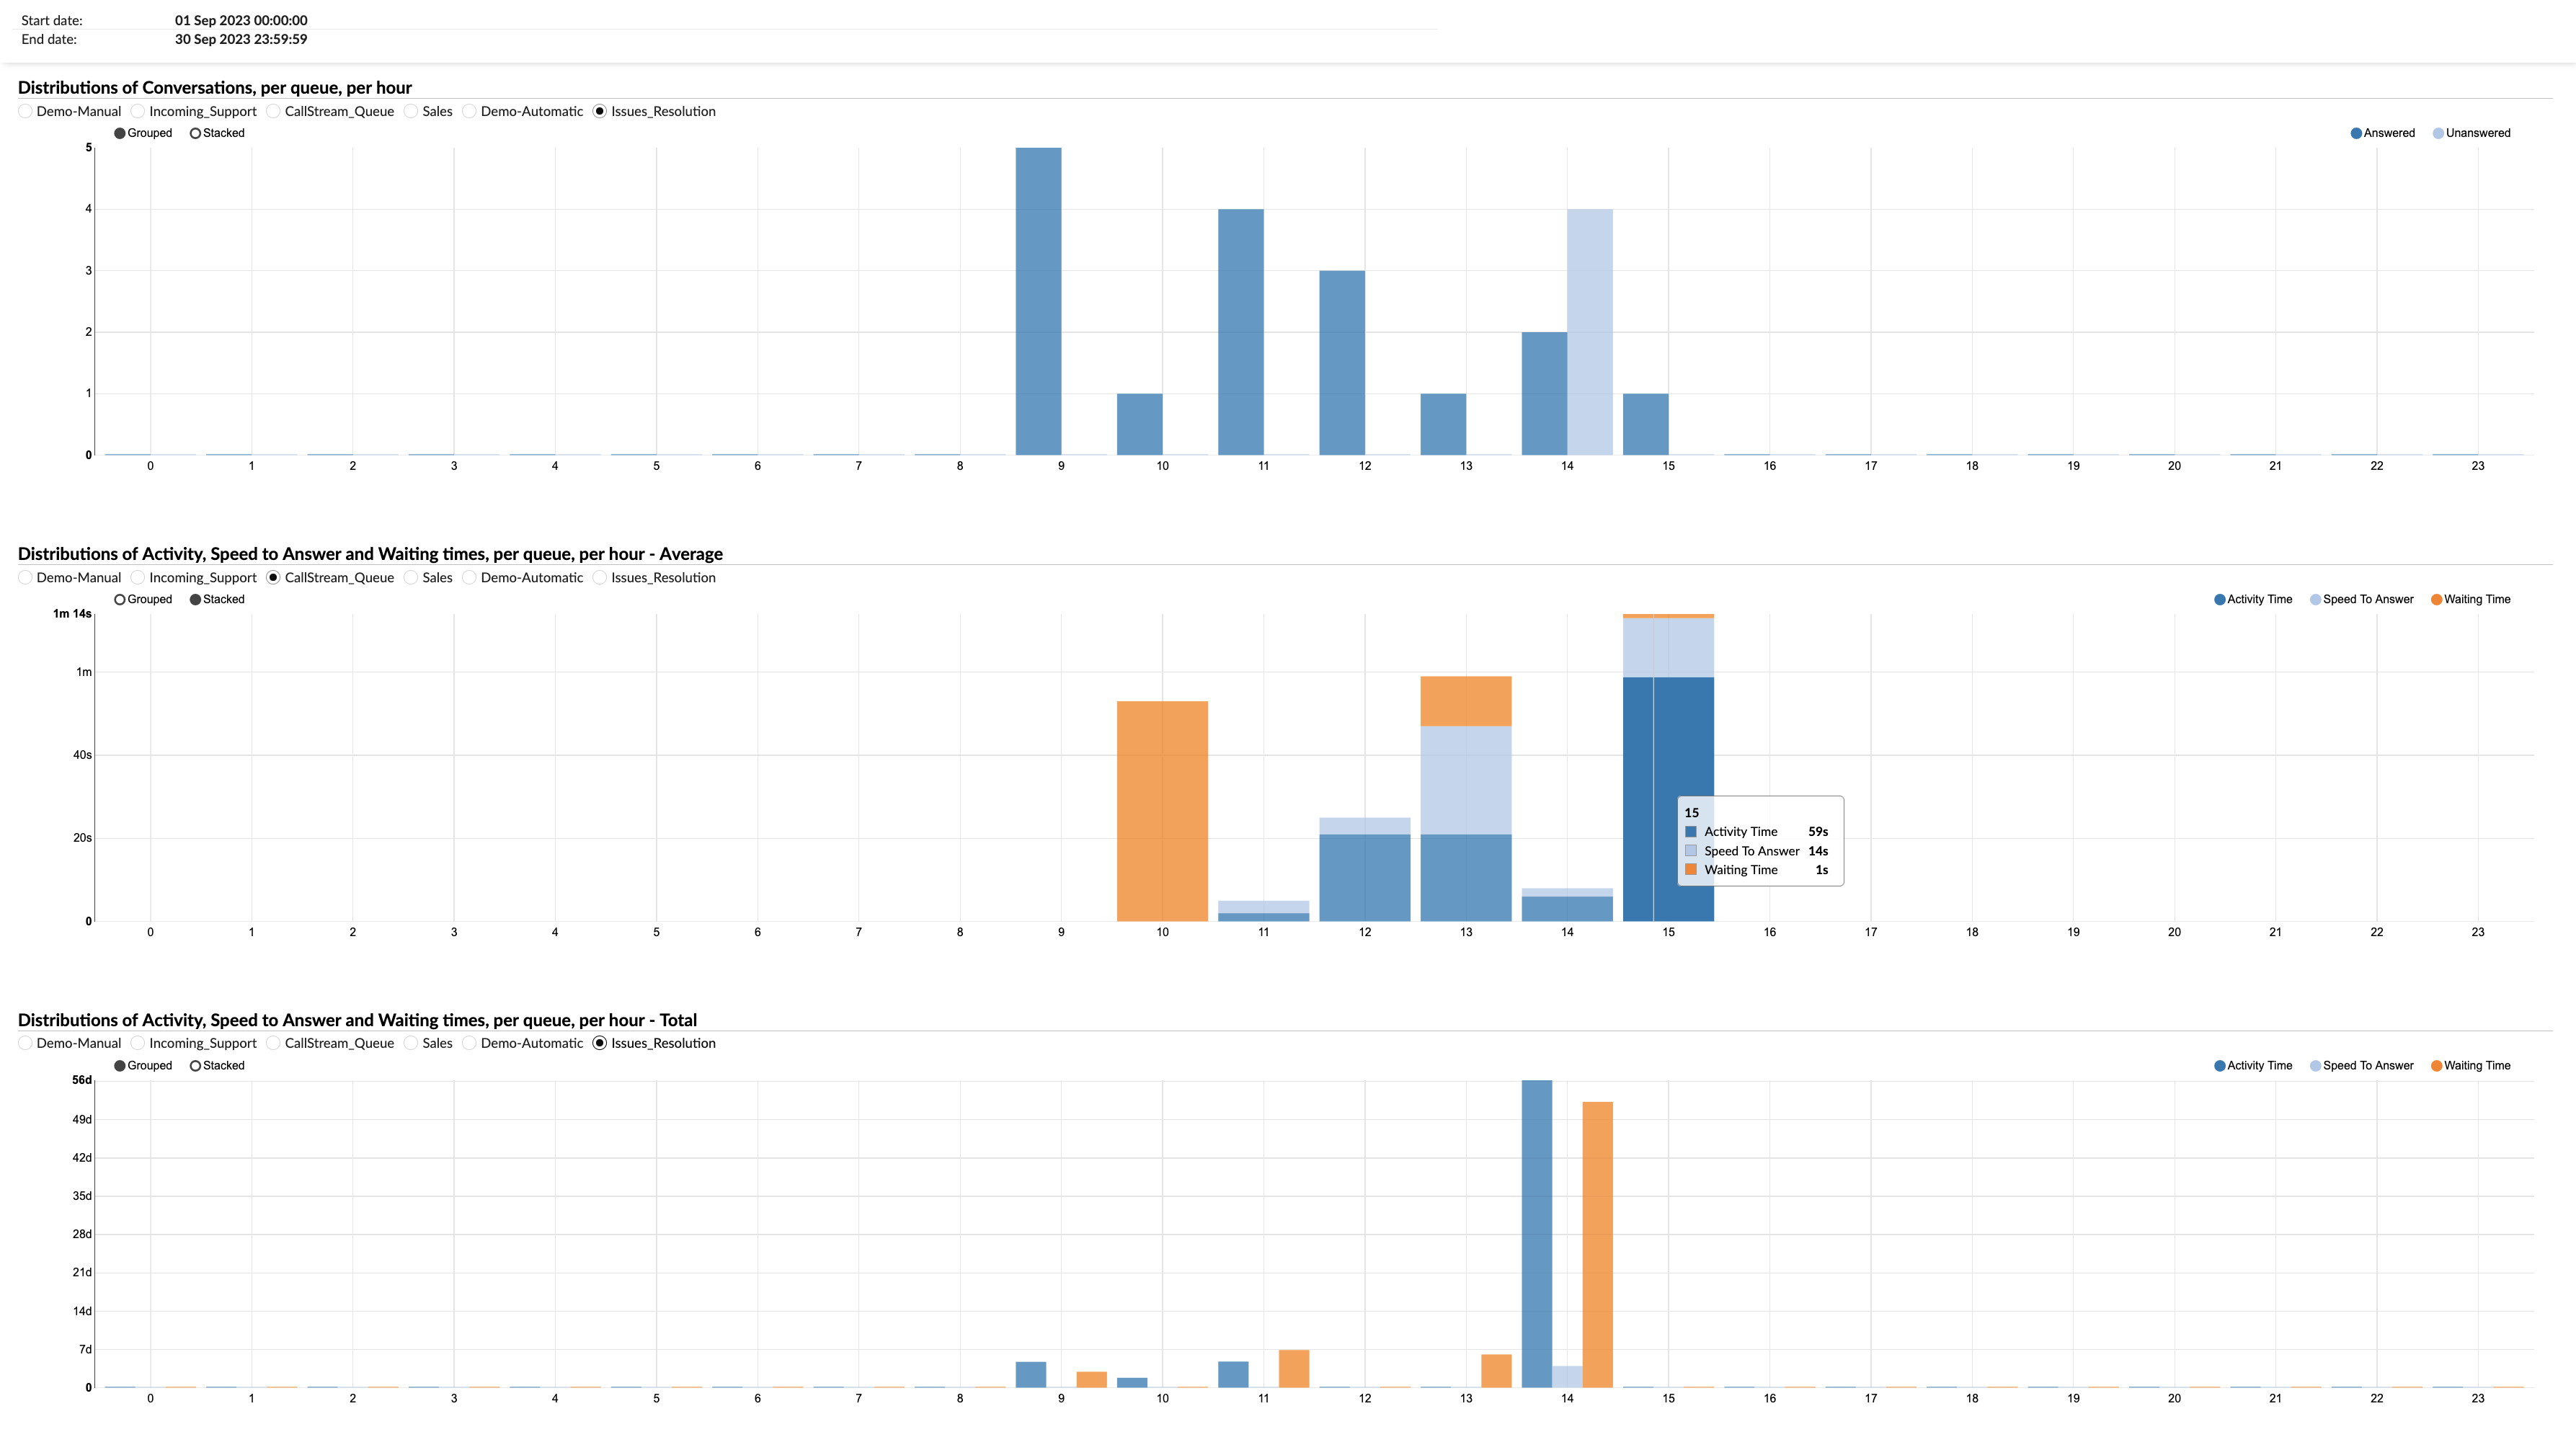
This composite chart includes three distinct sub-charts. The initial sub-chart displays the hourly breakdown of conversations across different queues. The second sub-chart illustrates the average duration of activity distribution, response speed and wait times for each queue per hour. Finally, the third sub-chart shows the cumulative time for activity distribution, response speed and wait times for each queue per hour.
Distributions of conversations by queue and by day
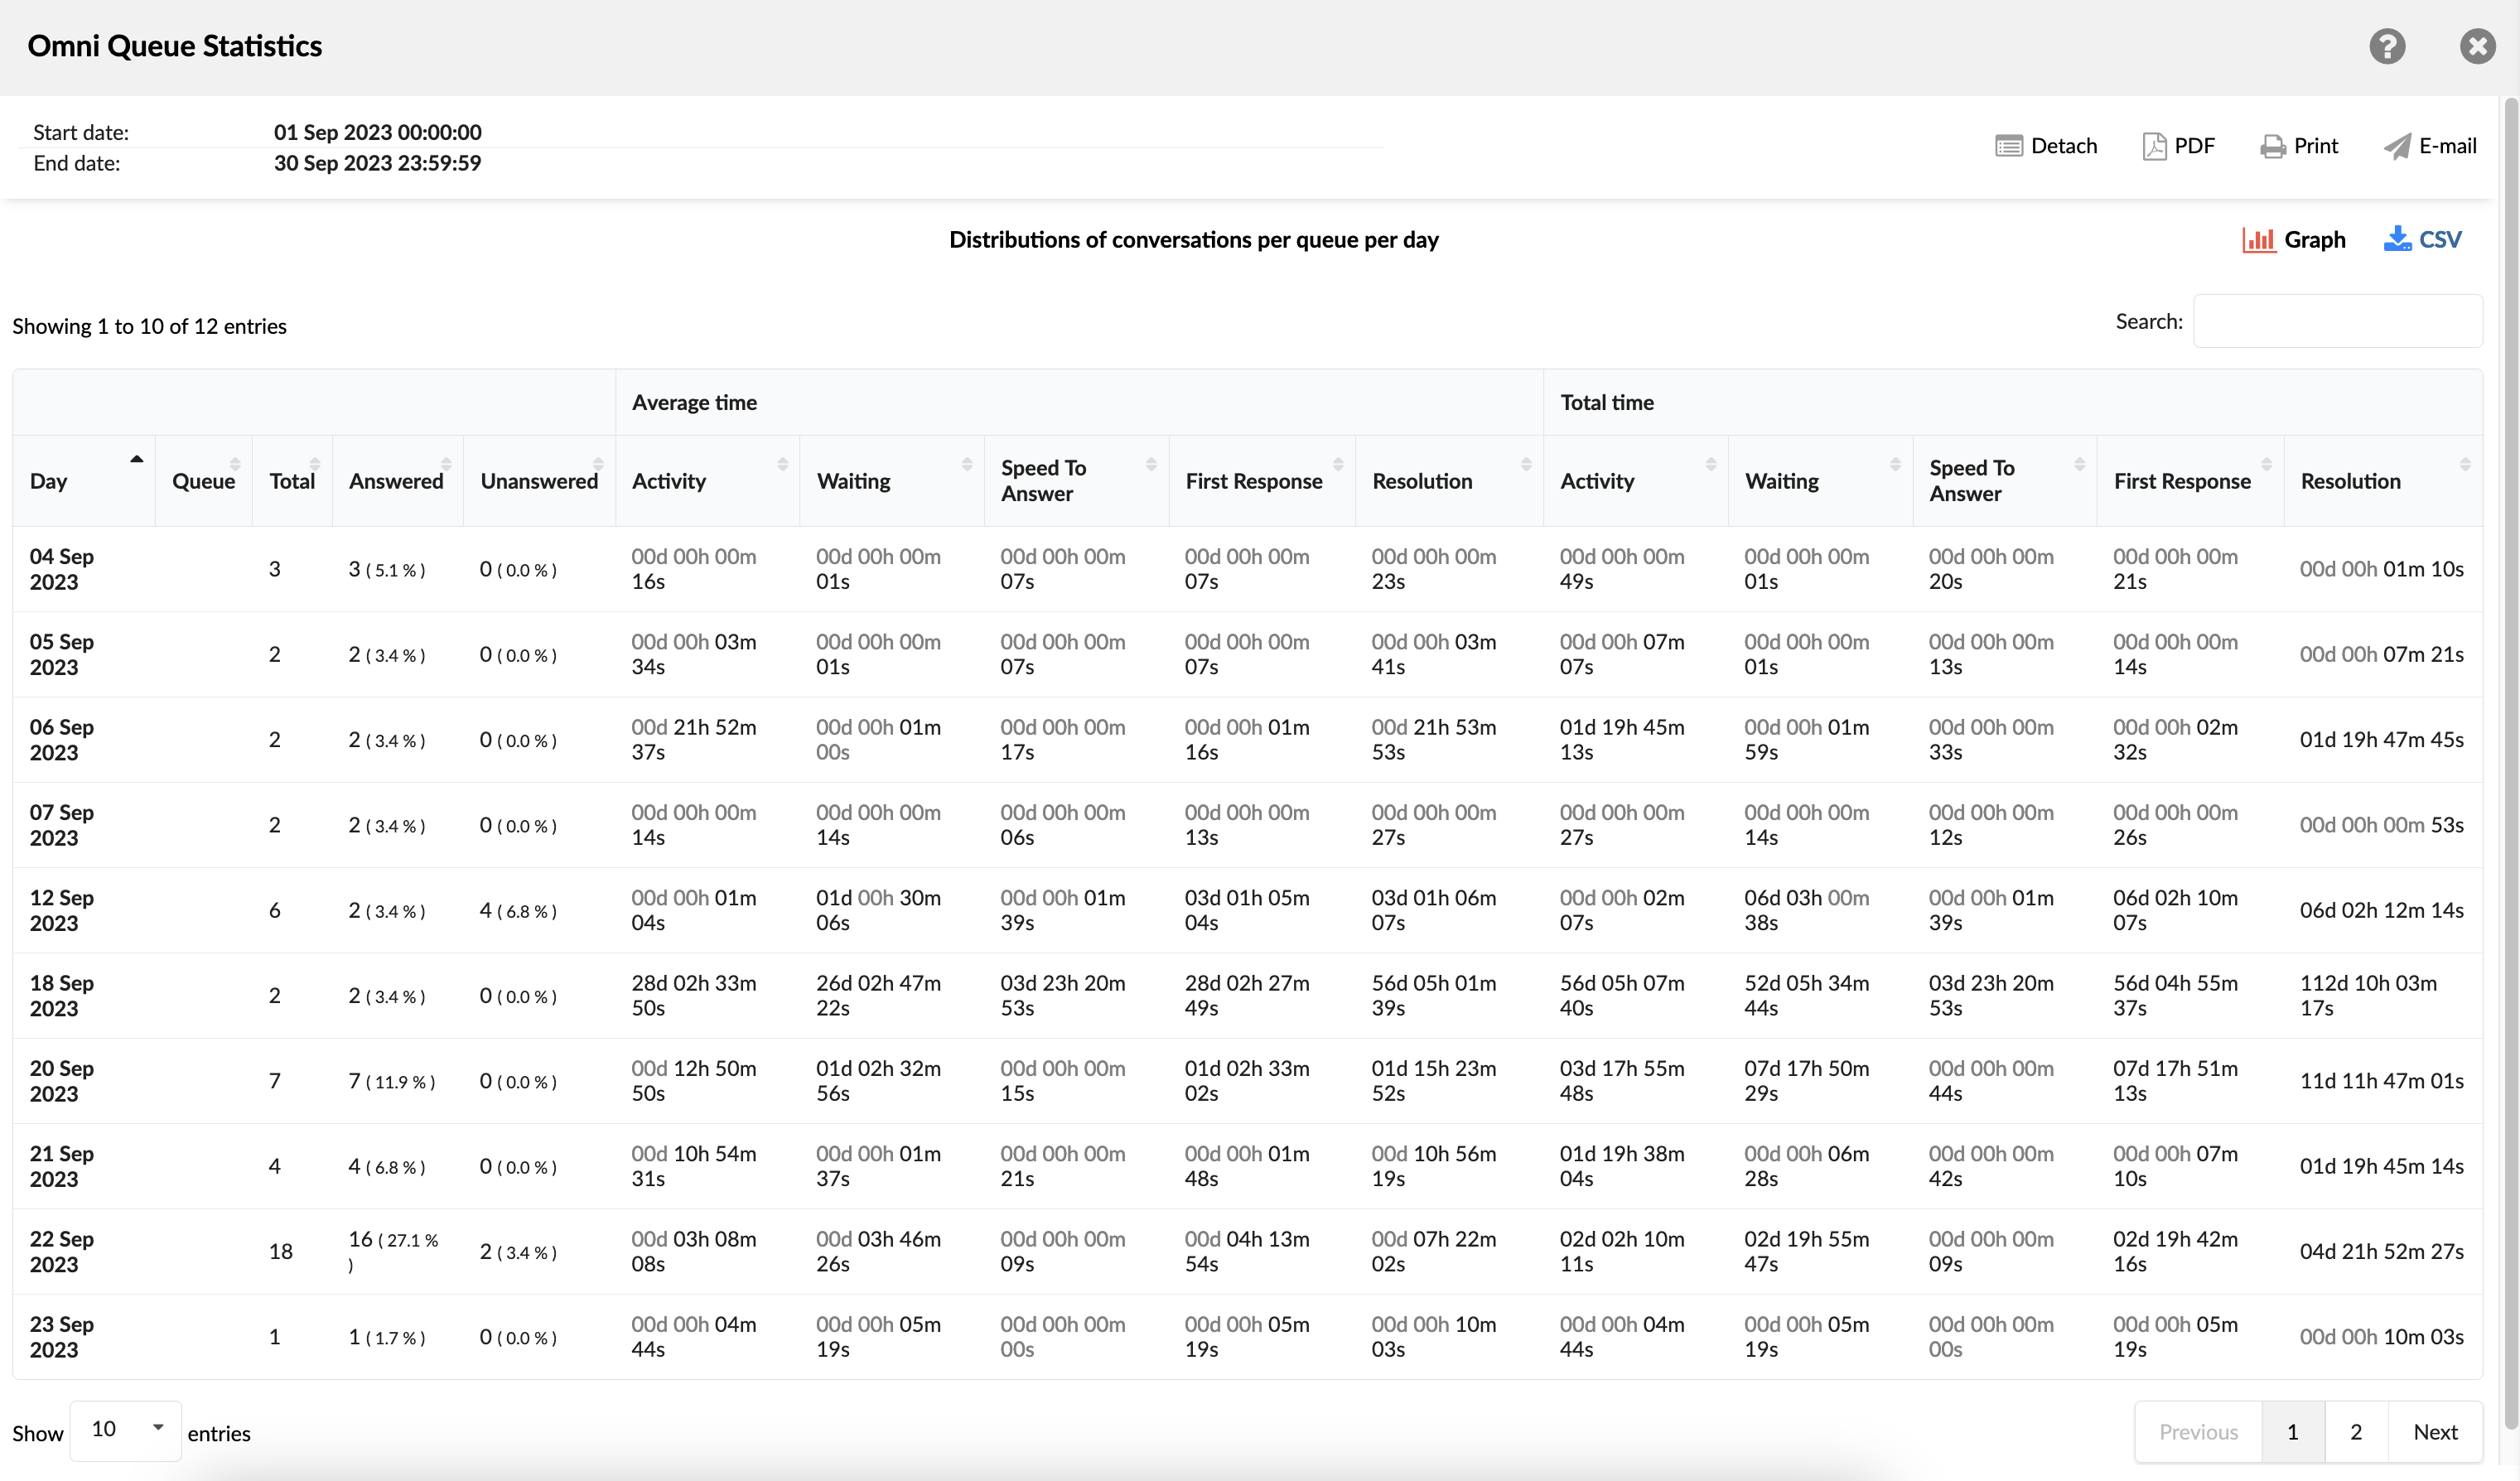
This statistic provides an overview of the daily dispersion of conversations across queues, allowing you to discover patterns and trends in customer communication volume over time. It is an effective tool for tracking the dynamics of customer interactions.
Chart of conversation distribution by queue and by day
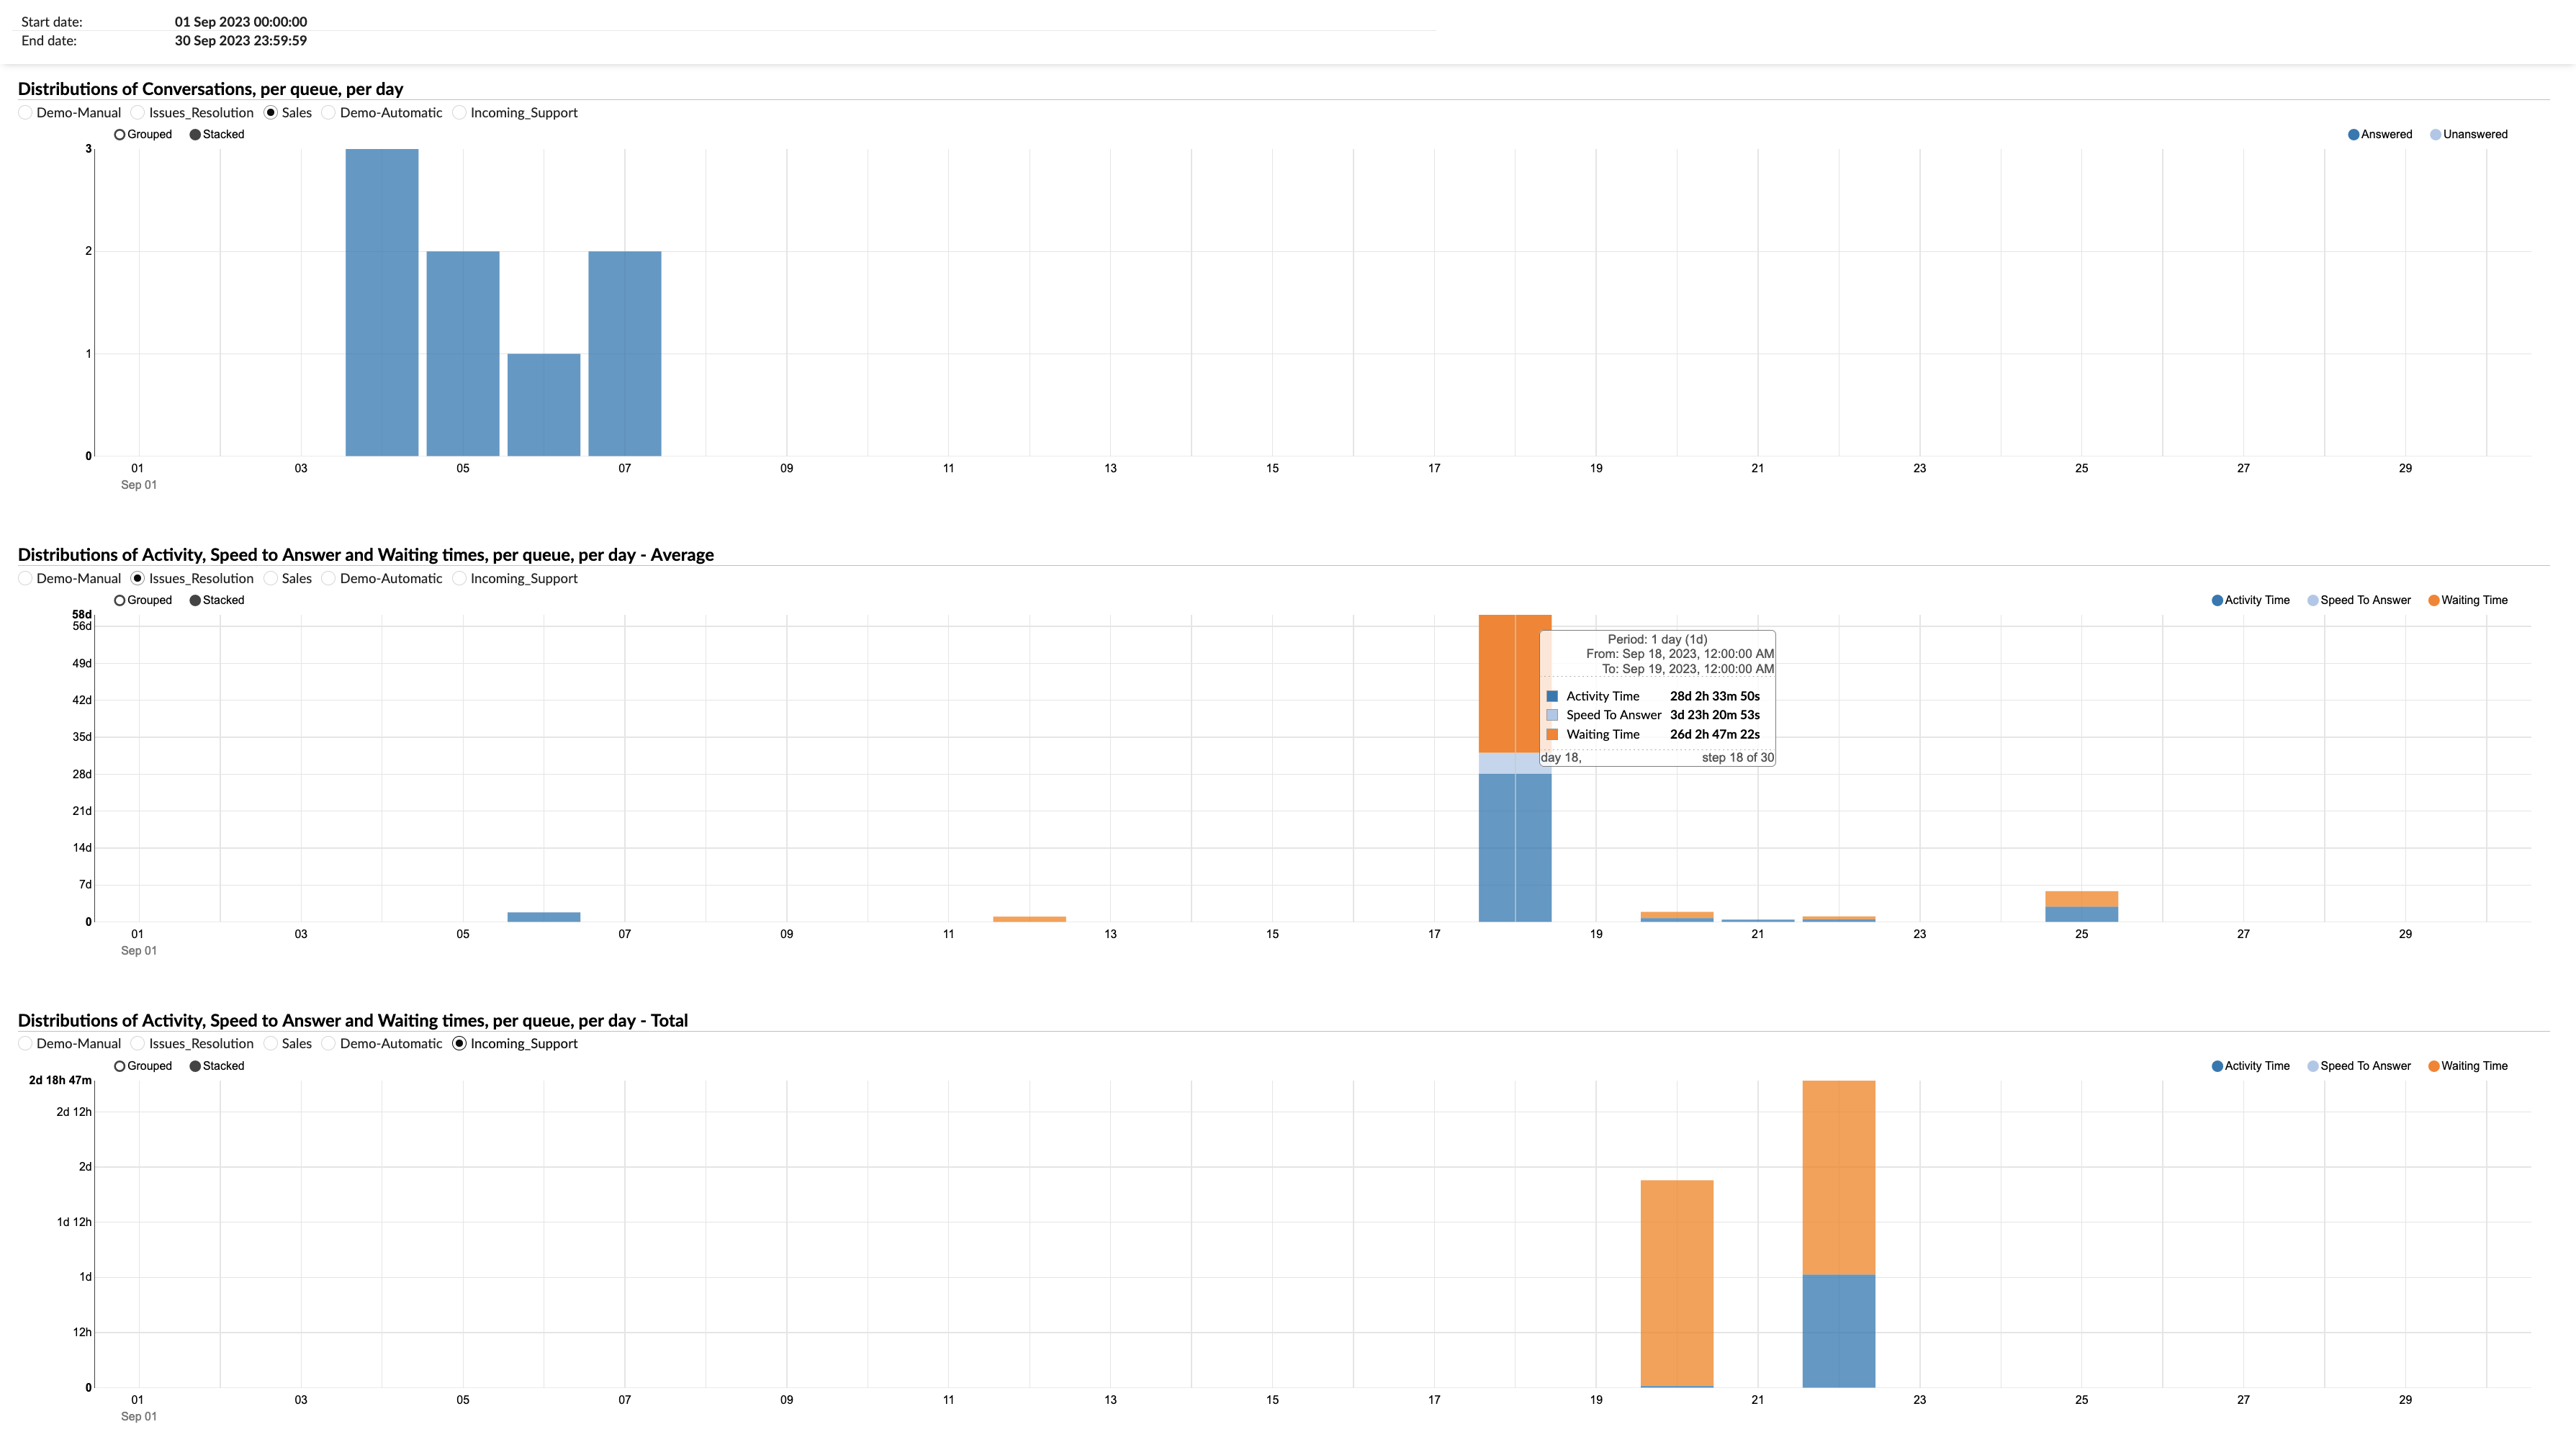
This combined chart contains three segments. The initial segment illustrates the daily breakdowns of conversations by queue. The second element presents a chart showing the average duration of activity distribution, response speed and wait times per queue and per day. The third segment reflects the second, displaying the cumulative time of activity distribution, response speed and wait times per queue and per day.
Distributions of conversations by queue and by day of the week
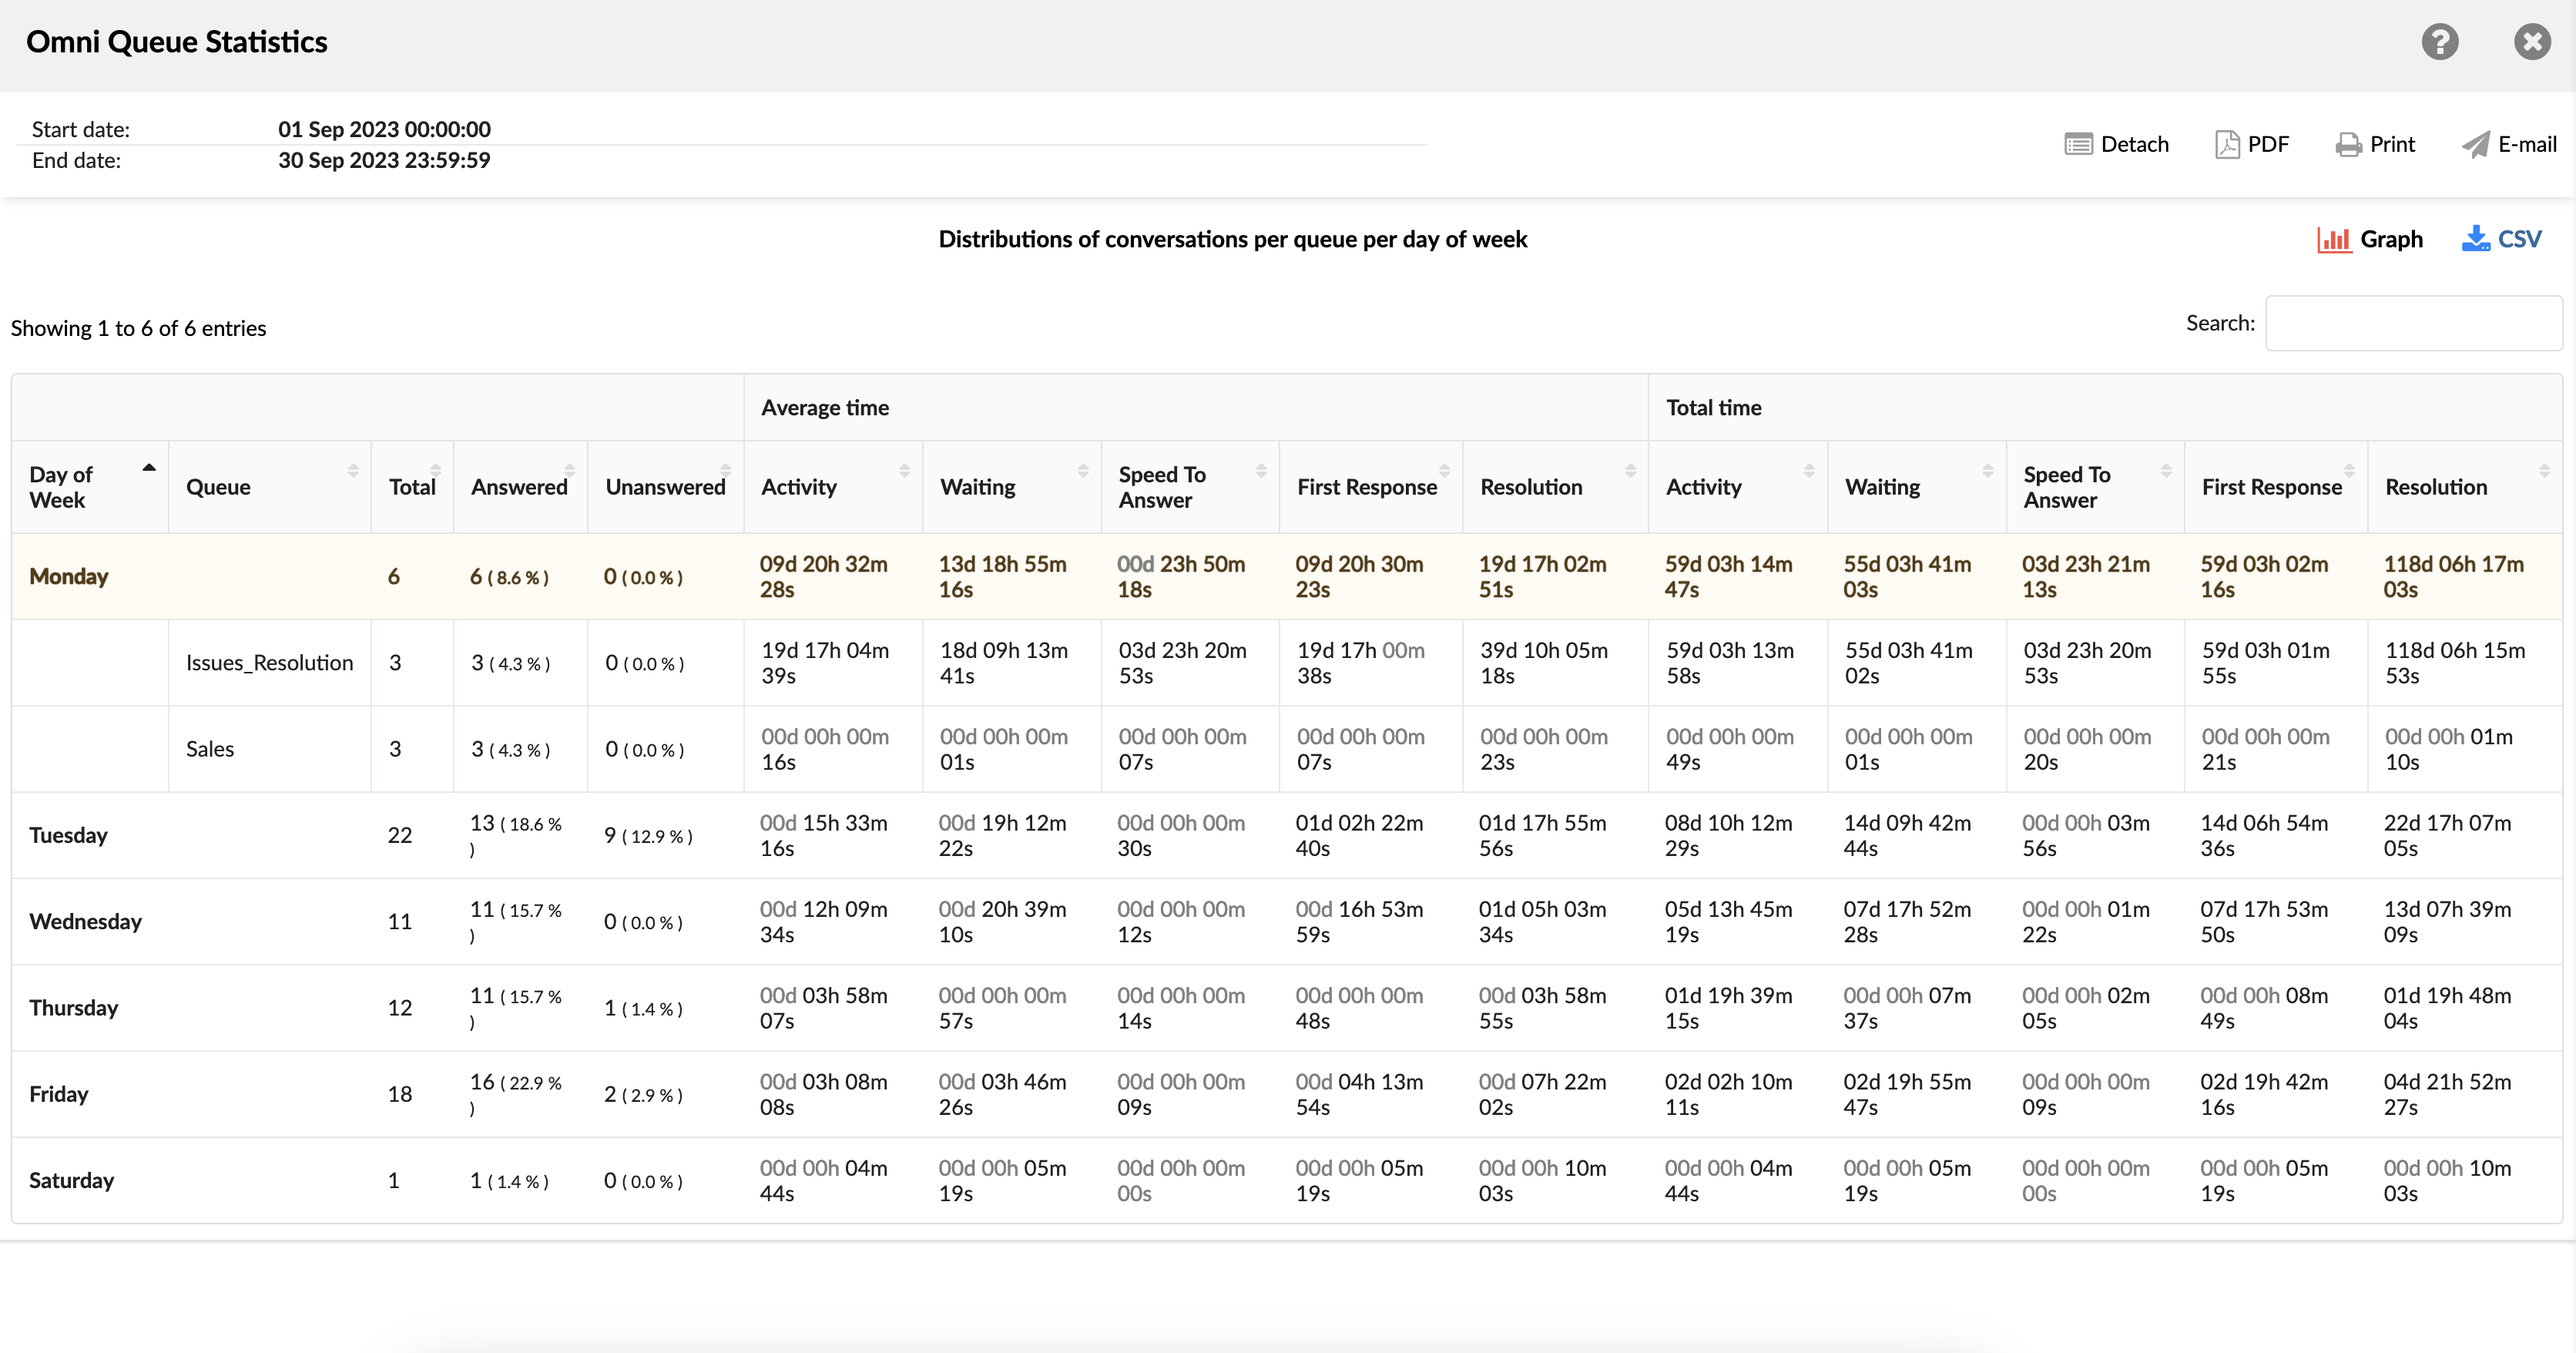
This metric highlights the distribution of conversations by queue across the days of the week, providing valuable insights into peak days for customer communication. This information provides a basis for strategic analysis and planning of resource allocation.
Chart of conversation distribution by queue and by day of the week
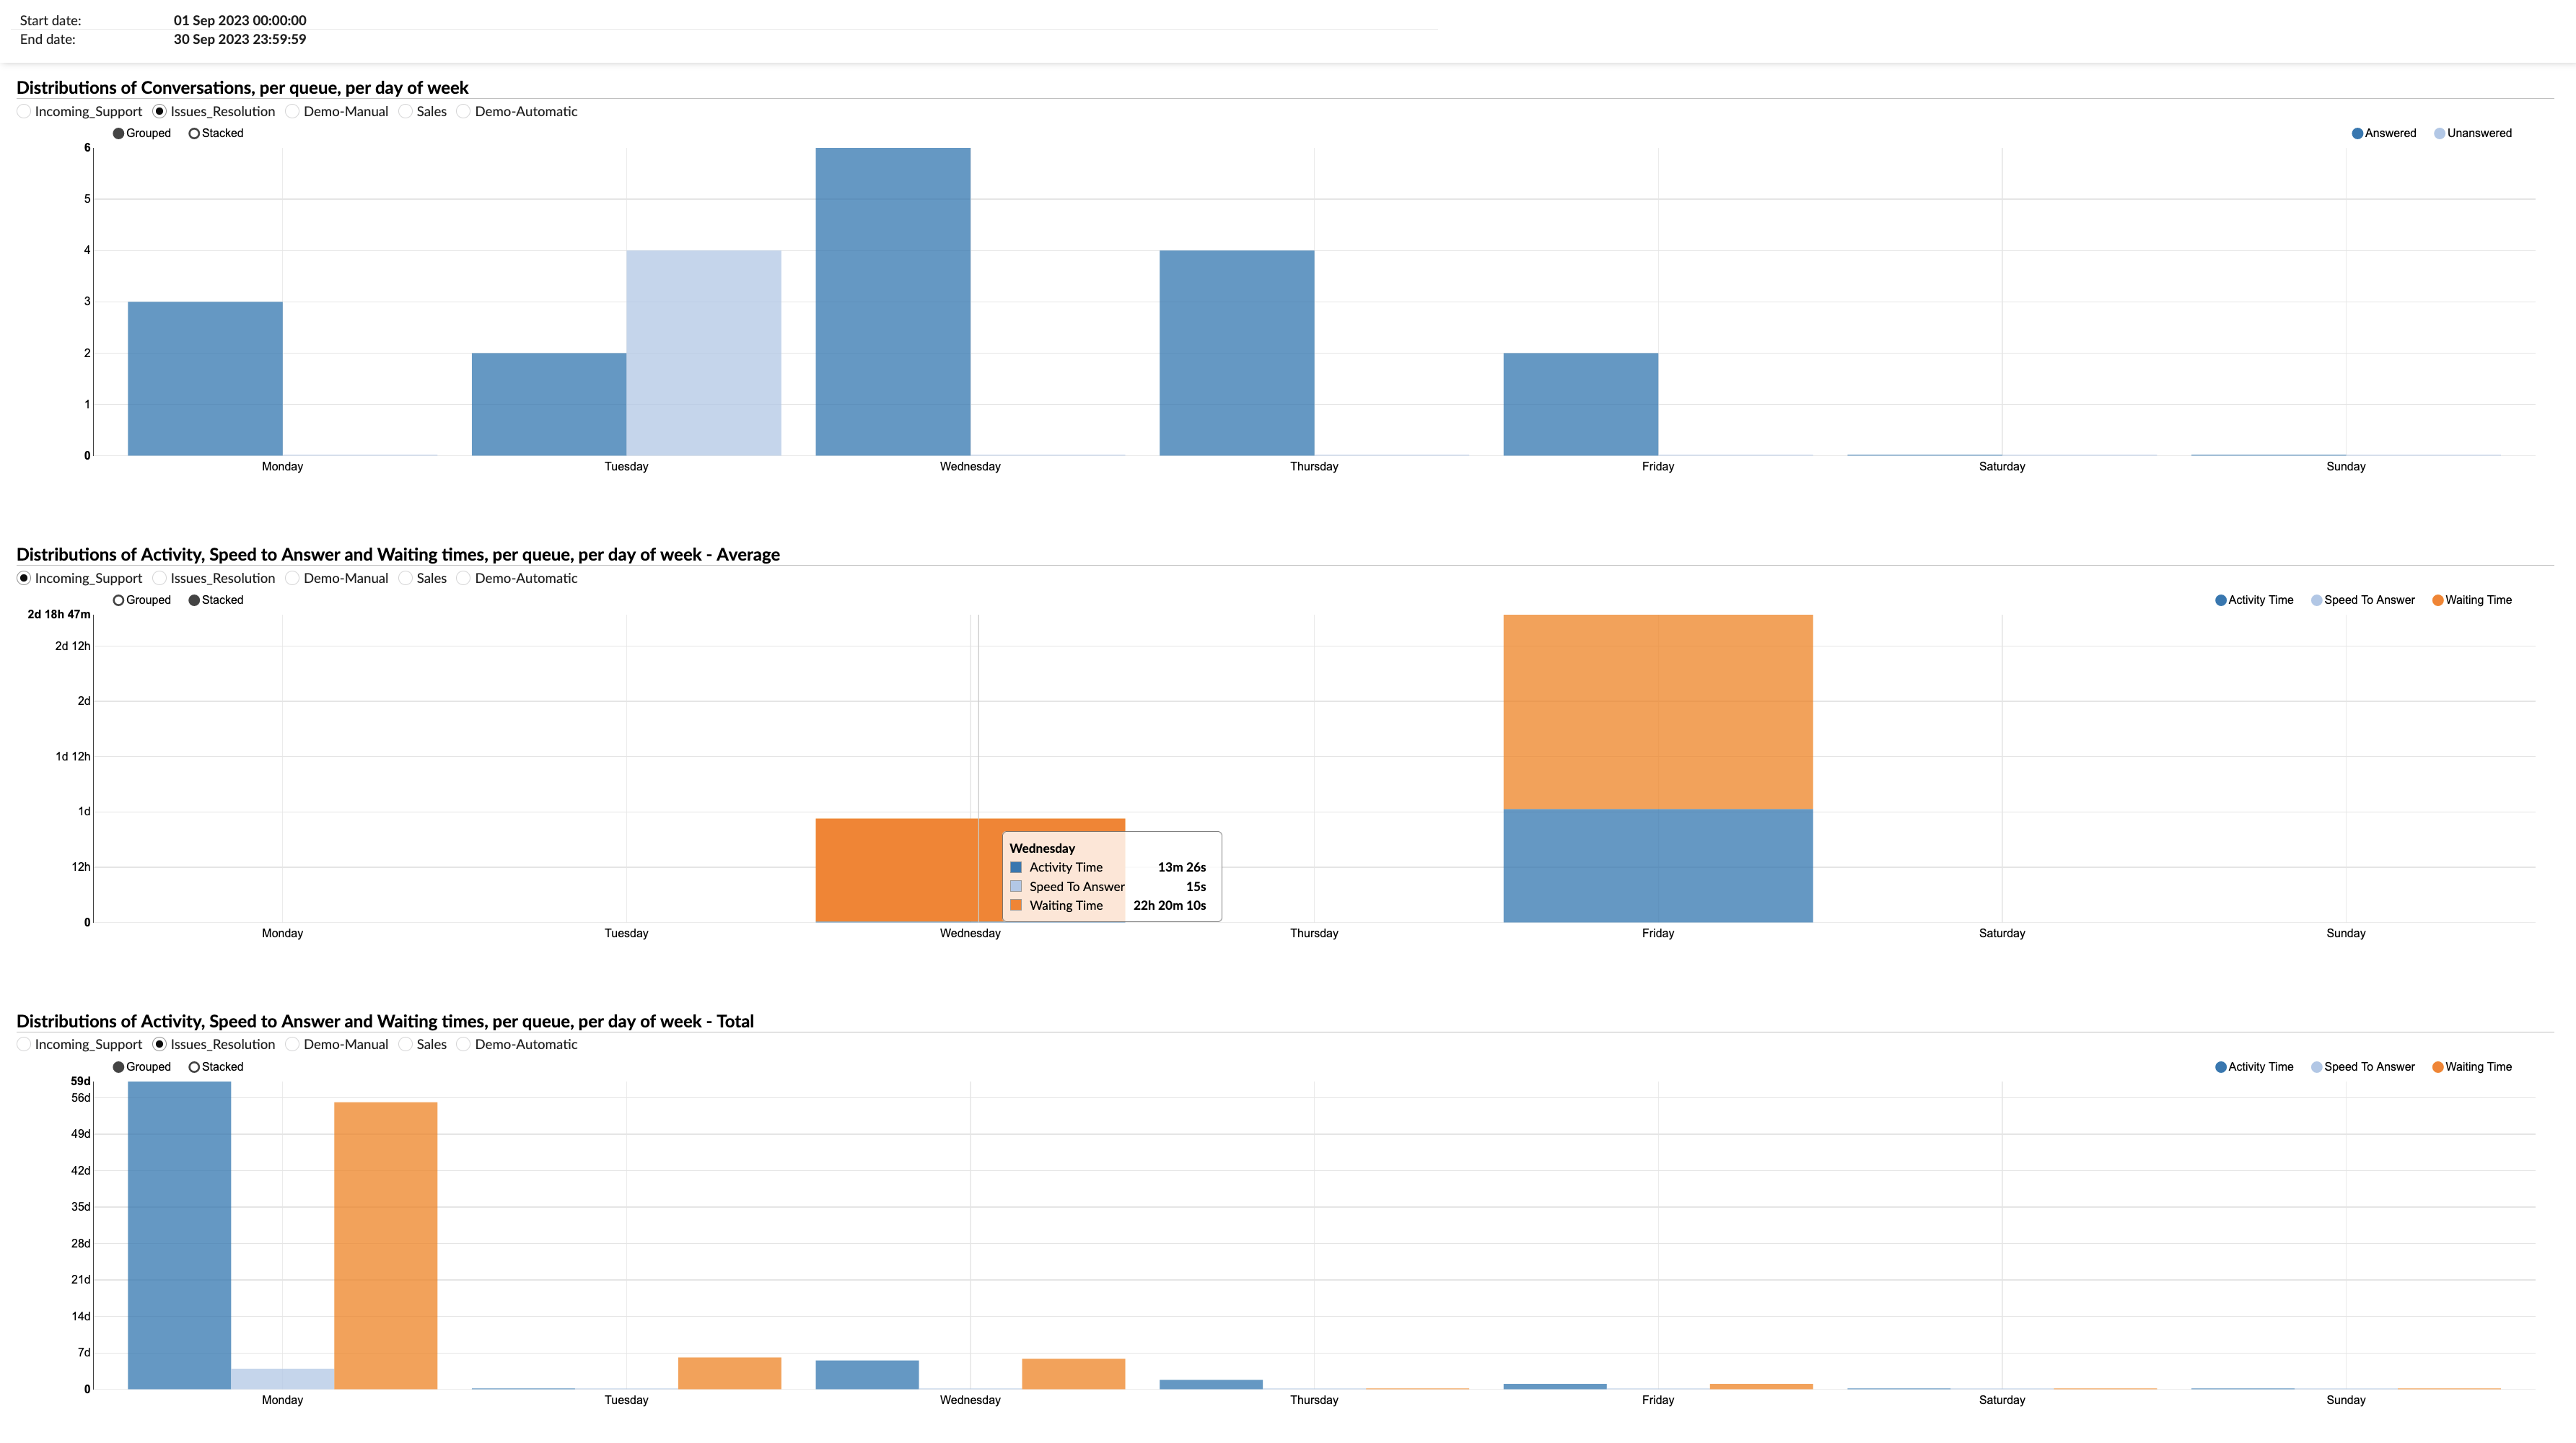
This chart contains three segments. The first segment presents the breakdown of conversations by queue for each day of the week. In the second segment, you will find a representation of the average duration of activity distribution, response speed and wait times per queue, grouped by respective day of the week. Likewise, the third segment illustrates the cumulative time required for activity distribution, response speed and wait times per queue, again segmented by days of the week.
Queued conversations by agent
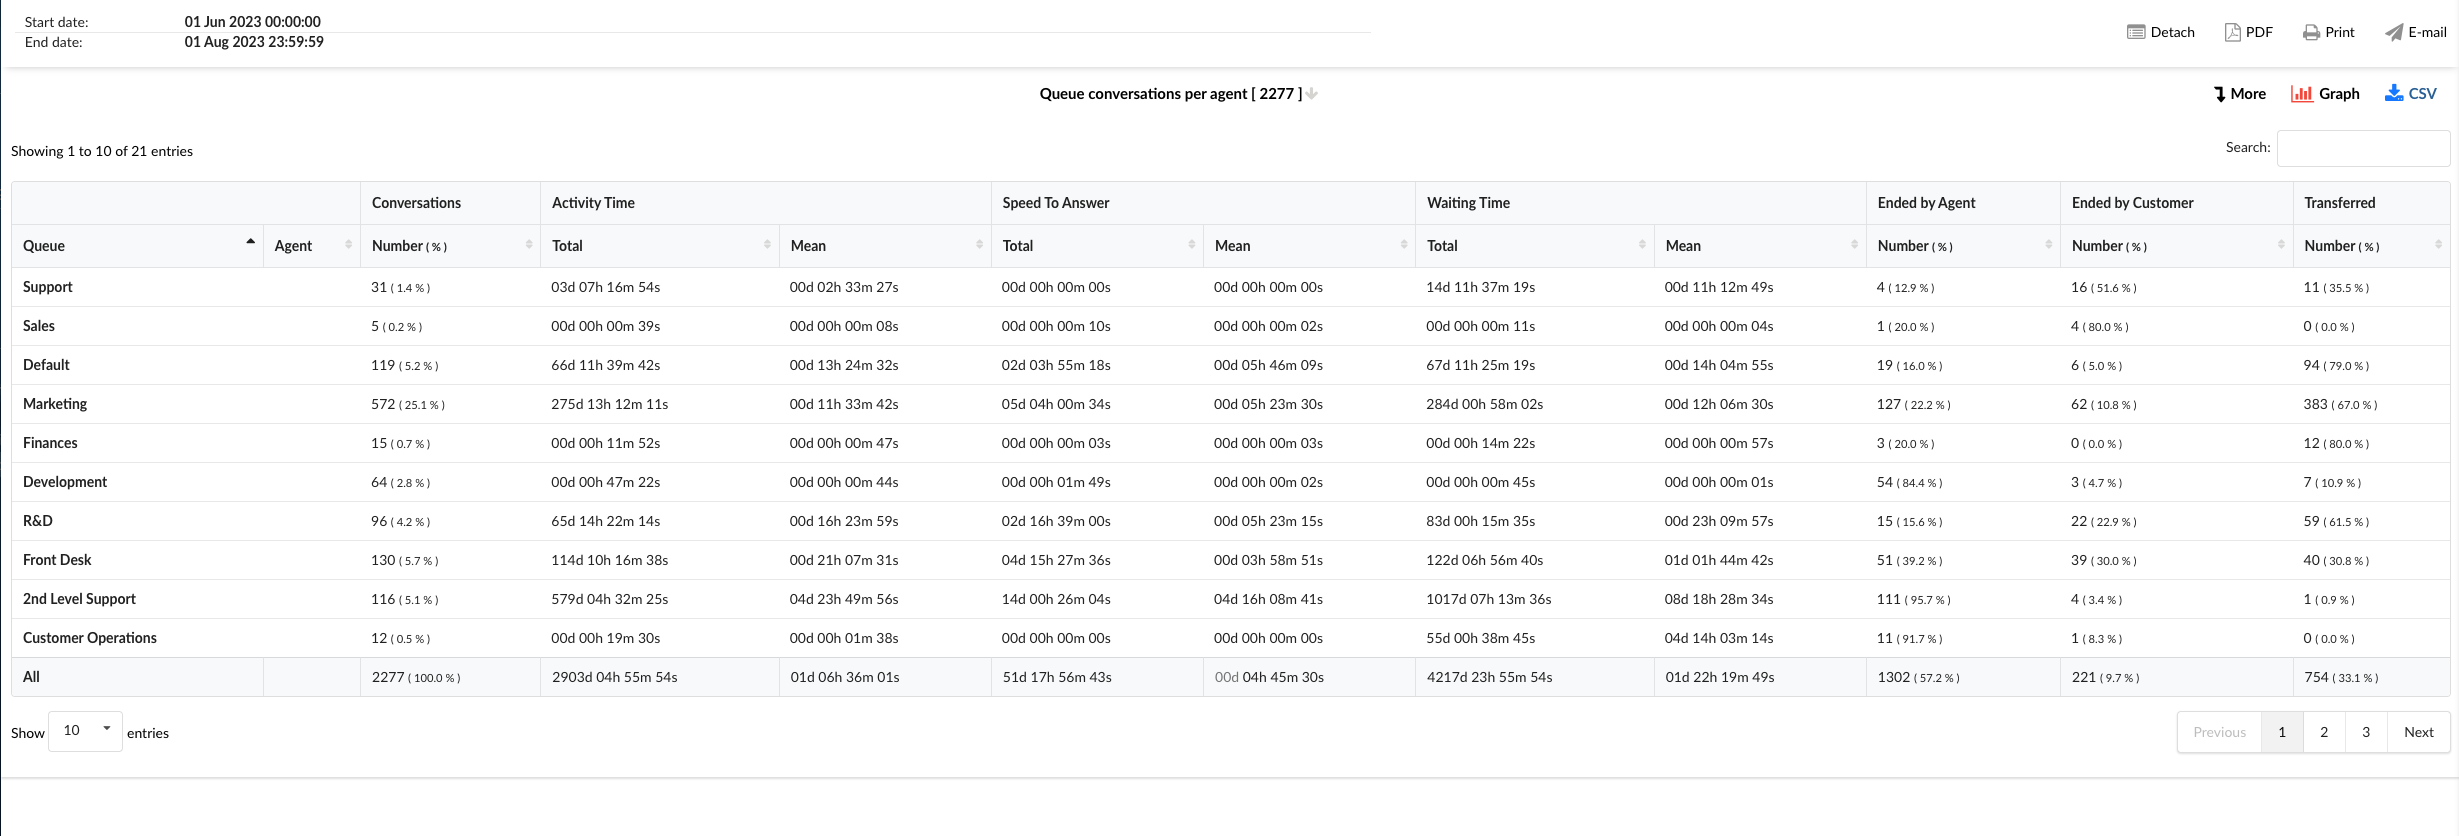
The "Queue conversations by agent" report provides an overview of agents' interactions across various service queues during a specified period. It displays key indicators such as the number of conversations handled by each queue, the average and total active durations, the speed at which agents answered queries, and the average and total wait times. The report also offers insight into the number of conversations concluded by agents, the number ended by customers, and the number of transferred conversations. This consolidated view allows organizations to assess agent performance, queue efficiency, and areas for optimization, thereby ensuring smoother and more efficient customer service operations.
Queue name : this column lists the names of all queues.
Conversations (Number %) : This column displays the total number of conversations that each agent handled in each queue, represented as a number and a percentage of the total conversations.
Active time (Total / Average) : This column is divided into two sub-columns: Total and Average. The “Total” sub-column displays the cumulative time that the agent spent on conversations in each queue. The “Average” sub-column indicates the average time spent per conversation.
Answer speed (Total / Average) : This column, also divided into the ‘Total’ and ‘Average’ sub-columns, represents the time taken by the agent to answer a conversation. “Total” is the cumulative duration of all conversations and “Average” is the average time needed to answer a conversation.
Wait time (Total / Average) : This column displays the total and average waiting time of conversations in each queue. “Total” corresponds to the cumulative waiting time for all conversations and “Average” corresponds to the average waiting time per conversation.
Ended by the agent (Number %) : this column displays the number and percentage of conversations ended by the agent in each queue.
Ended by the customer (Number %) : this column displays the number and percentage of conversations ended by the customer in each queue.
Transferred (Number %) : This column displays the number and percentage of conversations that were transferred to another agent or another queue.
Using the "Queue conversations by agent" statistics table, agents can better understand their performance and efficiency across the different queues.
Queued conversations by agent distribution
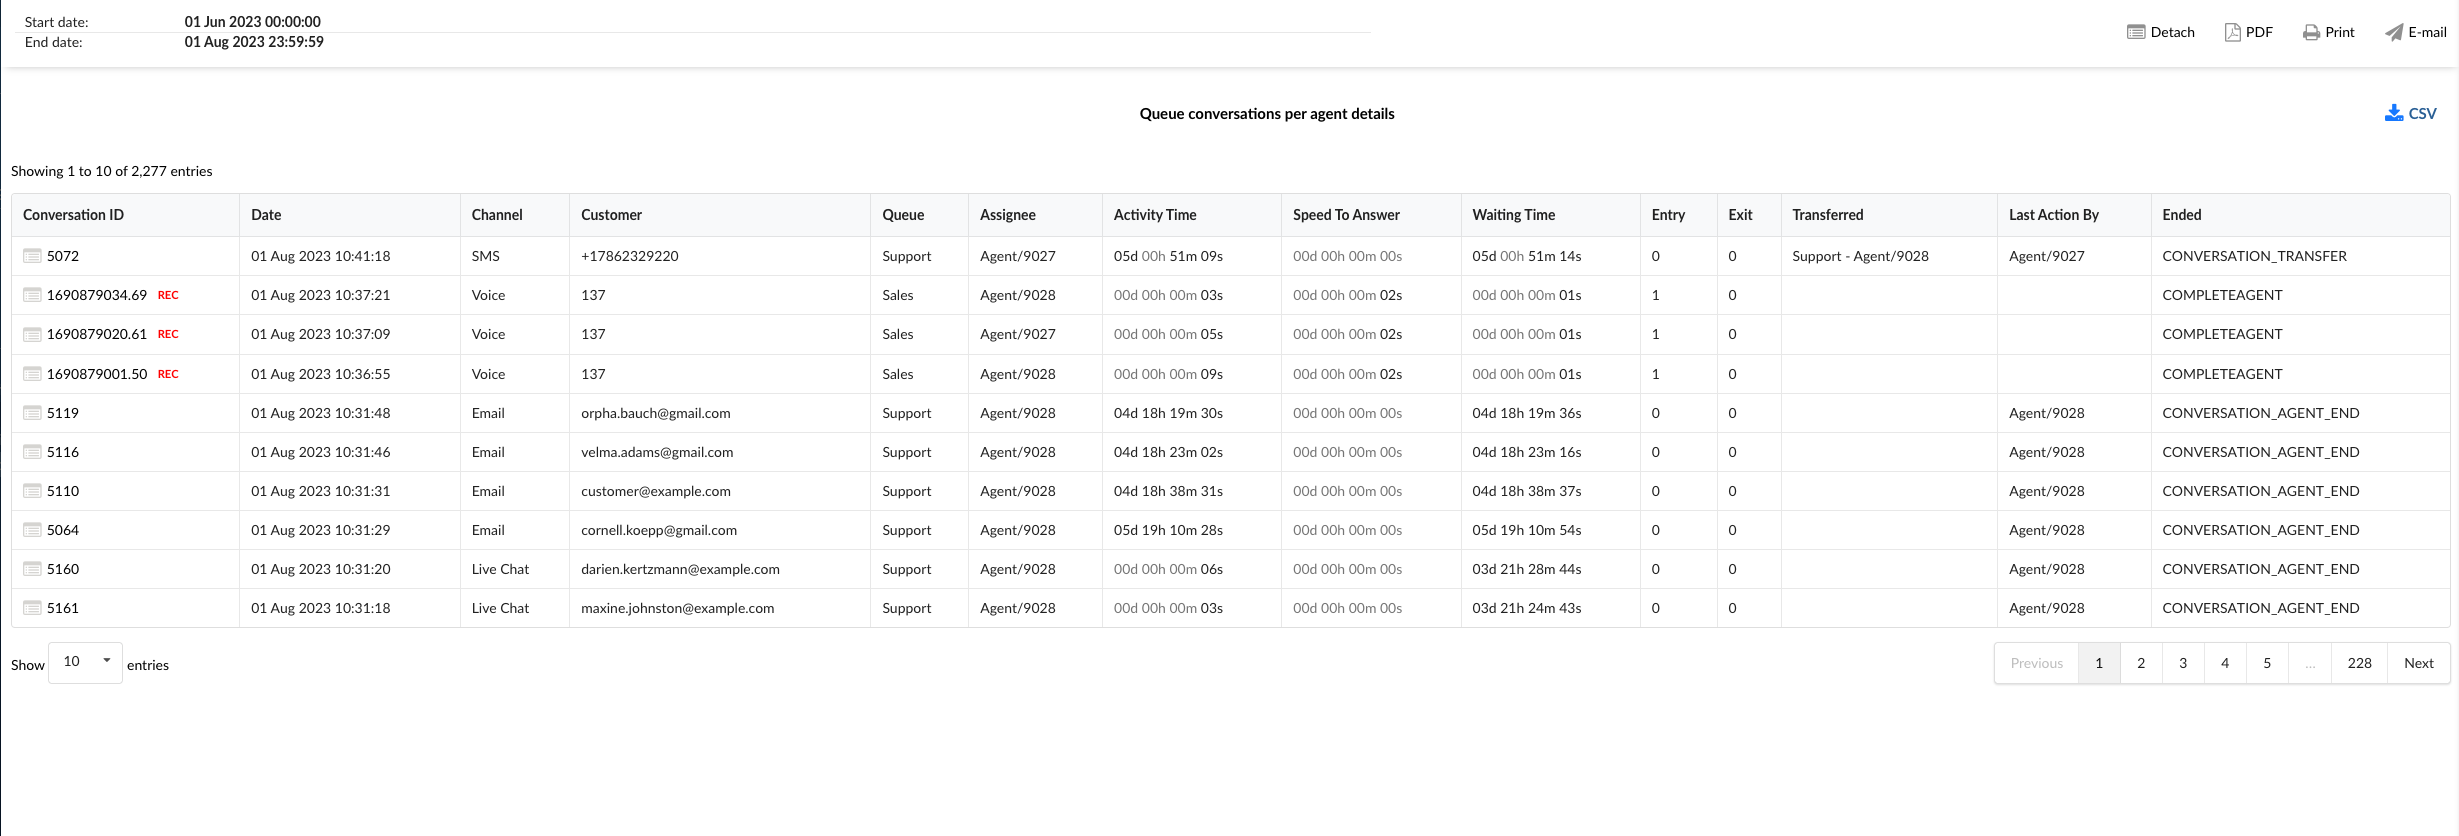
The "Queue conversations by agent breakdown" statistics table provides detailed information about each conversation handled by an agent. The table consists of fourteen columns, each offering specific information about the conversation.
- Conversation ID : lists the unique identifiers (ticket or call ID) for each conversation.
- Date : Displays the date on which each conversation took place.
- Channel : indicates the communication channel used for each conversation, such as chat, email or messaging.
- Client : lists the customers involved in each conversation.
- Queue : displays the queue in which each conversation was handled.
- Assignee : Indicates the agent assigned to each conversation.
- Uptime : displays the total time that the agent spent on each conversation.
- Answer speed : represents the time taken by the agent to respond to each conversation.
- Wait time : displays the waiting time of each conversation before an agent answers.
- Input : Indicates the time at which each conversation entered the queue.
- Quit : displays the time at which each conversation left the queue.
- Transferred : Indicates whether each conversation was transferred to another agent or another queue.
- Last action by : indicates who performed the last action in the conversation, whether it was the agent or the customer.
- Completed : Indicates how each conversation ended.
Using the "Queue conversations by agent breakdown" statistics table, agents can gain a granular understanding of their performance and efficiency for each conversation they handle.
Chart of queued conversations by agent
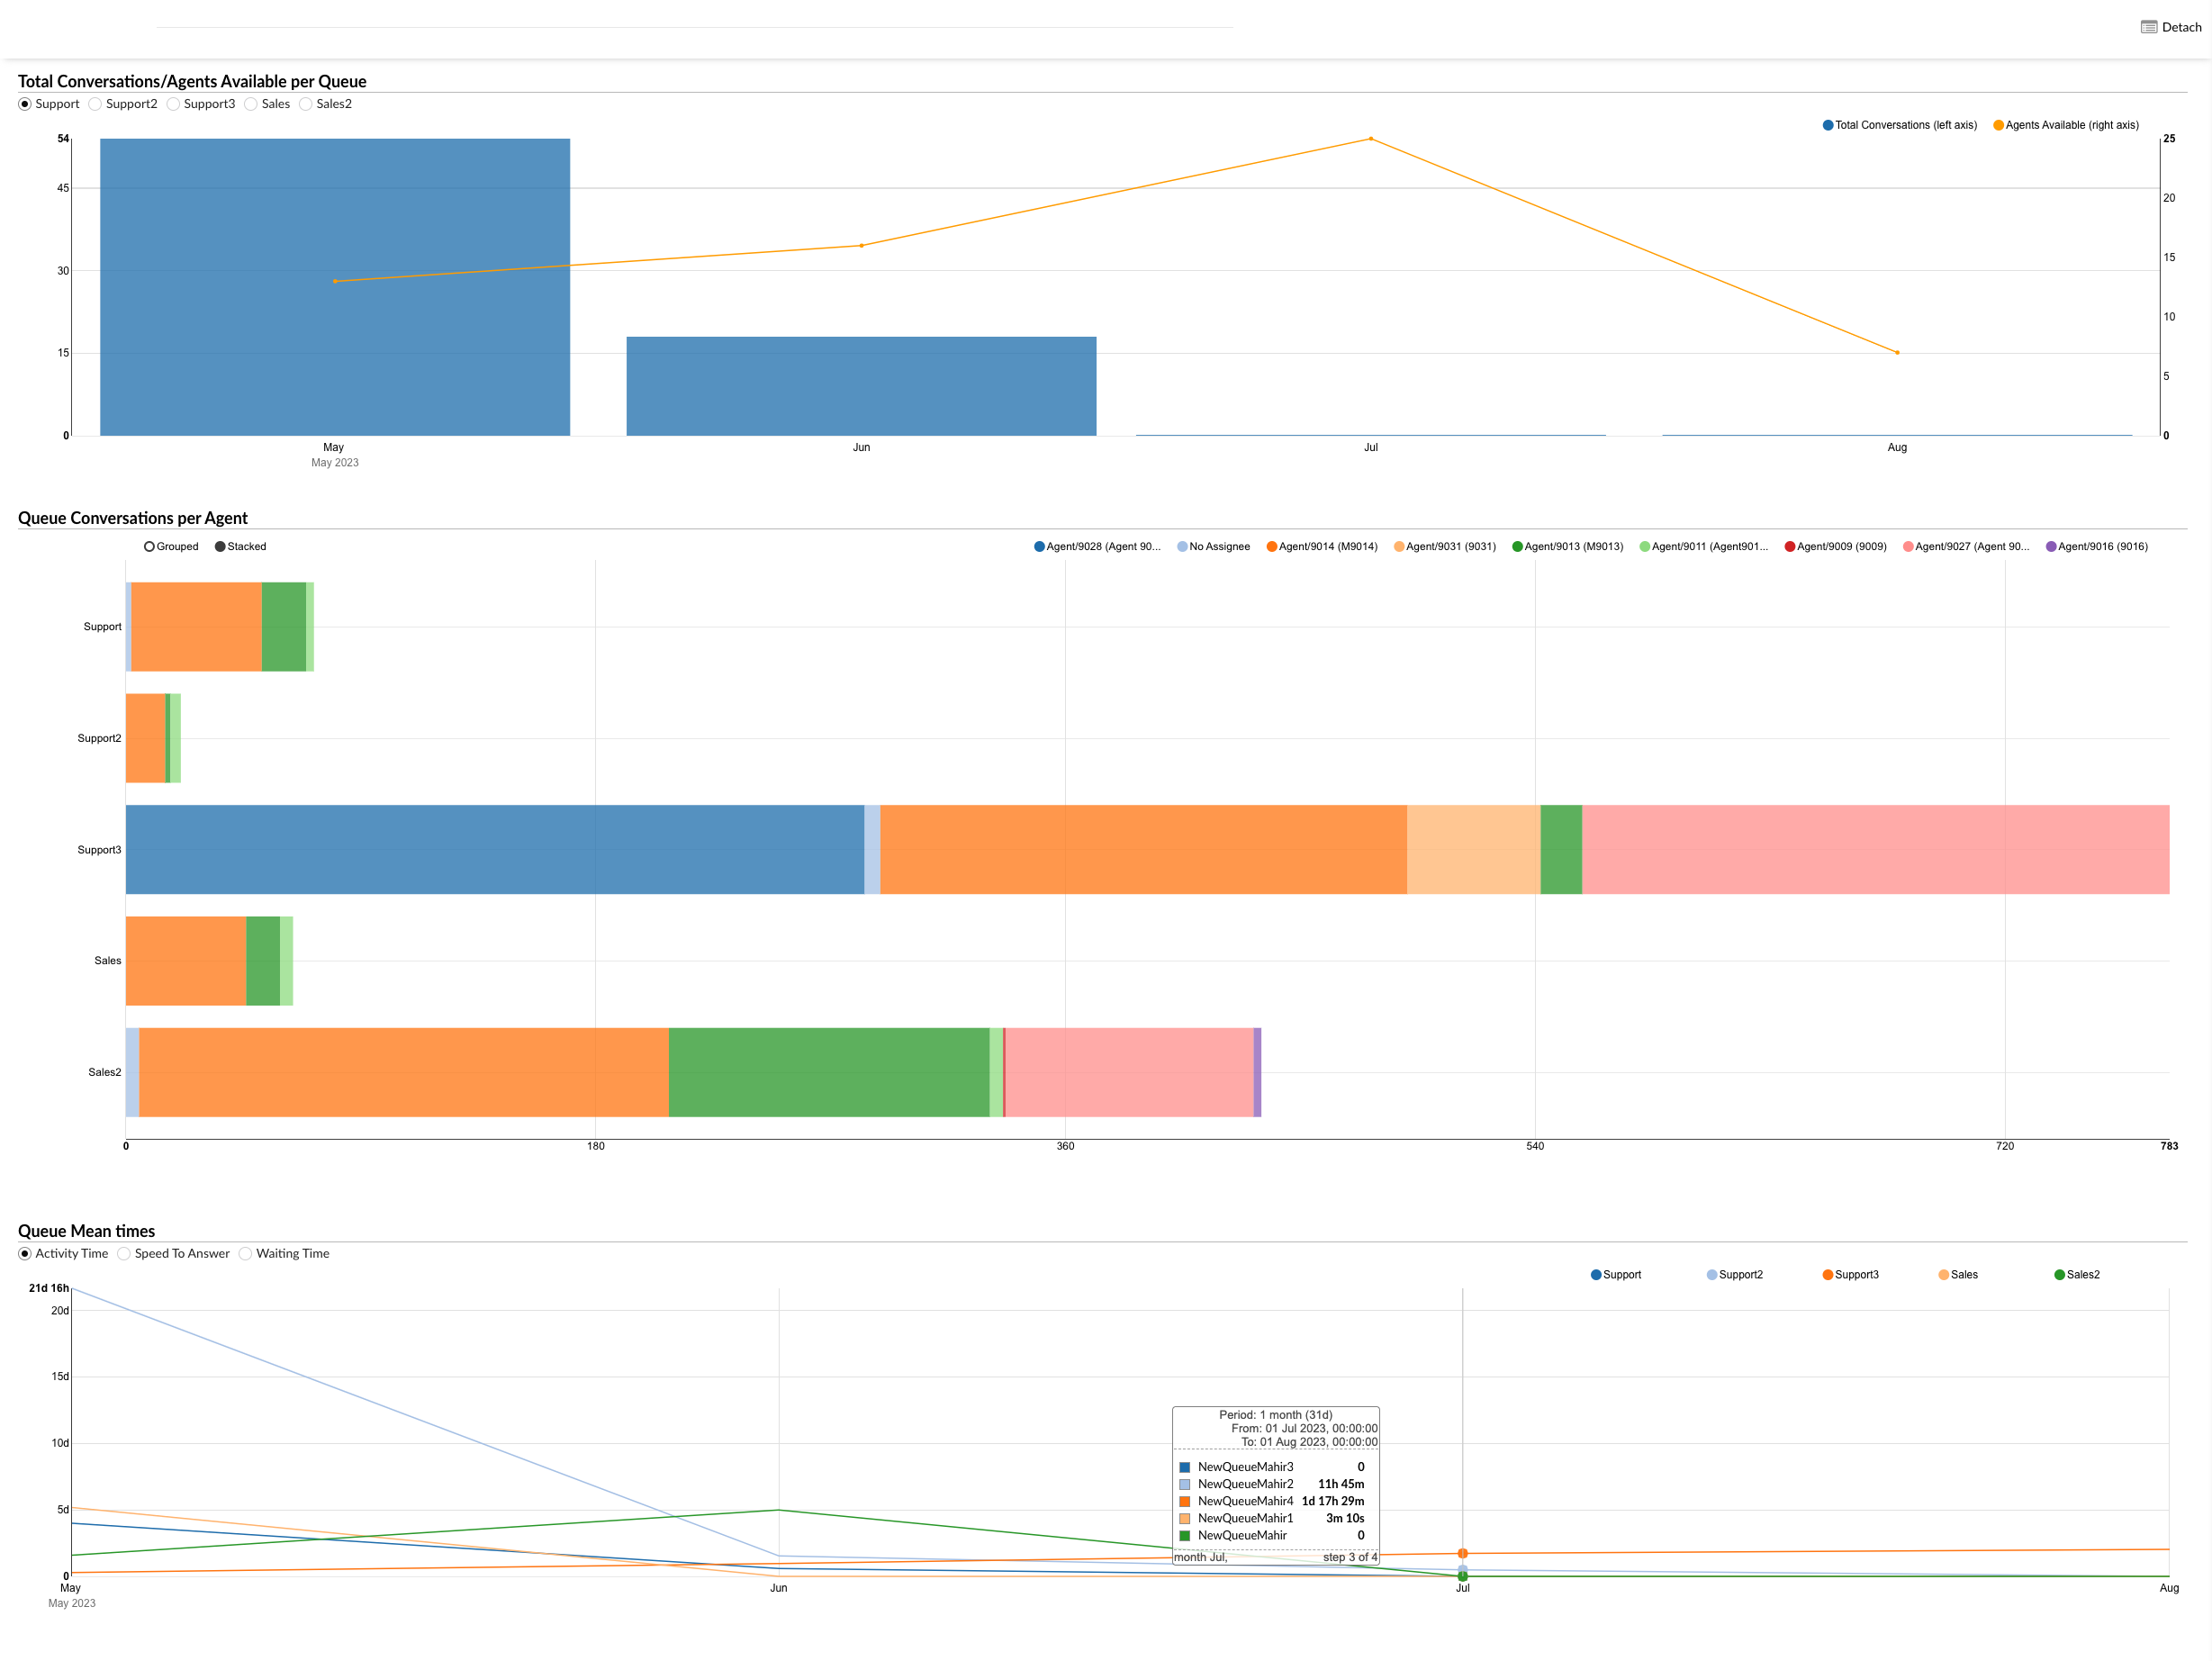
The "Chart of queue conversations by agent" provides a visual representation of the conversations handled by each agent across different queues. The chart is divided into three sections, each providing specific information about the conversations.
Total conversations/available agents per queue : this section displays horizontal bars representing the total number of conversations per queue. Next to these bars, a line chart (aligned with the left axis) indicates the number of agents available for each queue. This combined visualization makes it possible to compare the conversation volume and agent availability in each queue.
Queue conversations by agent : this section presents horizontal bars for each queue, with each bar divided into highlighted sections representing the number of conversations handled by each agent in that queue. This provides a clear view of how conversations are distributed among agents within each queue.
Average queue times : in this section, users can select specific metrics such as uptime, speed of answer and waiting time, and display them against all agents or a particular agent. This provides insight into the average time metrics for each agent, helping to identify areas for improvement and efficiency.
Using the "Queue conversations chart by agent", agents and managers can visually analyze the distribution of conversations between agents and queues, identify trends and implement strategies to improve performance and efficiency.
Loyal customers
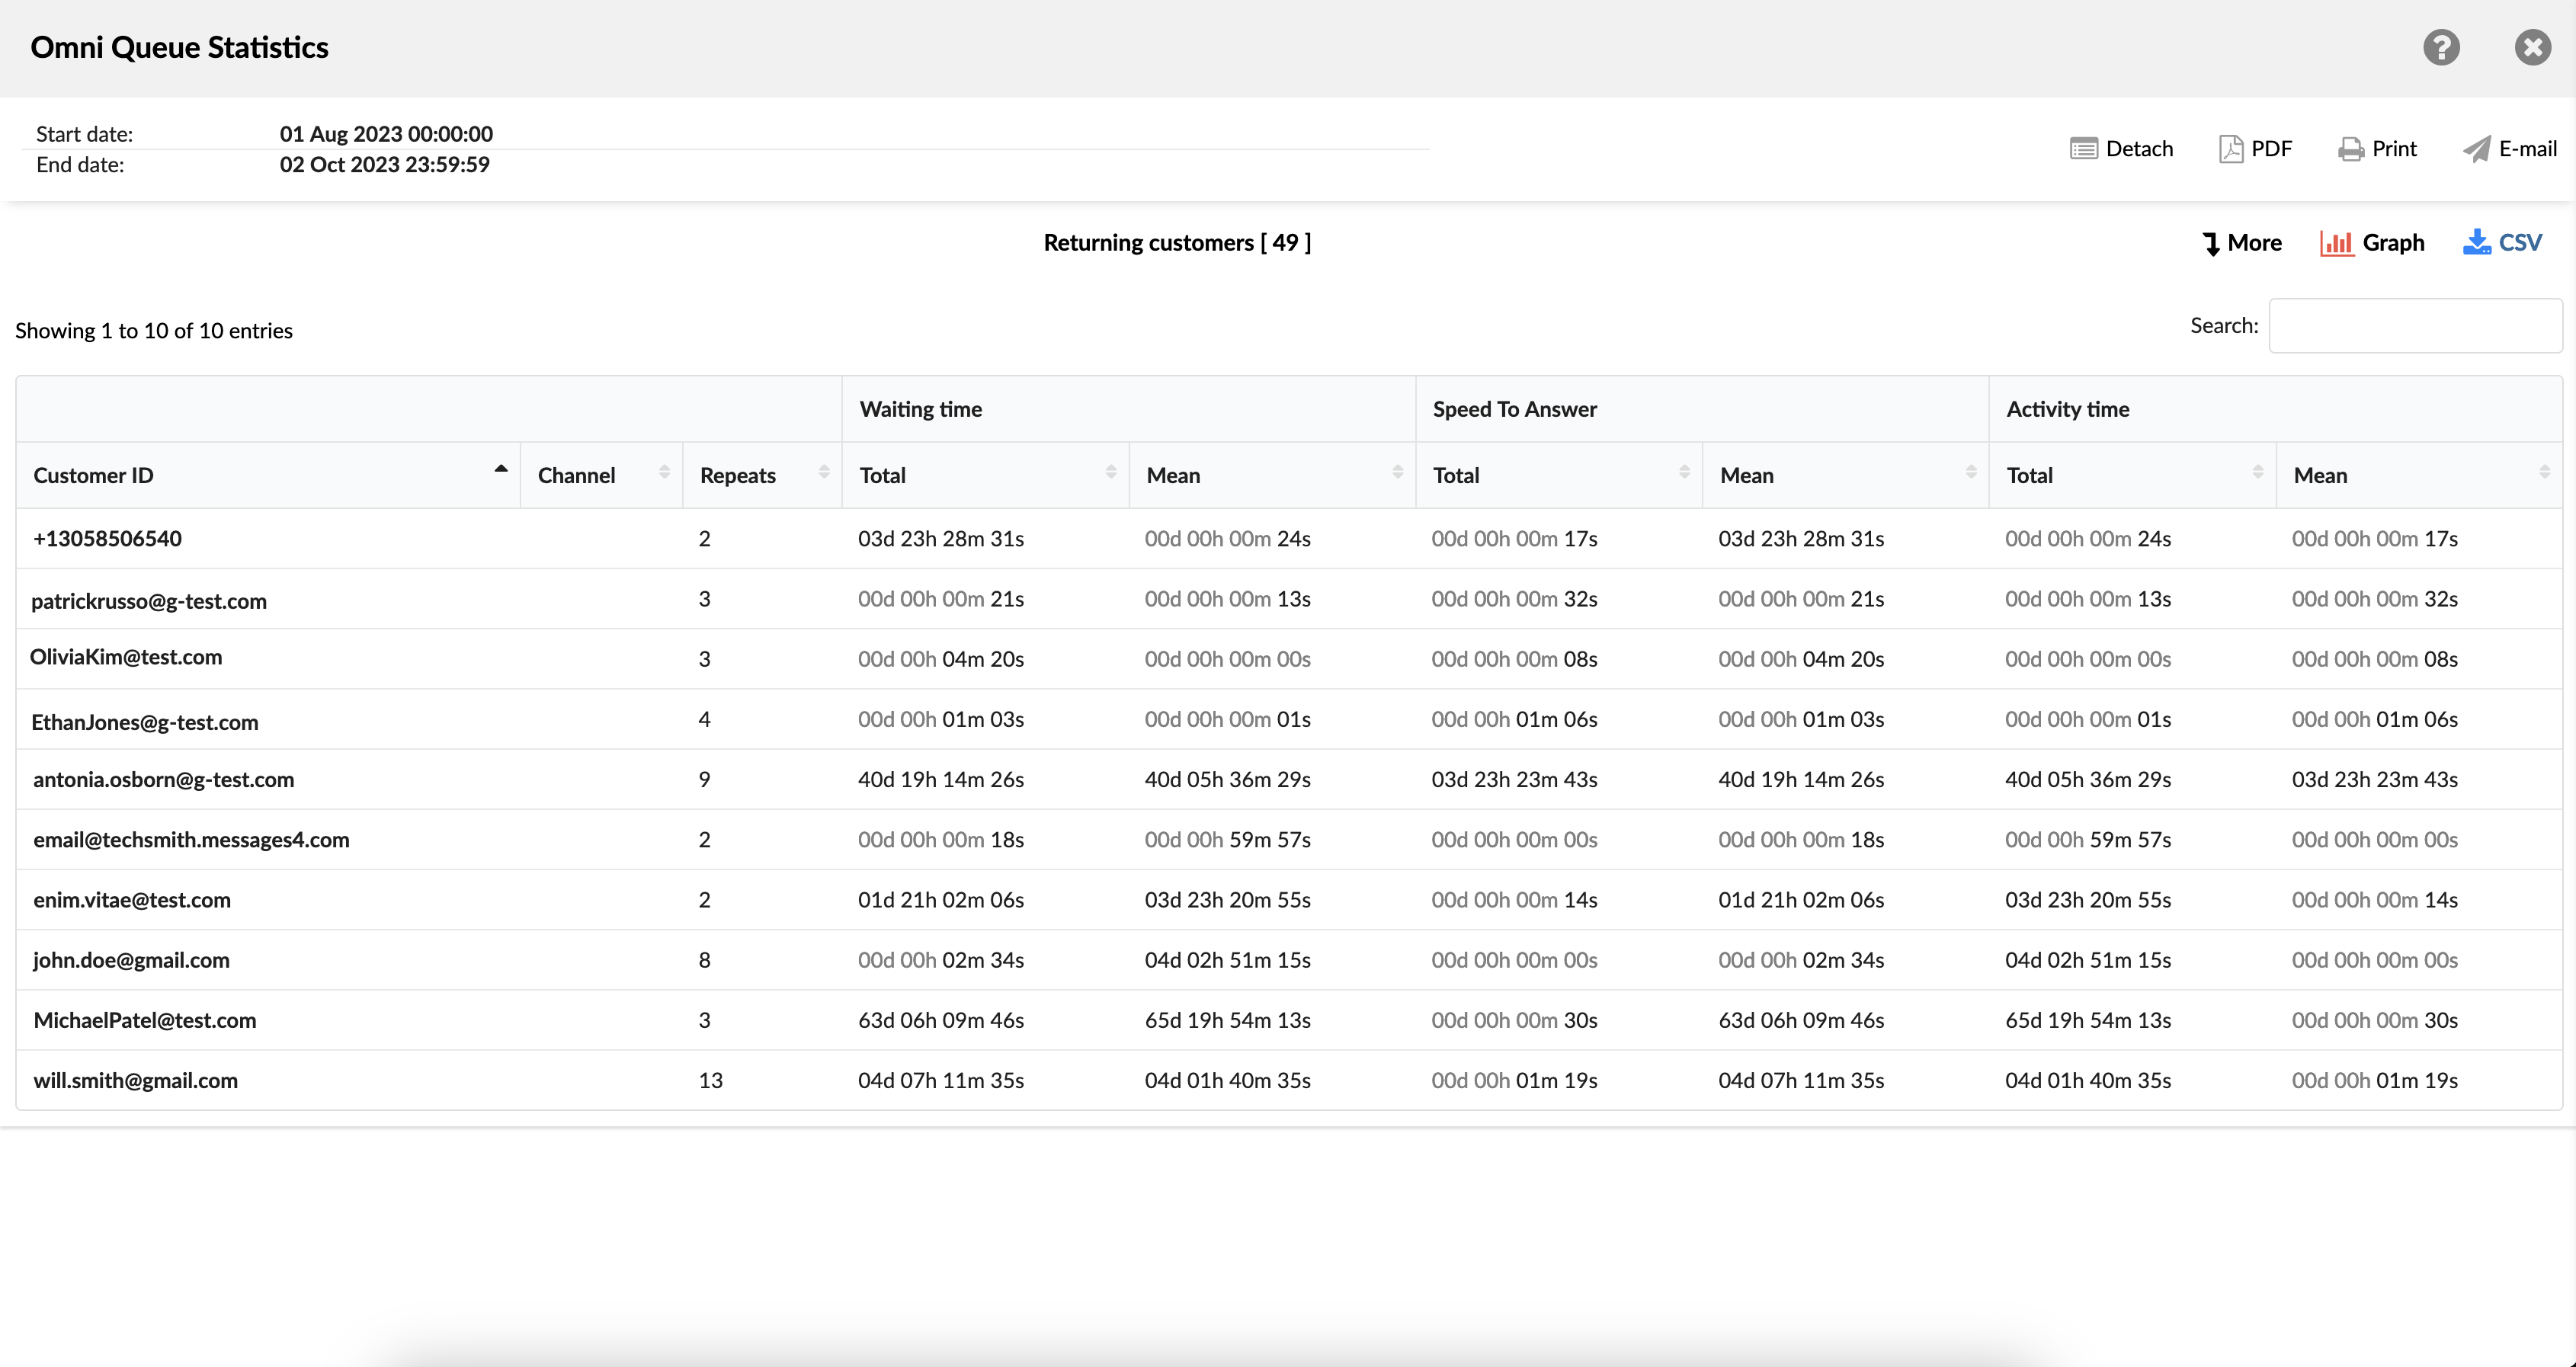
The Loyal Customers report is a business analytics document that provides information and data about customers who have used a company's services repeatedly. This report can help users understand their customers' behavior and preferences, enabling them to tailor their marketing, sales, and customer service strategies accordingly.
The report contains information about the following:
- Customer ID : this field includes a distinctive identifier for each customer, notably an extension number, an SMS number, or an email address.
- Channel : this category represents the specific communication channel used for each interaction, such as chat, email, or messaging.
- Repetitions : this metric reflects how frequently a customer initiated conversations through a particular channel.
- Wait time – divided into two sub-columns, it shows the total and average (mean) waiting time per customer for each channel.
- Answer speed : this segment provides an overview of the time needed by agents to answer each conversation, with details on the total and average durations.
- Uptime – This section is divided into “Total” and “Average” sub-columns. The “Total” sub-column gives an overview of the combined time a client spent in conversations across different channels, while the “Average” sub-column provides information about the average time invested per channel.
Loyal Customers Chart
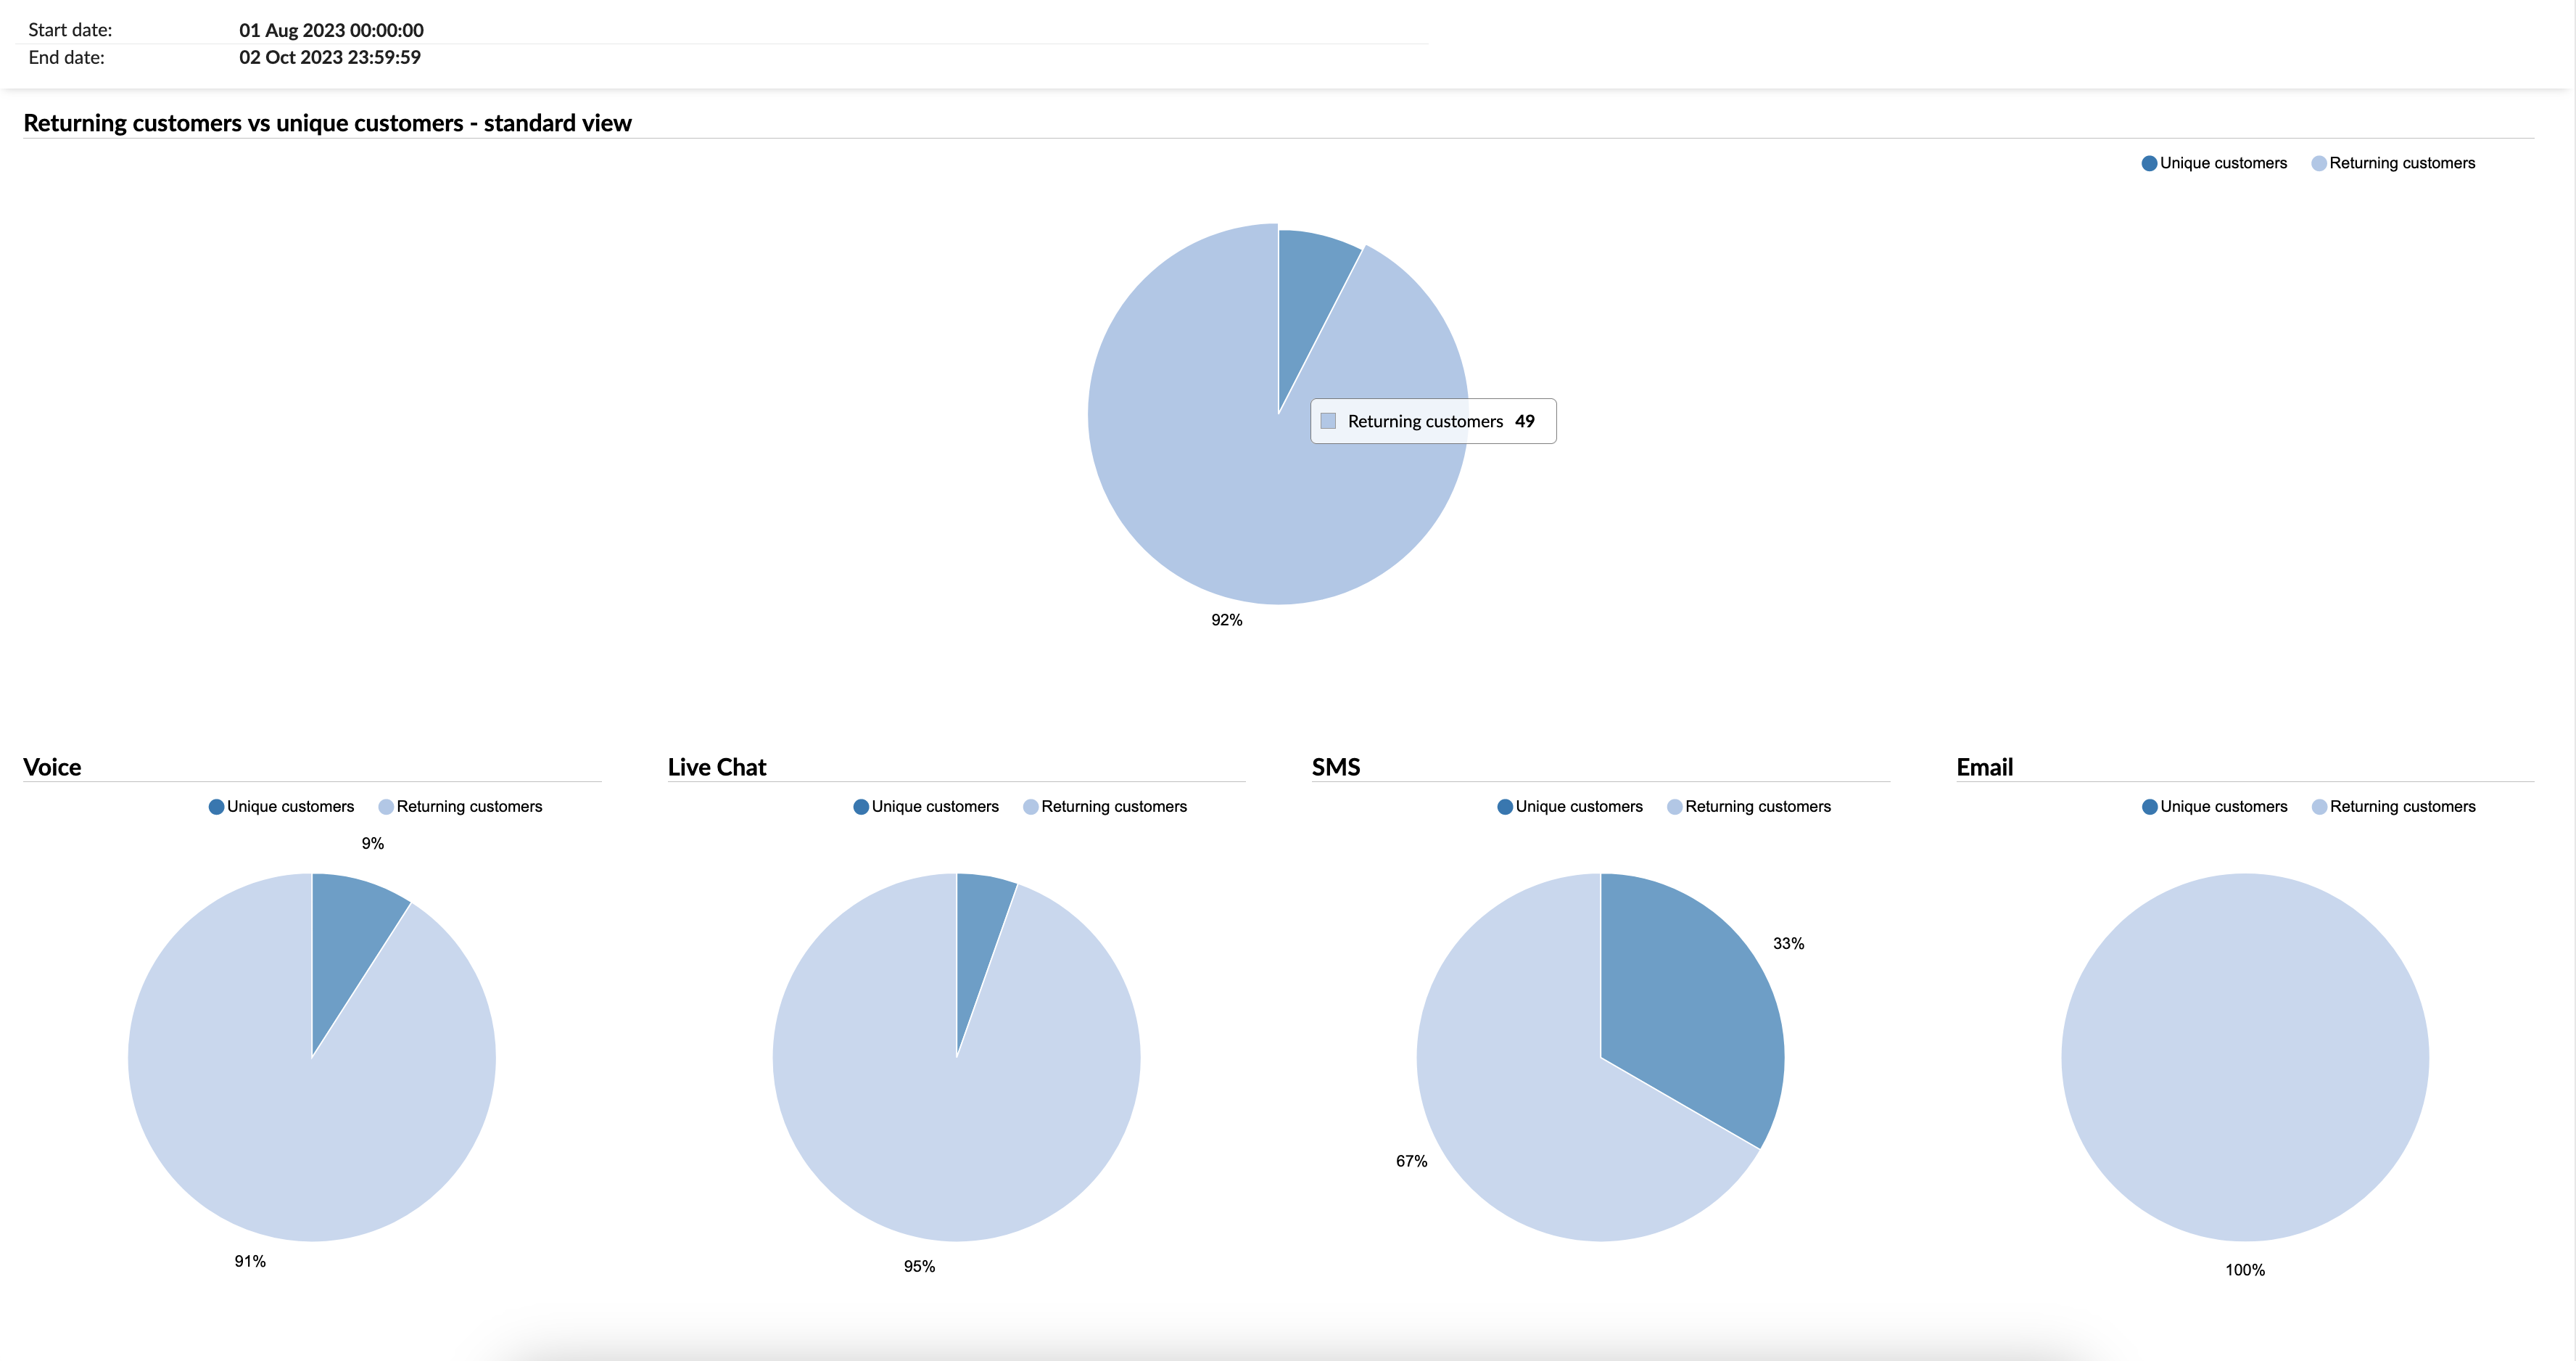
The “Returning customers” chart visually captures the distribution of loyal and one-time customers for each channel: voice, live chat, SMS and email.
Service Level Agreement (SLA) reports
The SLA report provides our customers with valuable information about the speed and efficiency of their support services. It is built around two key indicators:
First response time : this metric indicates how quickly agents acknowledge a customer's request after they ask for help. It measures the time elapsed between the moment a customer submits a request and the moment they receive a first response.
Resolution time : this metric measures the total time needed to fully handle and resolve a customer's issue. It encompasses the moment a customer makes contact with the support team and ends with the delivery of a satisfactory solution.
Service level agreement per channel
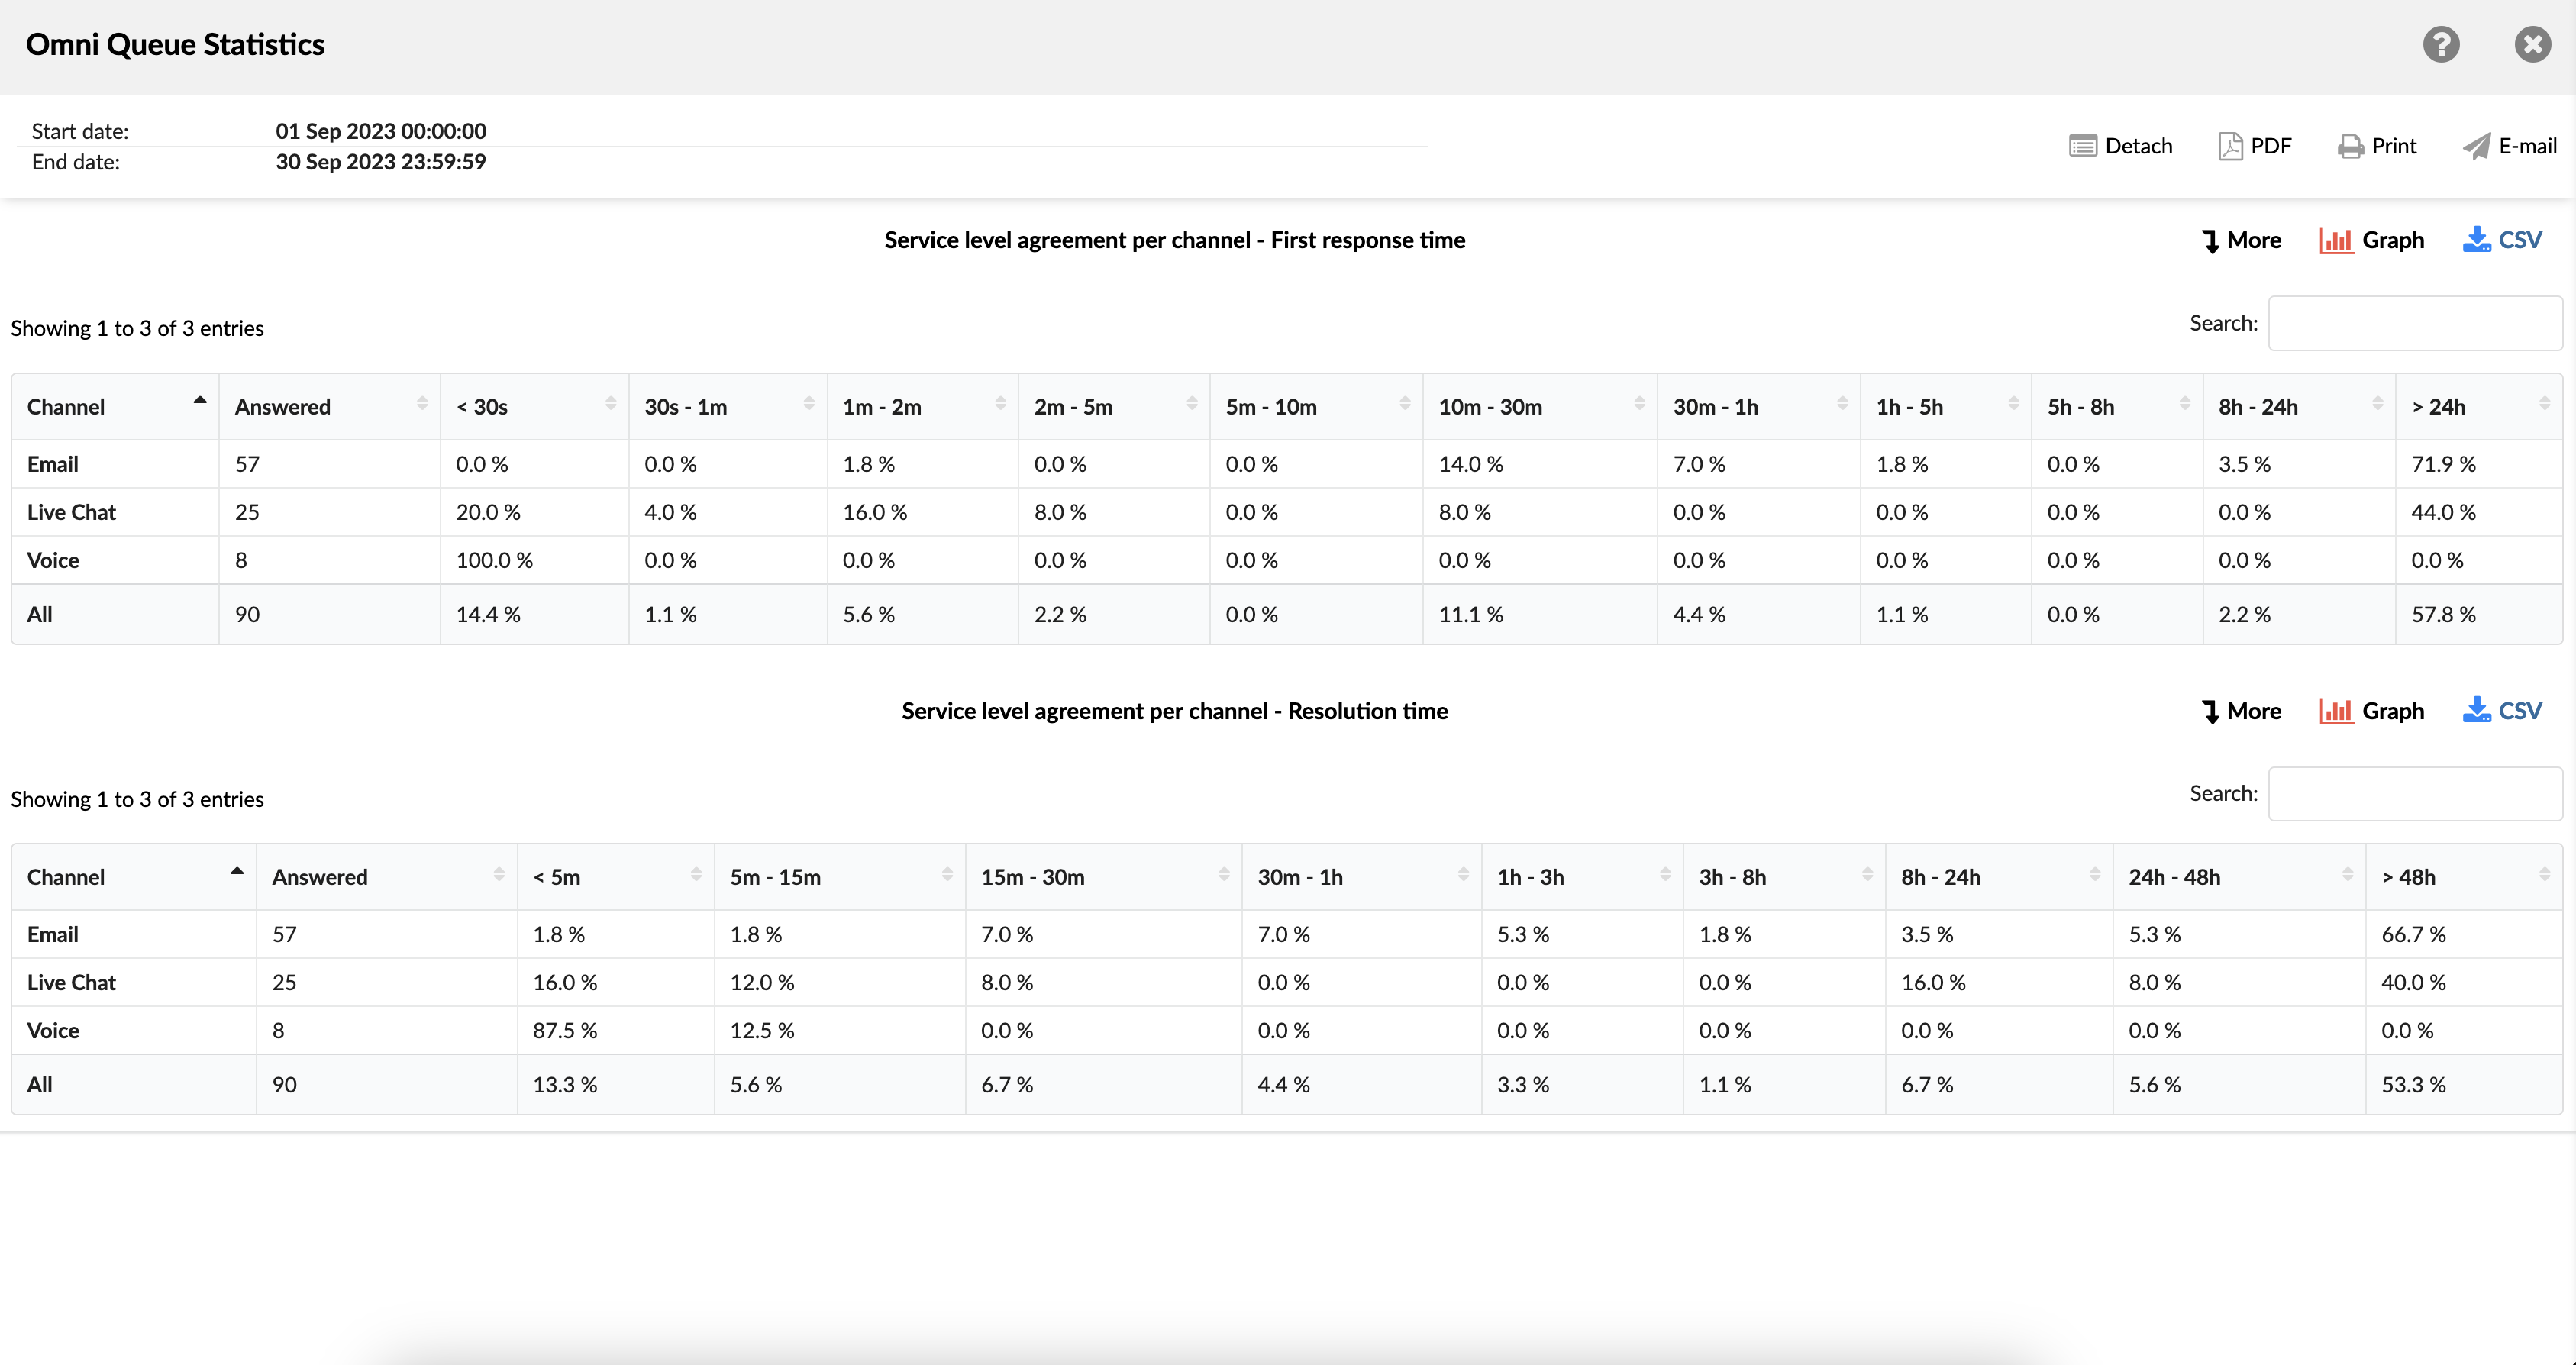
The channel-specific SLA report offers a comprehensive overview of the speed and efficiency of our customer support services tailored to different communication channels. This approach allows users to analyze and optimize support performance based on the unique attributes of each channel through which their valued customers interact with them.
The SLA by channel report contains two tables presenting the data for "first response time" and "resolution time". Each table shows:
- Channel : indicates the communication channel used for each conversation, such as voice, chat, email or messaging.
- Answered : displays the number of conversations that agents answered successfully.
- Time interval (<30 s – 1 min – 24 h> – refers to the time needed to reach the metric designated by each channel (first response or resolution).
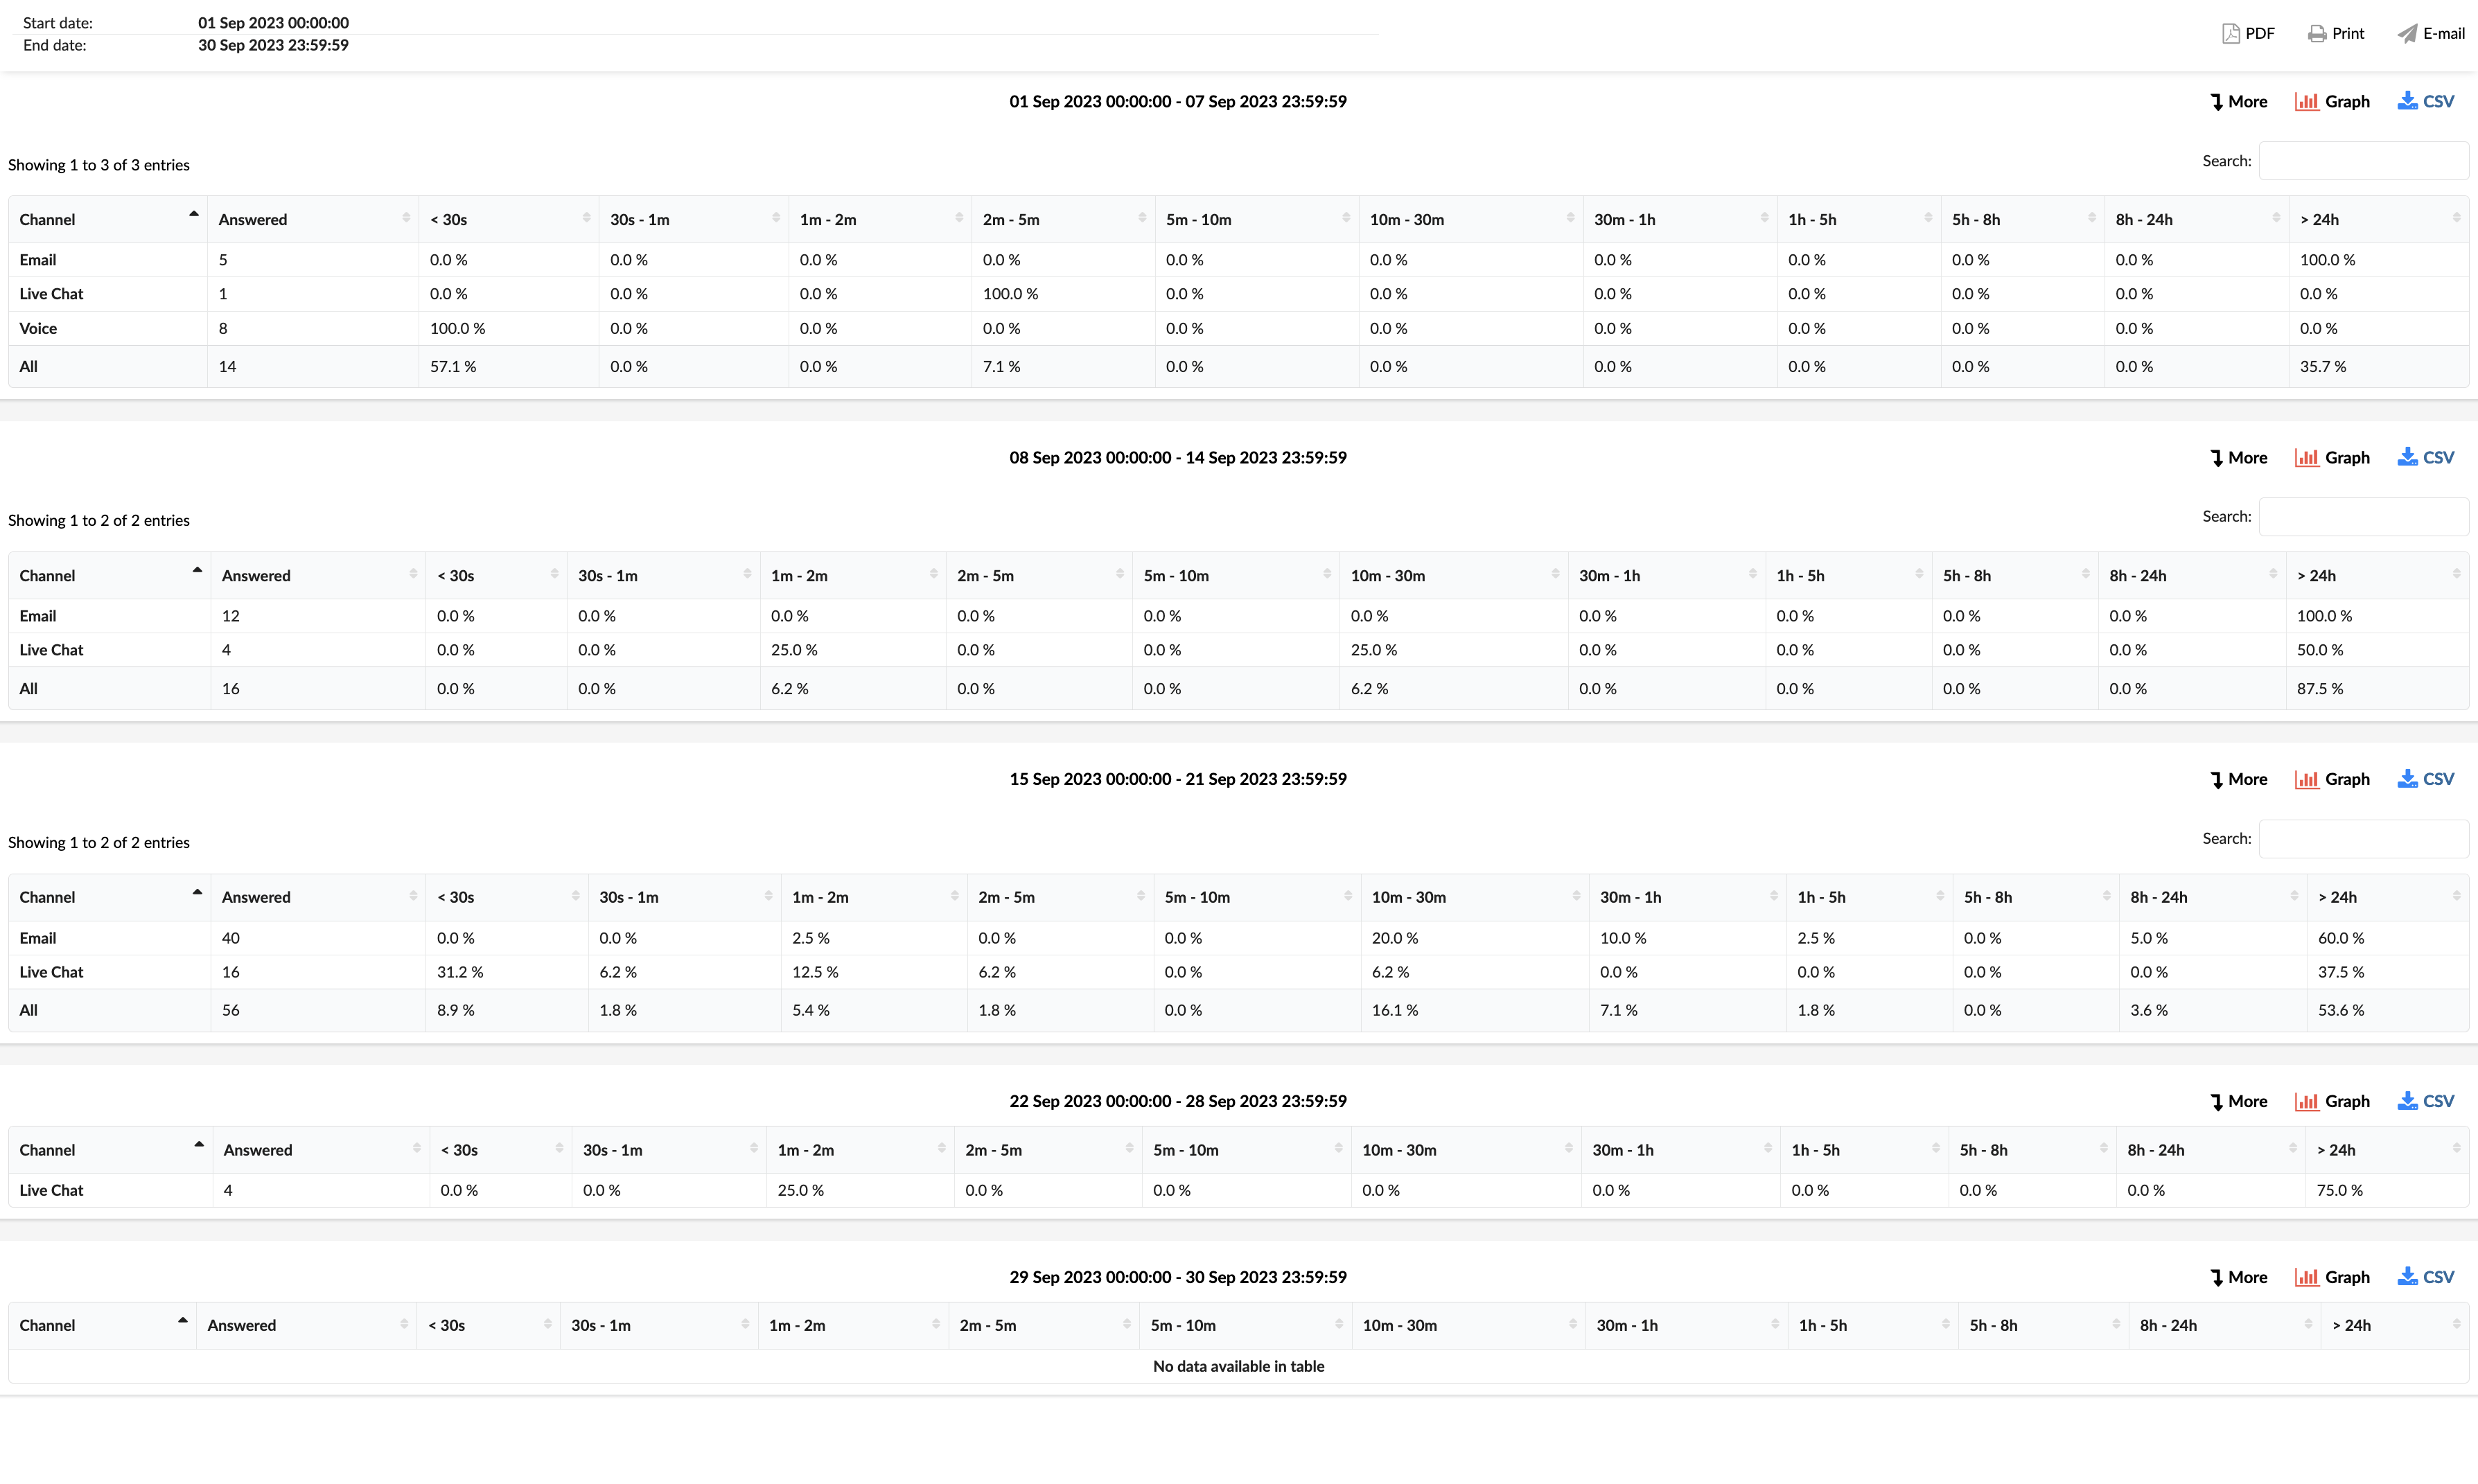
By selecting the "More" option, the report provides additional and detailed information about the SLA report.
Service level agreement per channel – First response time chart
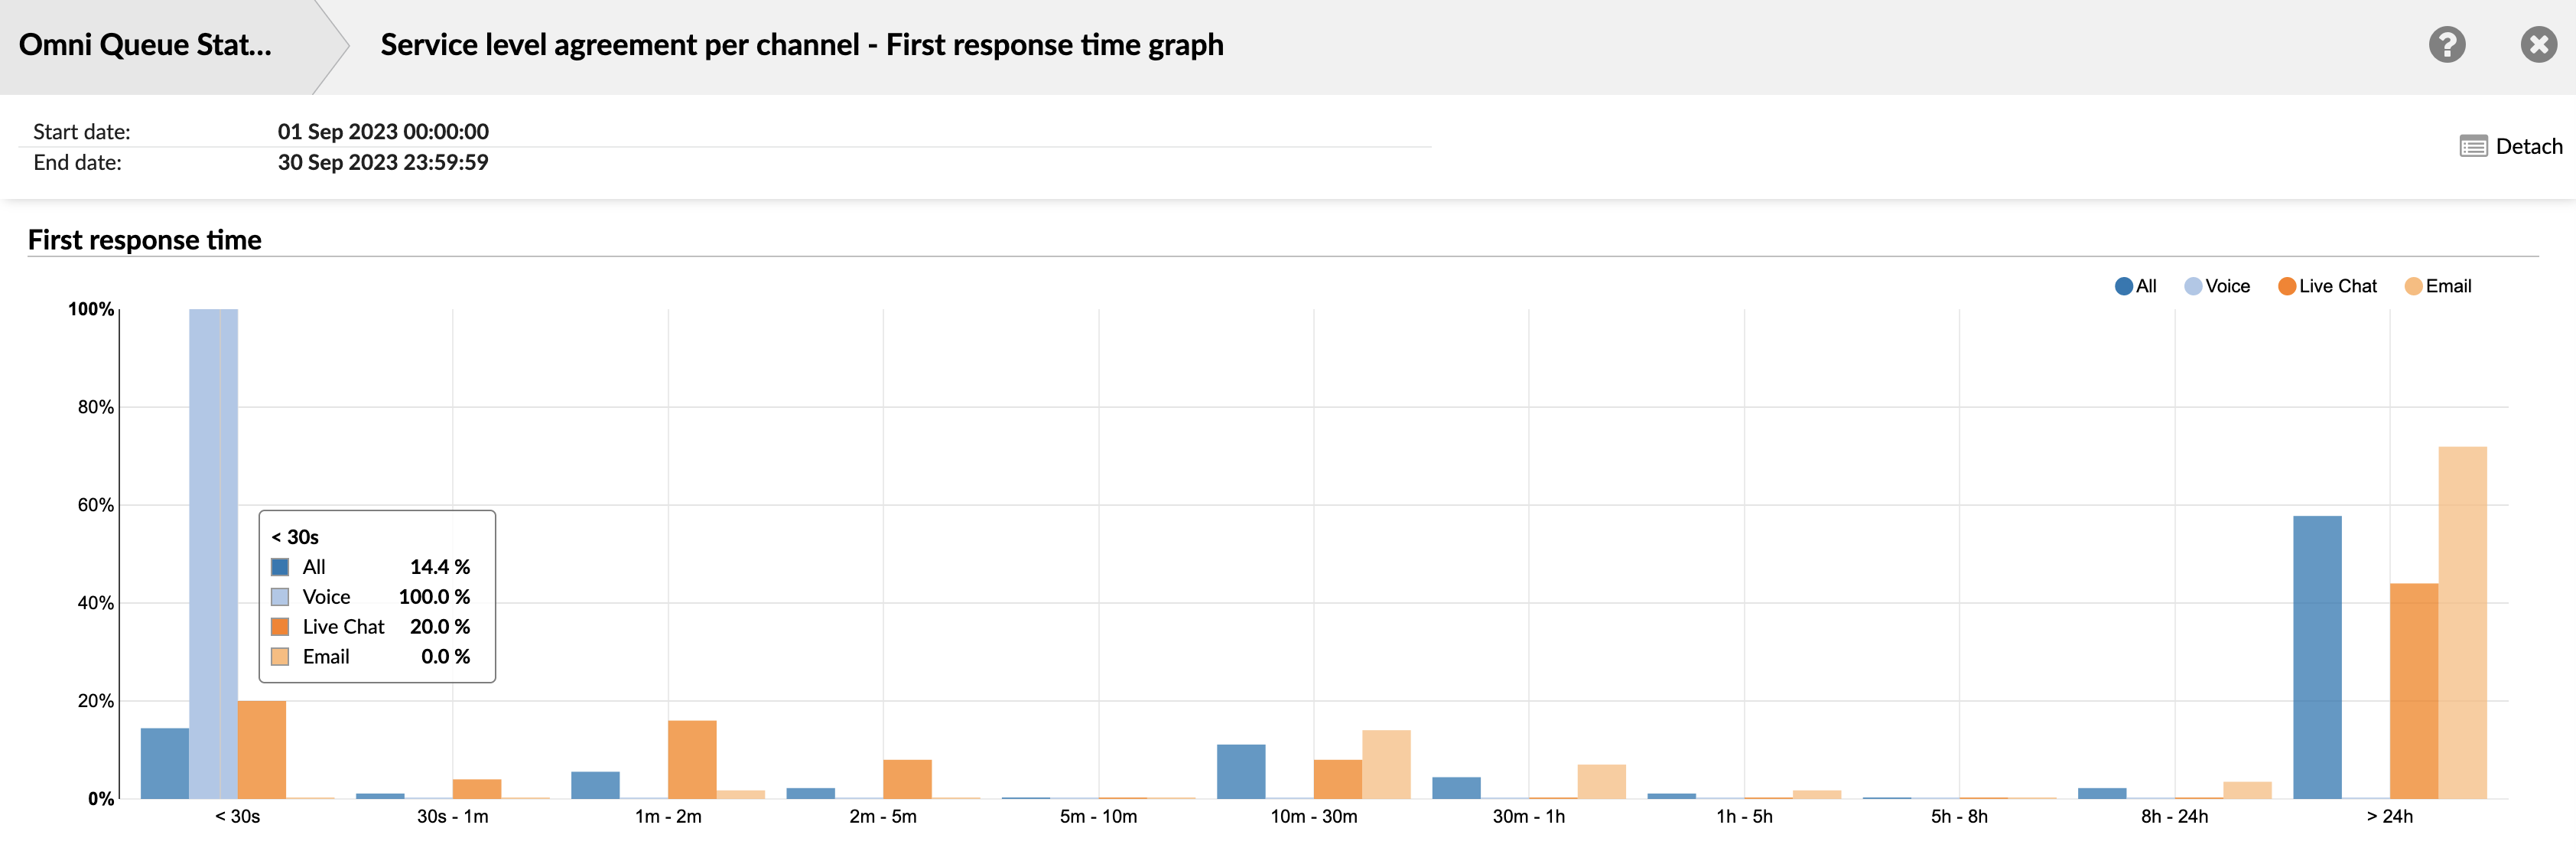
This visual representation illustrates the SLA report by channel, specifically highlighting the individual first response time for each channel (voice, live chat, SMS, and email).
Service level agreement per channel – Resolution time chart
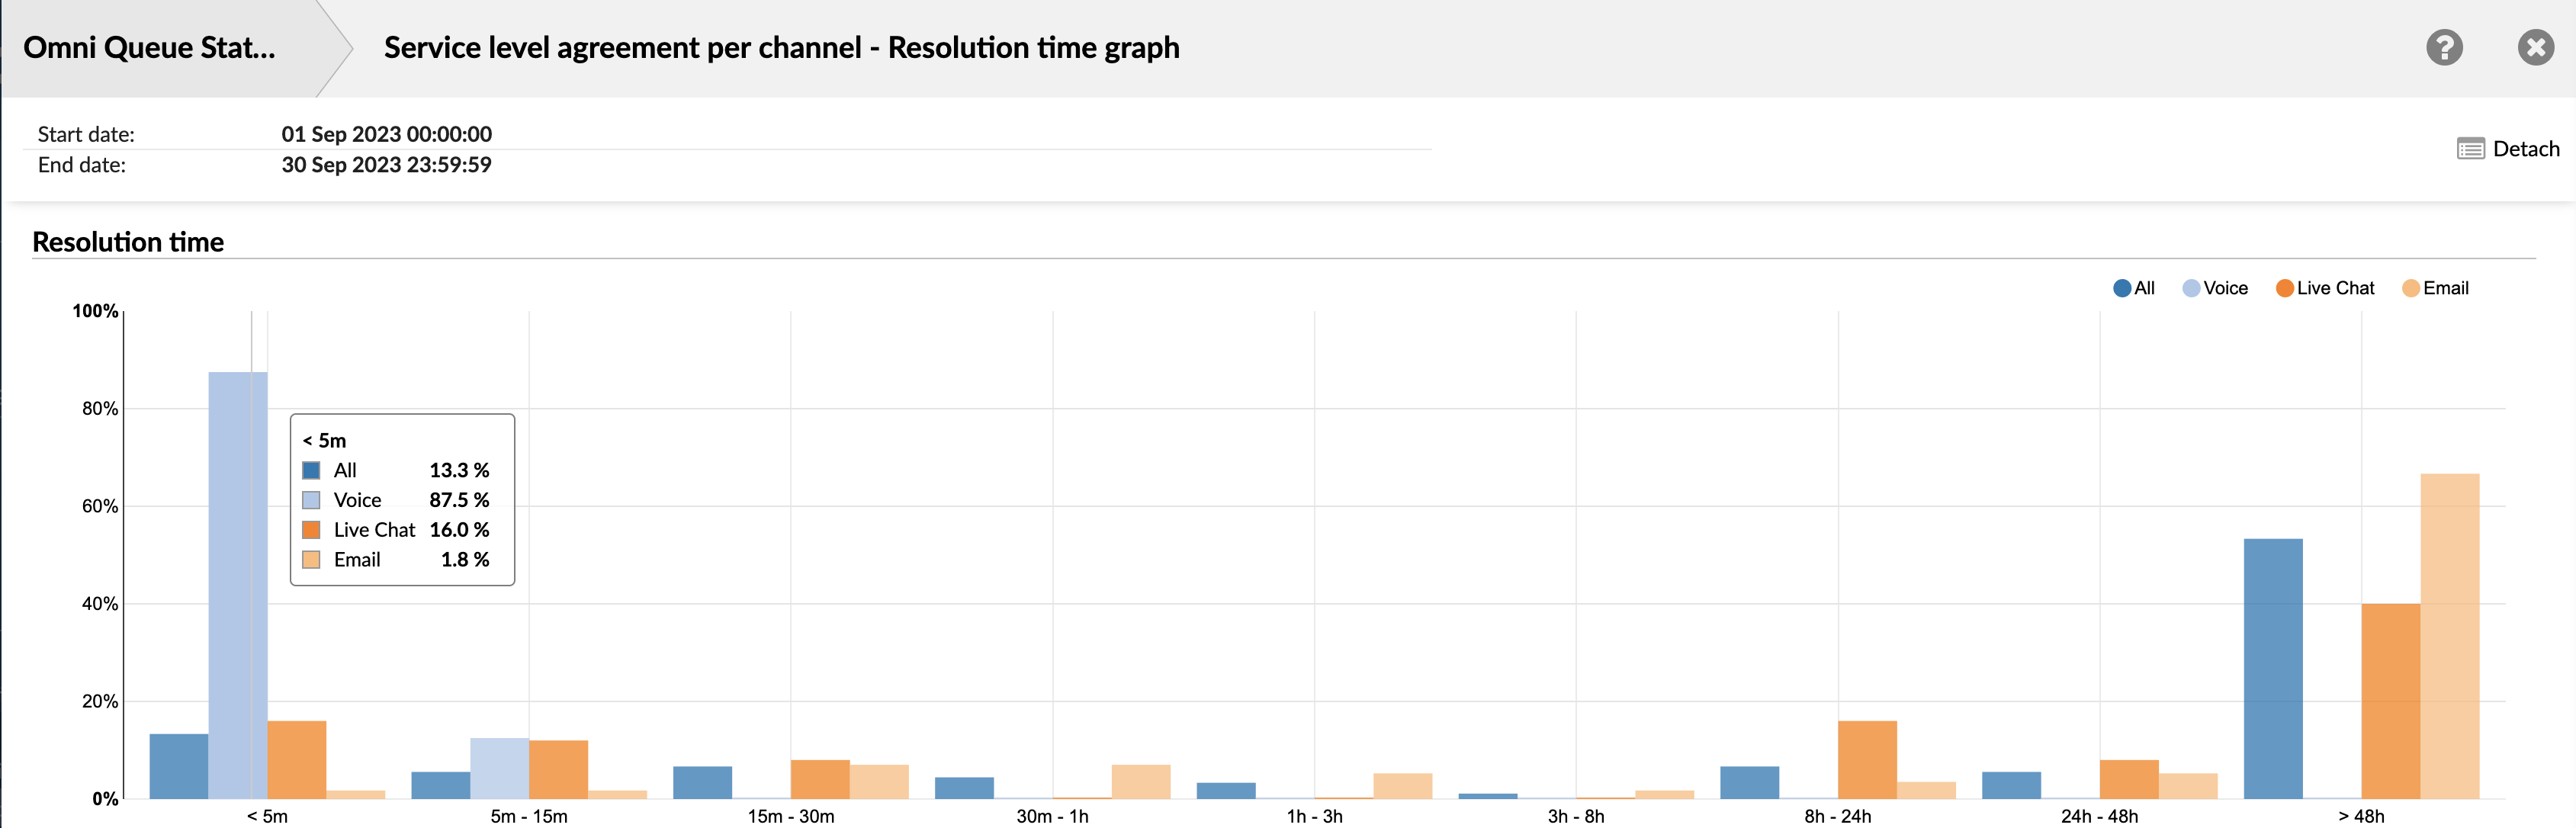
This visual representation displays the SLA report by channel, emphasizing the resolution time for each channel: voice, live chat, SMS, and email.
Service level agreement per queue
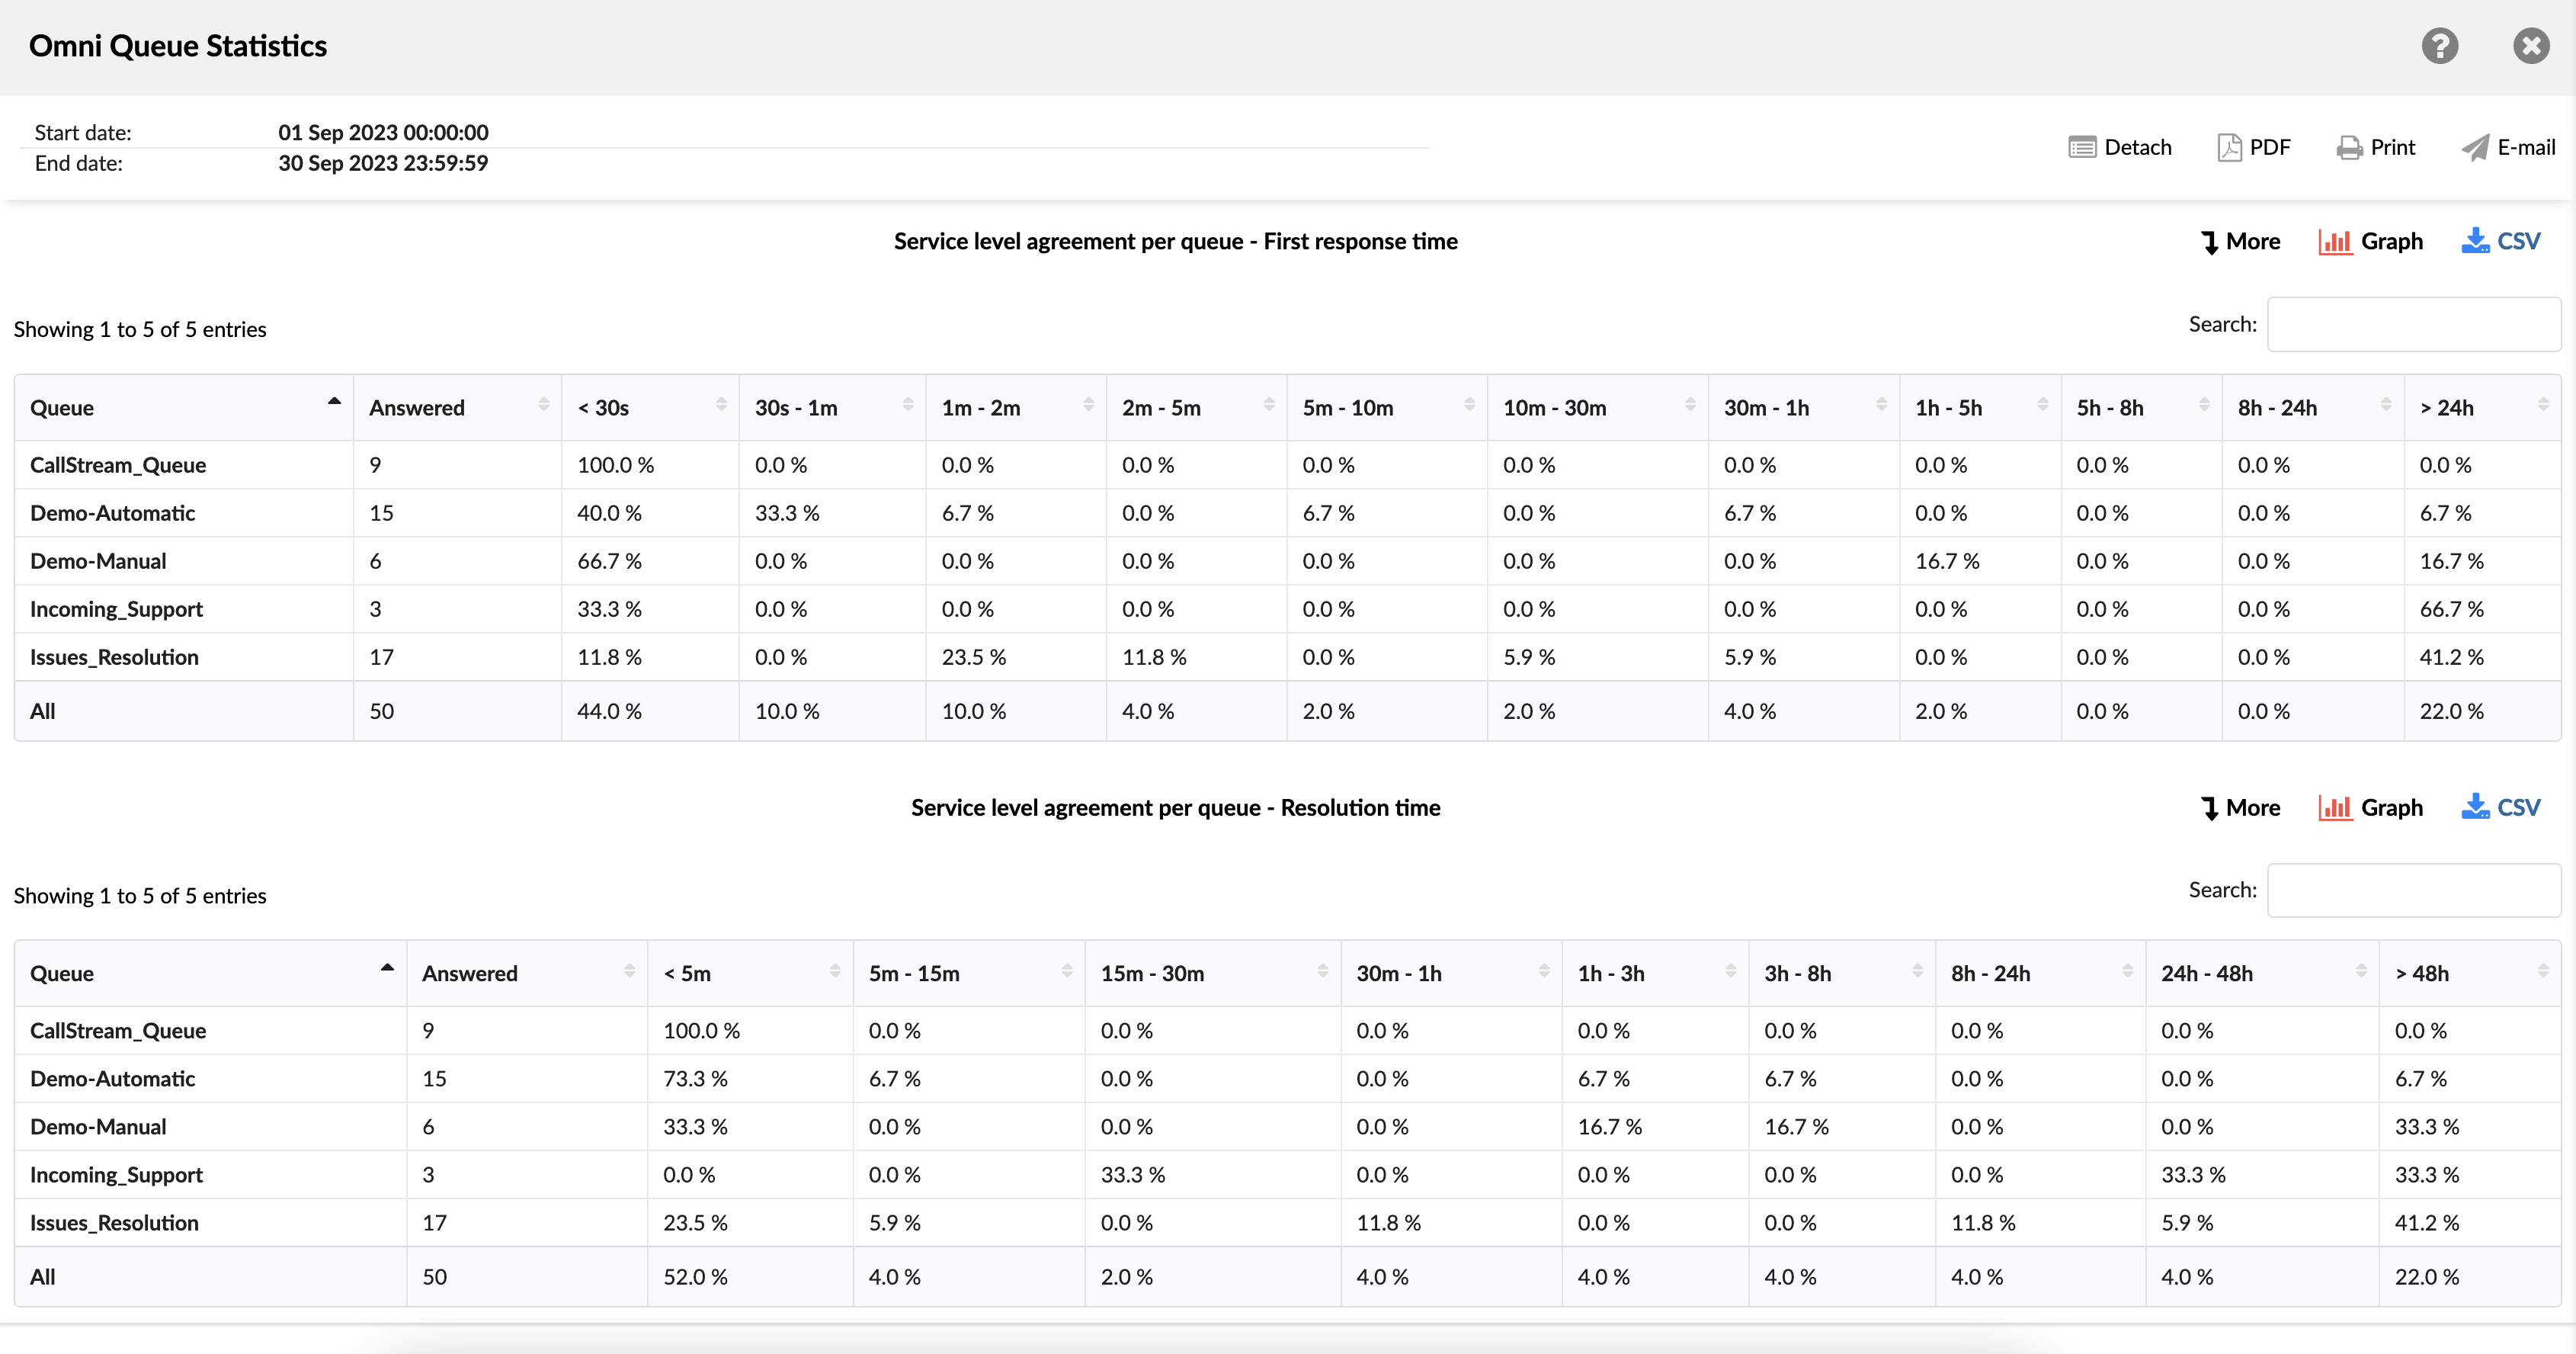
An SLA (Service Level Agreement) report per queue provides essential details and metrics on the effectiveness of support services for specific queues. The SLA report allows users to identify areas where they are performing well and areas where they need to improve.
The SLA by queue report contains two tables presenting the data for "first response time" and "resolution time". Each table shows:
- Queue – indicates the queue in which each conversation was handled.
- Answered : indicates the number of conversations that agents successfully answered.
- Time interval (<5 m – 1 h – 48 h> – refers to the time needed to reach the metric designated by each queue (first response or resolution).
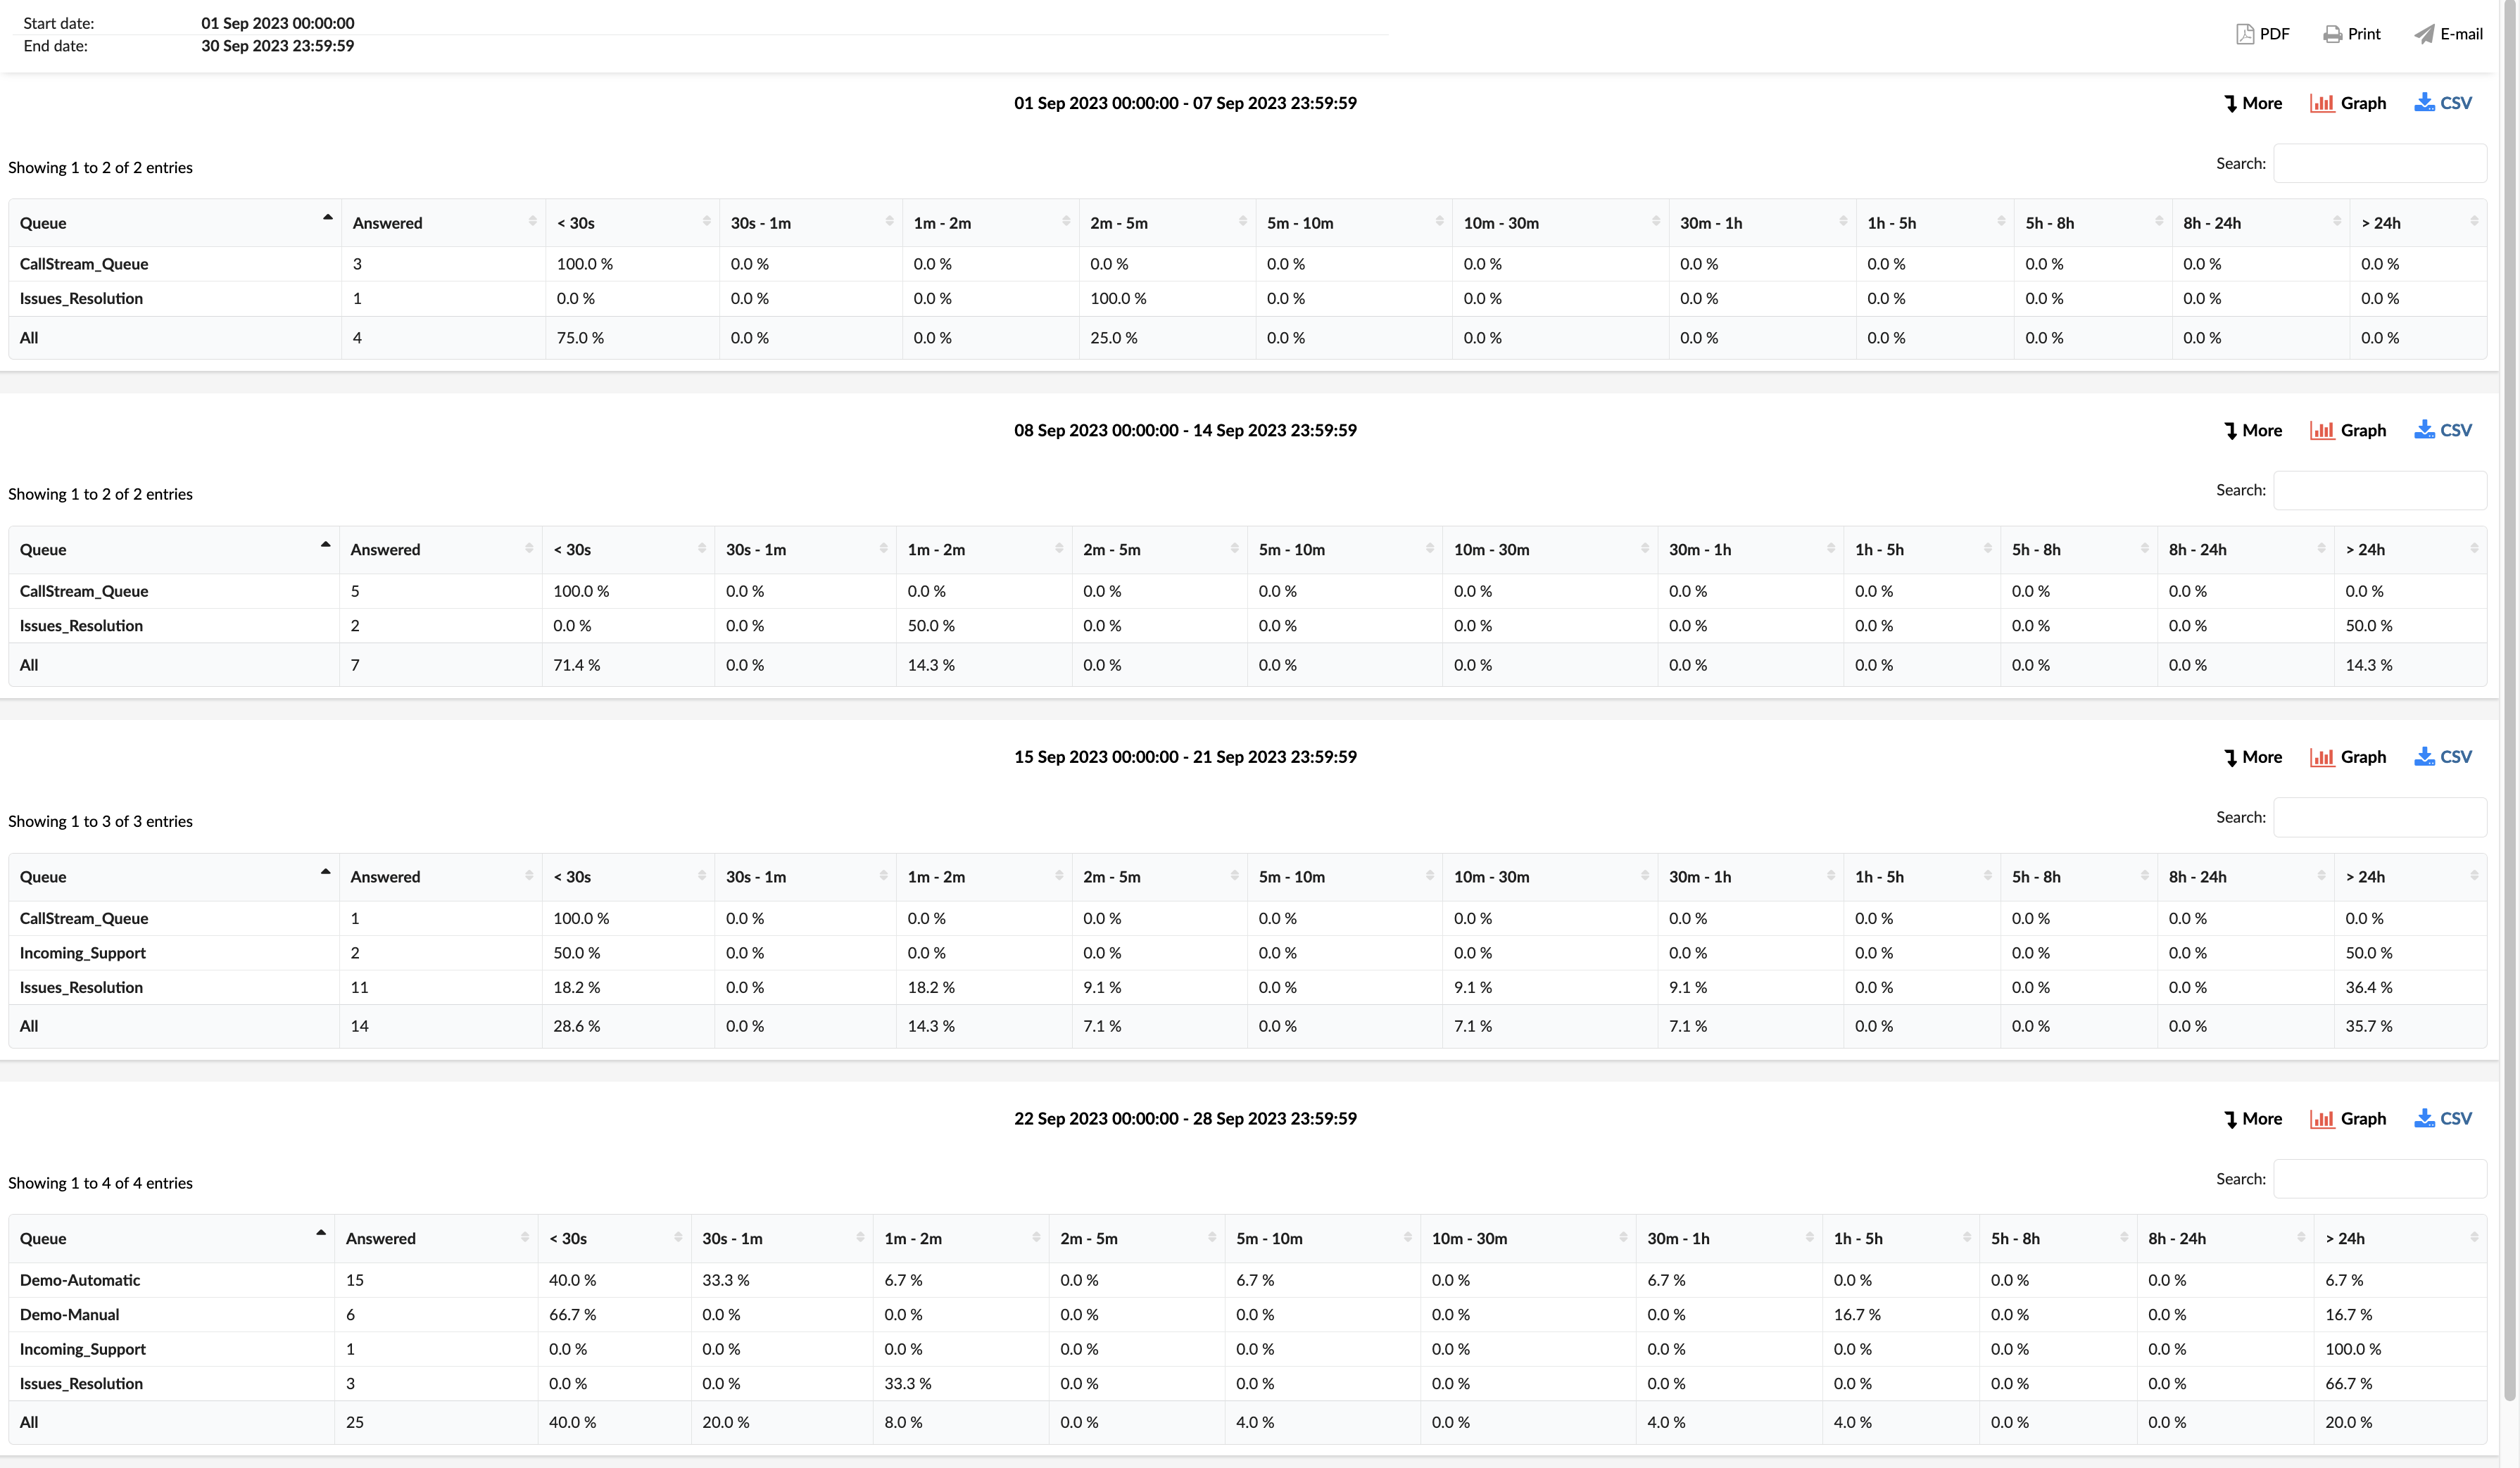
By selecting the "More" option, the report provides additional and detailed information about the SLA report.
Service level agreement per queue – First response time chart
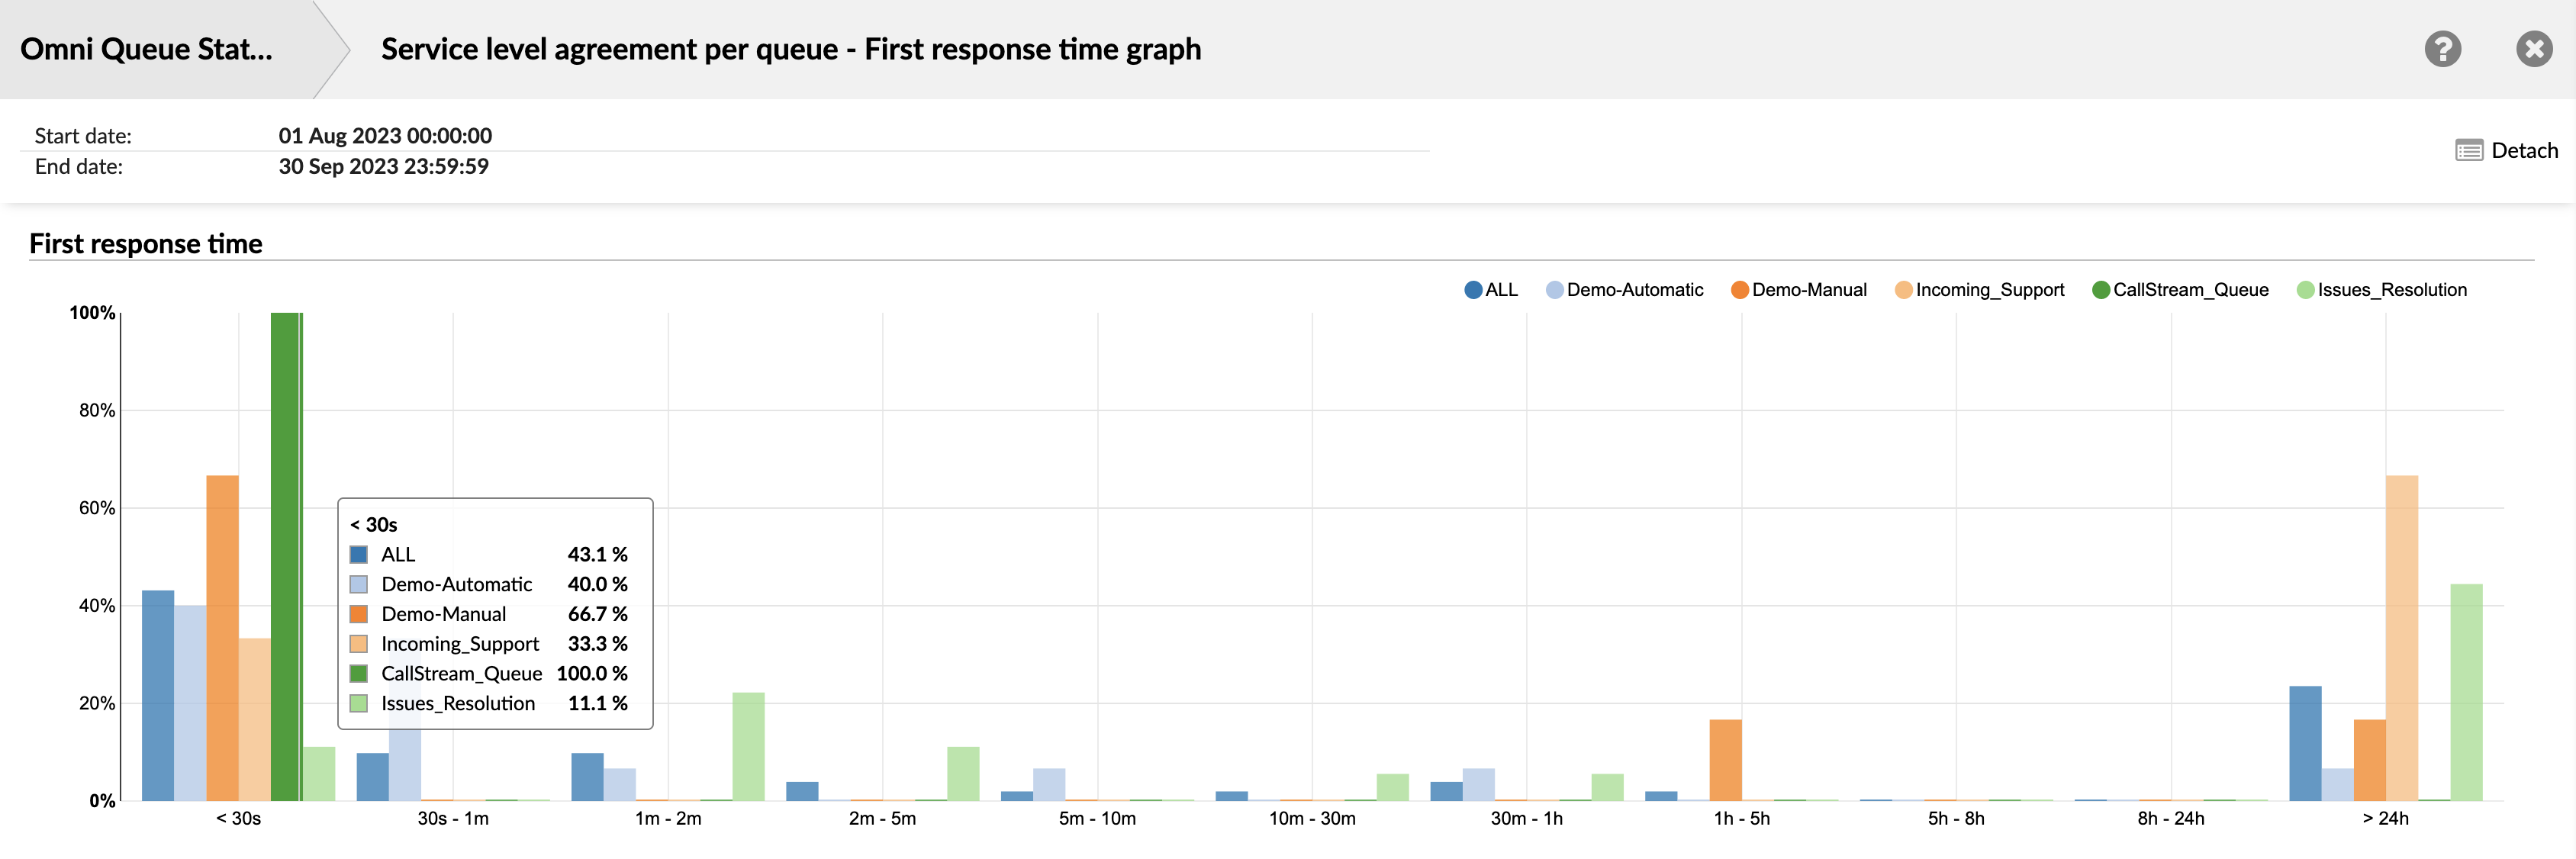
This visual representation shows the SLA report by queue, highlighting the individual first response time for each queue.
Service level agreement per queue – Resolution time chart
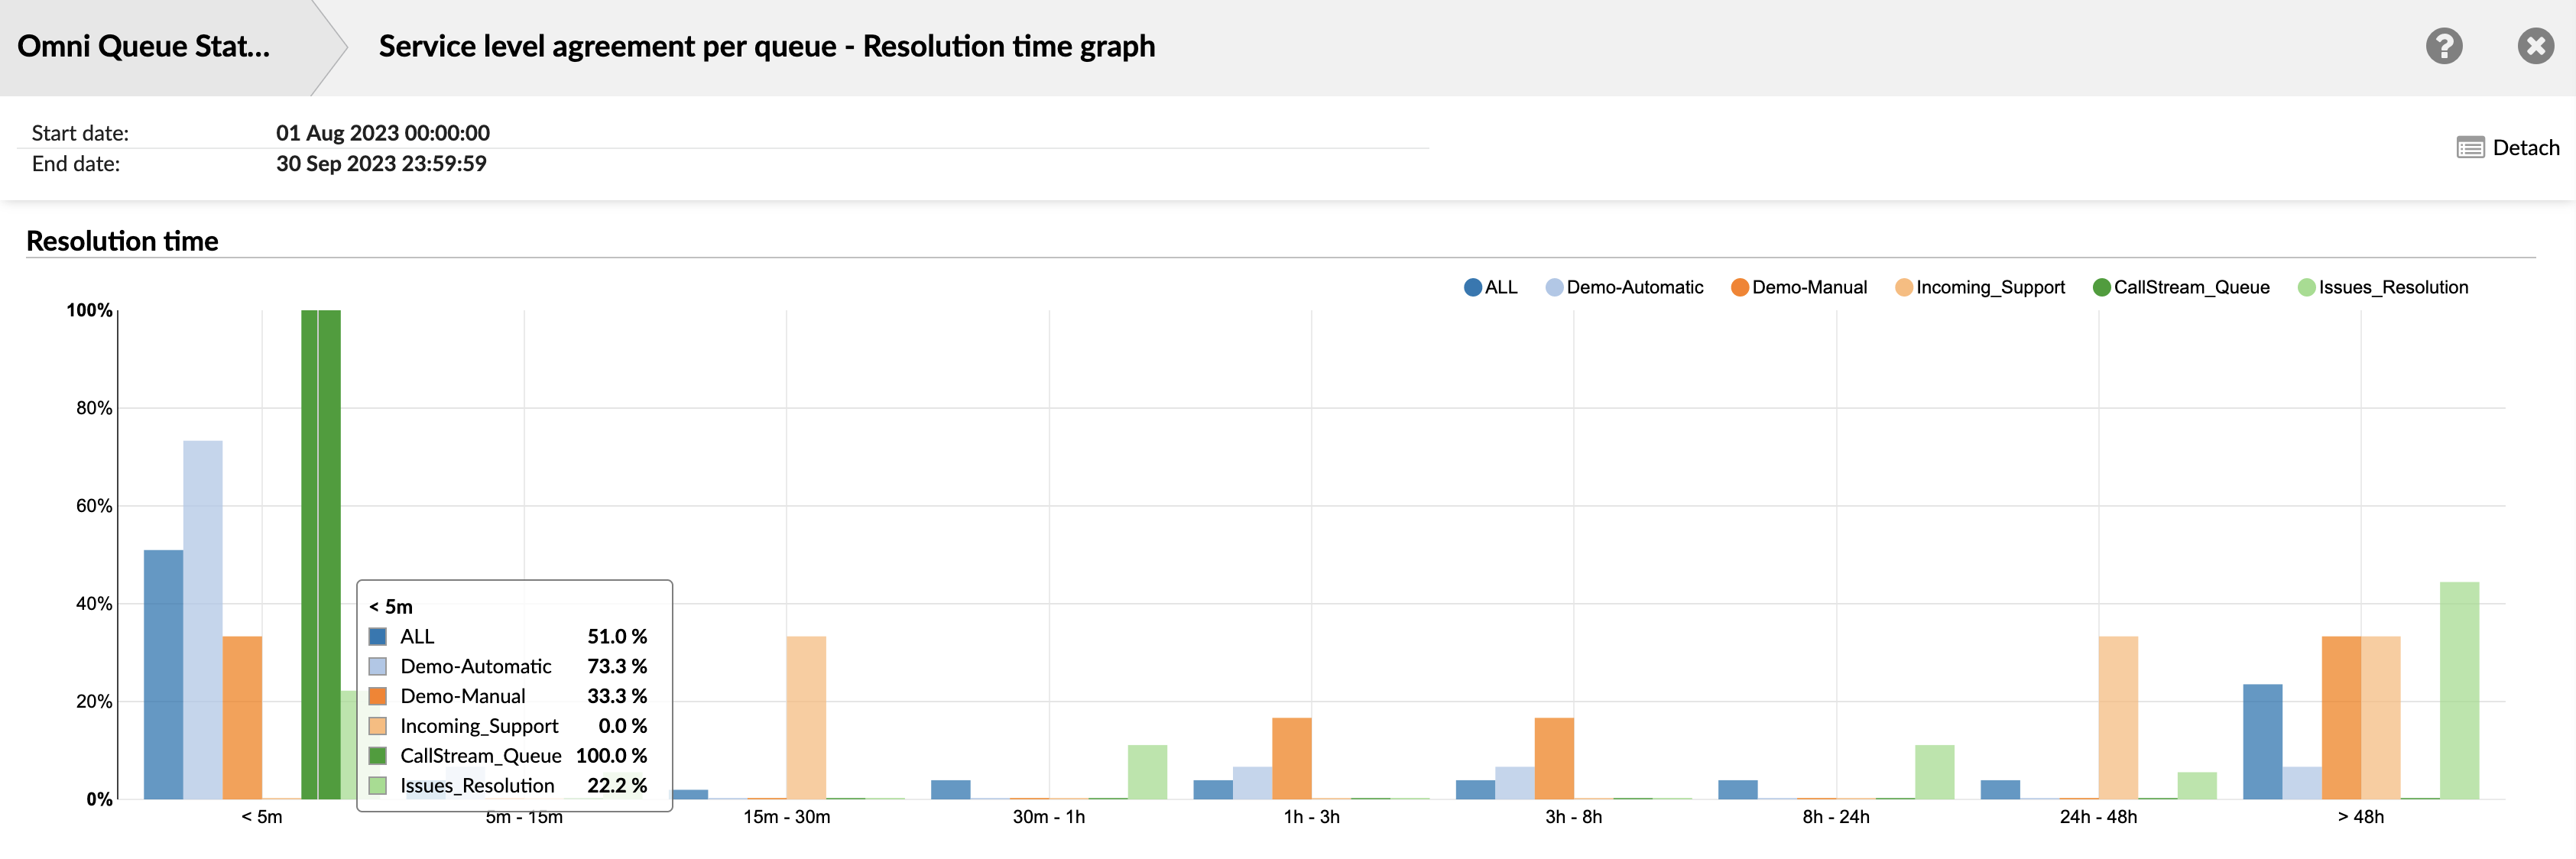
This visual representation shows the SLA report by queue, highlighting the resolution time for each queue.
Unanswered conversations by channel
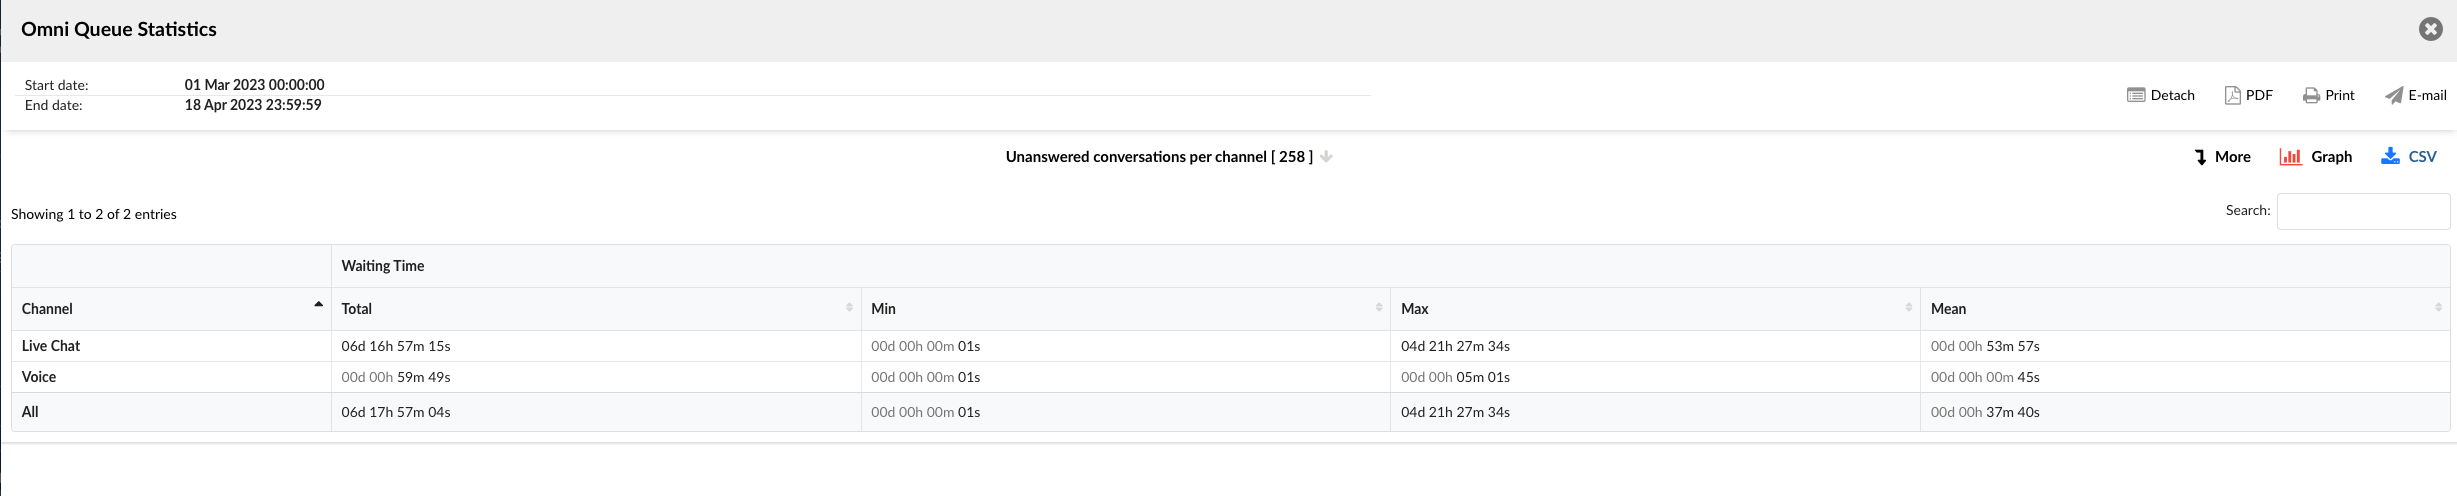
The “Unanswered Conversations by Channel” section provides a detailed overview of unanswered conversations across different communication channels. This section is organized into two main columns:
Channel
This column lists the different communication channels, such as email, live chat, SMS, voice, and all. Each row represents a different channel, allowing you to display and compare the data of each channel separately.
Wait time
This column provides detailed information on the wait time of unanswered conversations in each channel. It is then divided into four sub-columns:
Total : This sub-column displays the total waiting time for all unanswered conversations in the corresponding channel. This gives you an overall idea of how long customers wait before their conversations go unanswered.
Min : This sub-column displays the shortest waiting time among all unanswered conversations in the corresponding channel. This helps you understand the best-case scenario for waiting times in each channel.
Max : This sub-column displays the longest waiting time among all unanswered conversations in the corresponding channel. This helps you understand the worst-case scenario for waiting times in each channel.
Average : This sub-column displays the average waiting time of all unanswered conversations in the corresponding channel. This gives you a general idea of the typical waiting time a customer may encounter on each channel before their conversation goes unanswered.
The “Unanswered Conversations by Channel” section is a powerful tool for understanding and improving response times across the various communication channels. It allows managers to identify trends, make informed decisions, and implement strategies to improve customer service and efficiency.
Unanswered conversations by channel
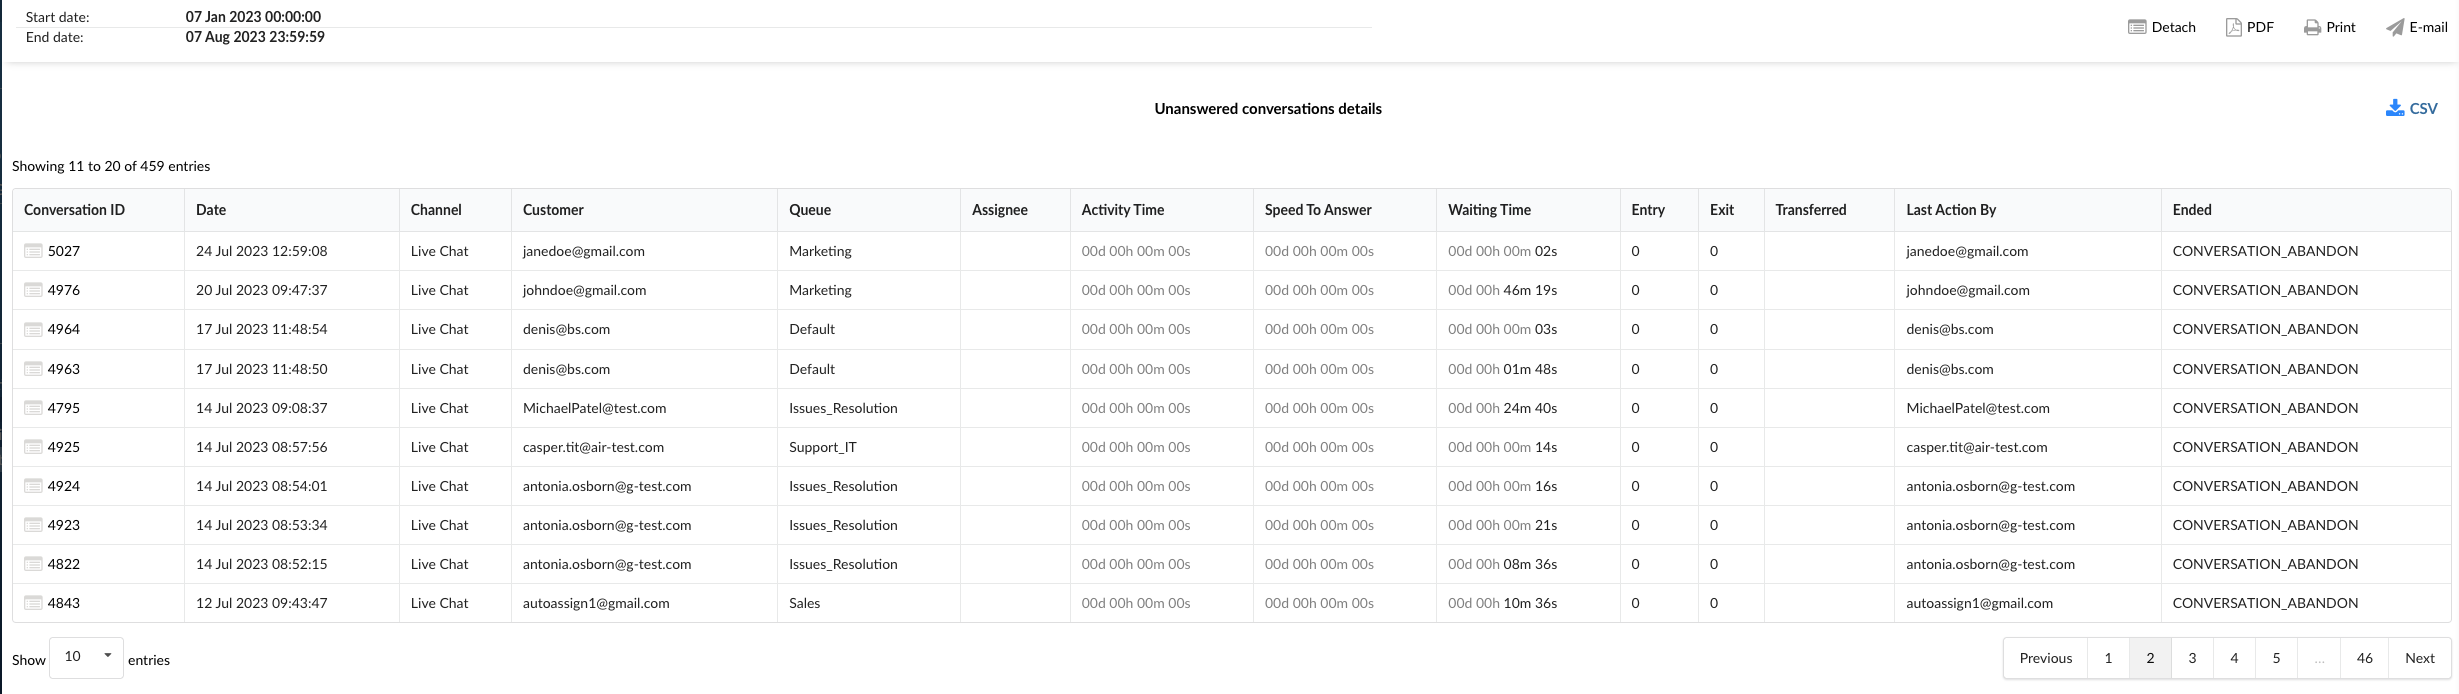
The Unanswered Conversations Detailssection provides a complete breakdown of each unanswered conversation. This section is organized into several columns, each providing specific details about the conversations:
Conversation ID : displays the unique identifier of each conversation. This identifier can be used to search for and track specific conversations.
Date : displays the date on which each conversation took place. This allows you to display and sort conversations based on when they took place.
Channel : Indicates the communication channel through which each conversation took place. The channels can include email, live chat, SMS, voice, etc.
Client : Displays the customer involved in each conversation. This can be a name, a customer ID, or any other identifier used to track customers.
Queue : displays the queue in which each conversation was placed. This allows you to see which queues have the most unanswered conversations.
Assigned : Indicates the agent who was assigned to each conversation. If a conversation was not assigned to any agent, this field can be left empty or filled with a default value.
Uptime : displays the total time during which each conversation was active. This includes every moment the conversation was open, whether or not an interaction took place.
Answer speed : indicates how quickly an agent answered each conversation. For unanswered conversations, this field can be left empty or filled with a default value.
Wait time : displays the total time during which each conversation waited for a response from an agent. This can help identify any delay in response times.
Input : displays the time at which each conversation entered the queue. This allows you to track the flow of conversations in your system.
Quit : displays the time at which each conversation left the queue. This can help identify conversations that remained in the queue for an unusually long period of time.
Transferred : Indicates whether each conversation was transferred to another agent or another queue. This can help identify patterns in conversation transfers.
Last action by : indicates who performed the last action in each conversation. It could be an agent, a customer or an automated system.
Completed : Indicates how each conversation ended. This could indicate whether the conversation was ended by an agent, a customer or for another reason.
The the unanswered conversations by channel section is a powerful tool for understanding and analyzing each unanswered conversation. It enables managers to identify trends, make informed decisions, and implement strategies to improve customer service and efficiency.
Charts of unanswered conversations by channel
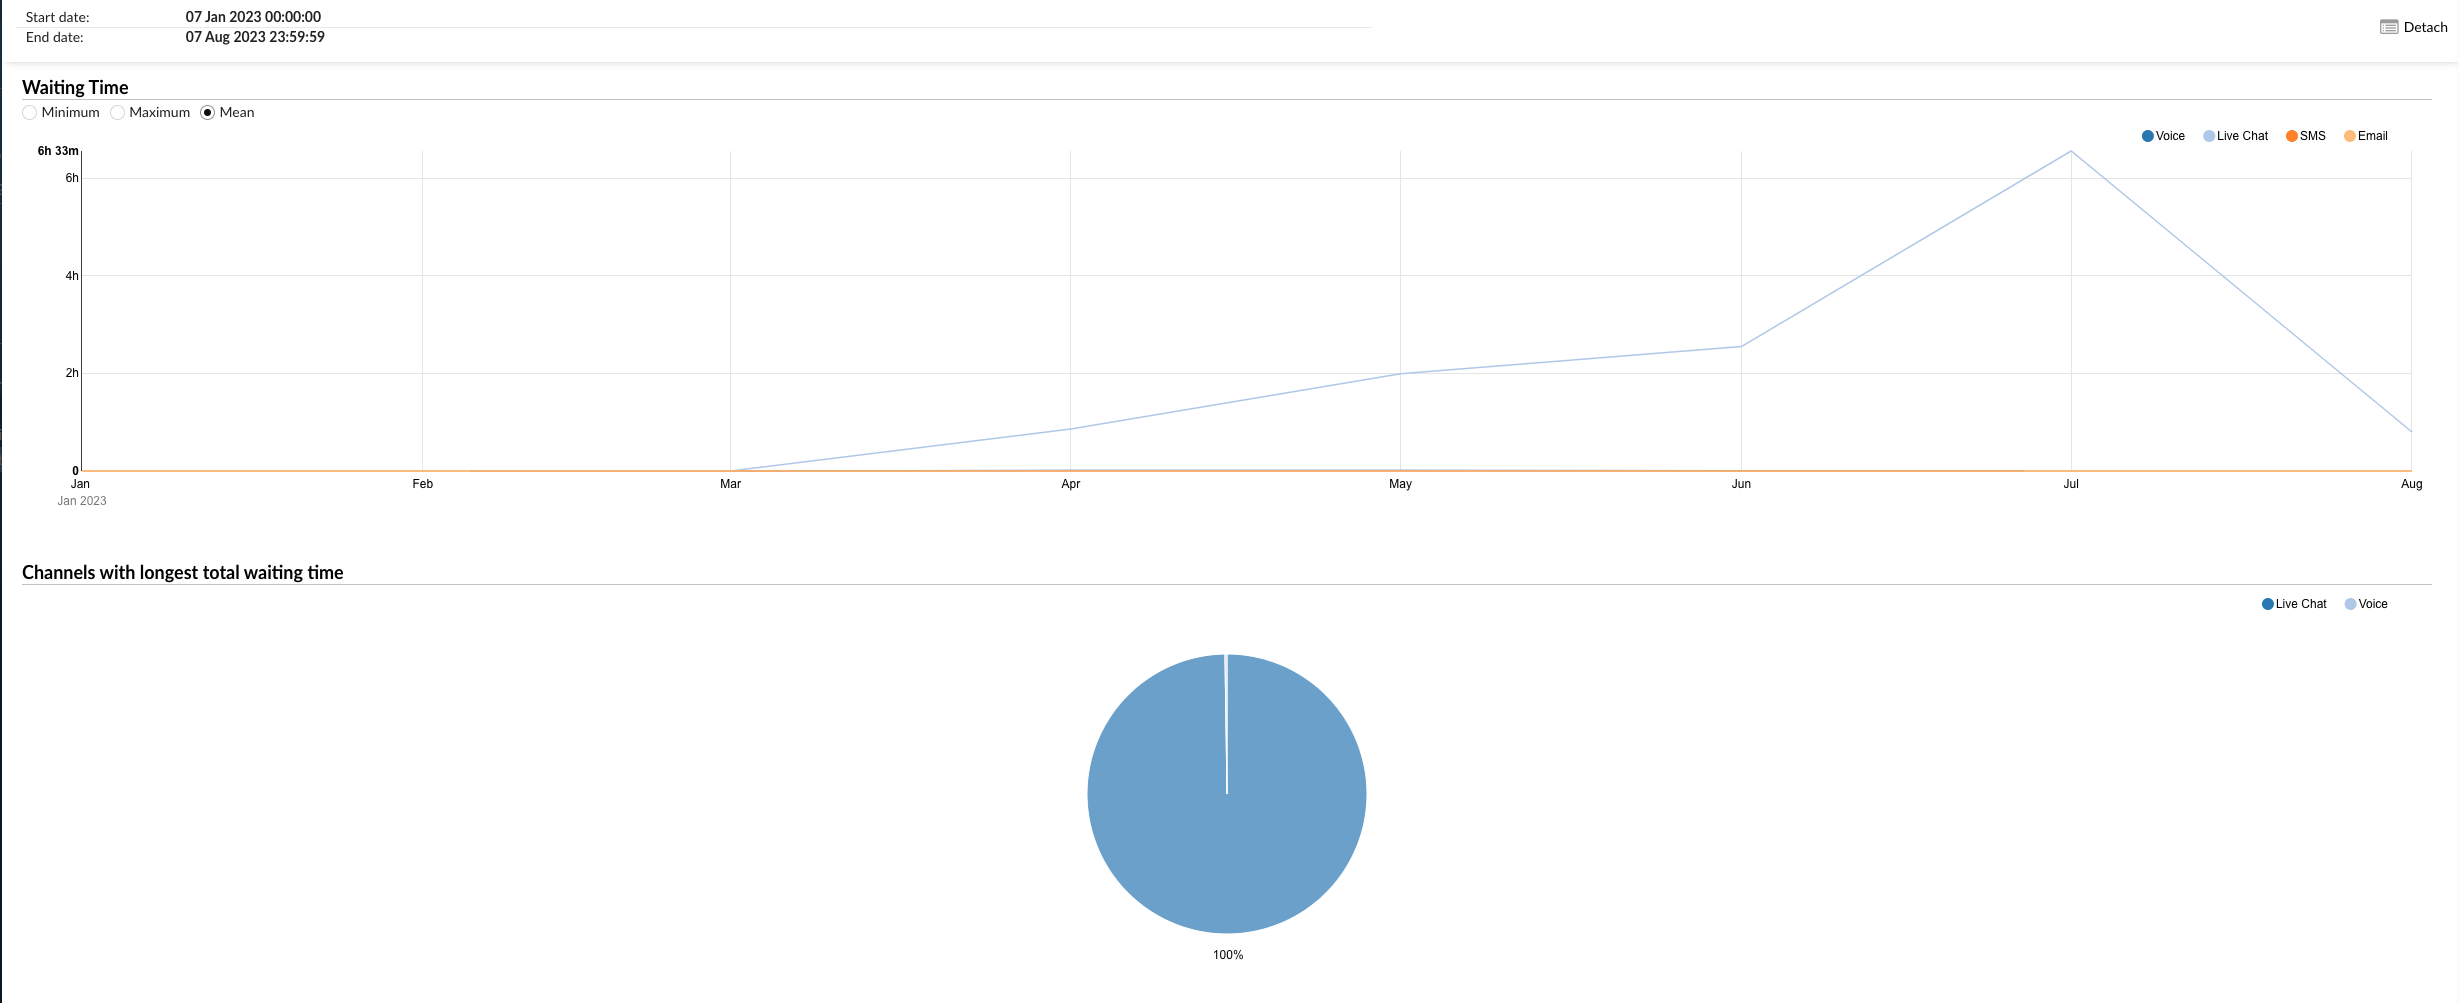
The “Unanswered Conversations by Channel” section provides two insightful charts that allow you to visualize and analyze the waiting times for unanswered conversations across different channels.
Wait Times Chart
The first chart represents the wait time for each channel. It is a line chart where each line corresponds to a different channel such as email, live chat, SMS, voice, etc.
On the left side of the chart, you can filter the data by minimum, maximum, and average waiting time. This allows you to display the shortest, longest, and average waiting times for unanswered conversations per channel.
On the right side, you can select the channels you want to include in the chart. By hovering over the chart lines, you can see the exact waiting time data for each channel.
Channels with the longest total wait time
The second chart is a pie chart that represents the channels with the longest total wait time. Each slice of the pie corresponds to a different channel.
On the right side of the chart, you can select the channels you want to include. This allows you to focus on specific channels and compare their total waiting times. The size of each slice corresponds to the total waiting time of the respective channel, allowing you to easily identify which channels have the longest waiting times for unanswered conversations.
These charts offer a visual and intuitive way to understand the wait times of unanswered conversations across different channels. They can be used to identify bottlenecks, improve resource allocation, and enhance customer service efficiency.
Unanswered conversations by queue
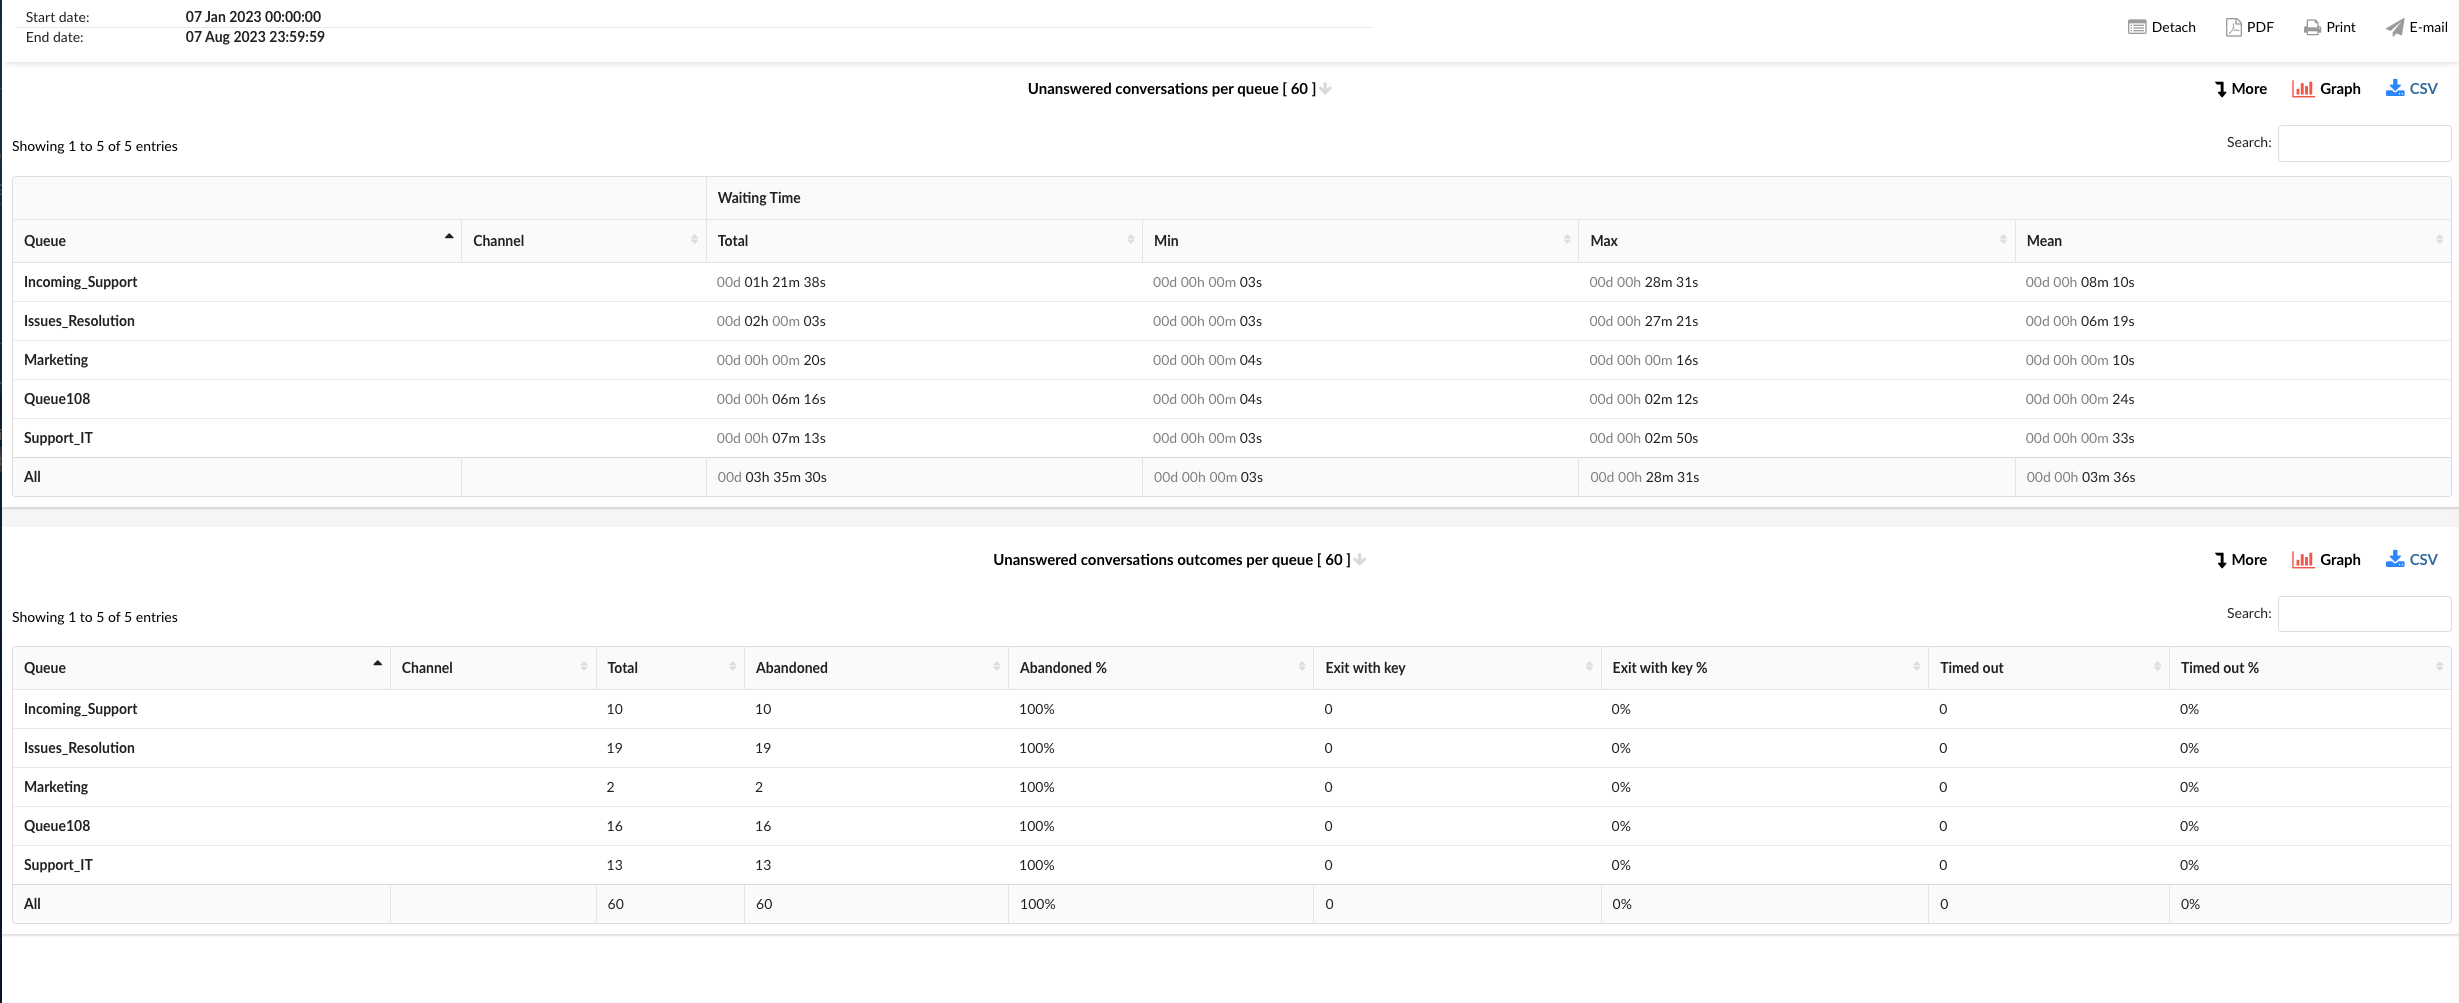
The “Unanswered Conversations by Queue” section provides detailed information about unanswered conversations, organized by queue and by channel. This section is divided into two tables: “Unanswered Conversations by Queue” and “Unanswered Conversations Results by Queue”.
Unanswered conversations by queue
This table provides a breakdown of unanswered conversations for each queue and channel. The columns in this table include:
Queue : this column lists all queues in your system.
Channel : This column indicates the communication channel of the conversations in each queue. The channels can include email, live chat, SMS, voice, etc.
Wait time : this column is divided into four sub-columns:
Total : The total wait time for all unanswered conversations in each queue and channel.
Min : the shortest wait time among all unanswered conversations in each queue and channel.
Max : The longest wait time among all unanswered conversations in each queue and channel.
Average : average wait time for all unanswered conversations in each queue and channel.
Results of unanswered conversations by queue
This table provides a detailed breakdown of the outcomes of unanswered conversations for each queue and channel. The columns in this table include:
Queue : this column lists all queues in your system.
Channel : This column indicates the communication channel of the conversations in each queue. The channels can include email, live chat, SMS, voice, etc.
Total : total number of unanswered conversations in each queue and channel.
Abandoned : number of unanswered conversations that were abandoned by the customer.
% abandoned : the percentage of unanswered conversations that were abandoned by the customer.
Output with key : number of unanswered conversations where the customer exited using a key.
Quit with the % key : the percentage of unanswered conversations where the customer exited using a key.
Expired : the number of unanswered conversations that timed out.
% expiration : the percentage of unanswered conversations that timed out.
These tables provide a comprehensive view of unanswered conversations in each queue and channel, allowing you to identify trends, make informed decisions, and implement strategies to improve customer service and efficiency.
Unanswered conversations by queue breakdown
The “Unanswered Conversations by Queue Breakdown” section provides a detailed view of each unanswered conversation, organized by queue. This breakdown is presented as a table with the following columns:
Conversation ID : This column displays the unique identifier of each conversation.
Date : This column indicates the date on which the conversation took place.
Channel : This column indicates the communication channel of the conversation. The channels can include email, live chat, SMS, voice, etc.
Client : This column lists the customer involved in the conversation.
Queue : This column indicates the queue to which the conversation was routed.
Recipient : this column displays the agent who was assigned to the conversation.
Uptime : this column displays the total time during which the conversation was active.
Answer speed : this column shows how long it took an agent to answer the conversation.
Wait time : This column shows the total time the customer waited for an answer.
Input : This column indicates the time at which the conversation entered the queue.
Output : This column indicates the time at which the conversation left the queue.
Transferred : This column indicates whether the conversation was transferred to another agent or another queue.
Last action by : This column indicates who performed the last action in the conversation, whether it was the agent or the customer.
Completed : This column indicates the time at which the conversation ended.
This detailed analysis allows you to analyze each unanswered conversation individually, providing information on the performance of your queues and agents, and helping you identify areas for improvement.
Chart of unanswered conversations by queue
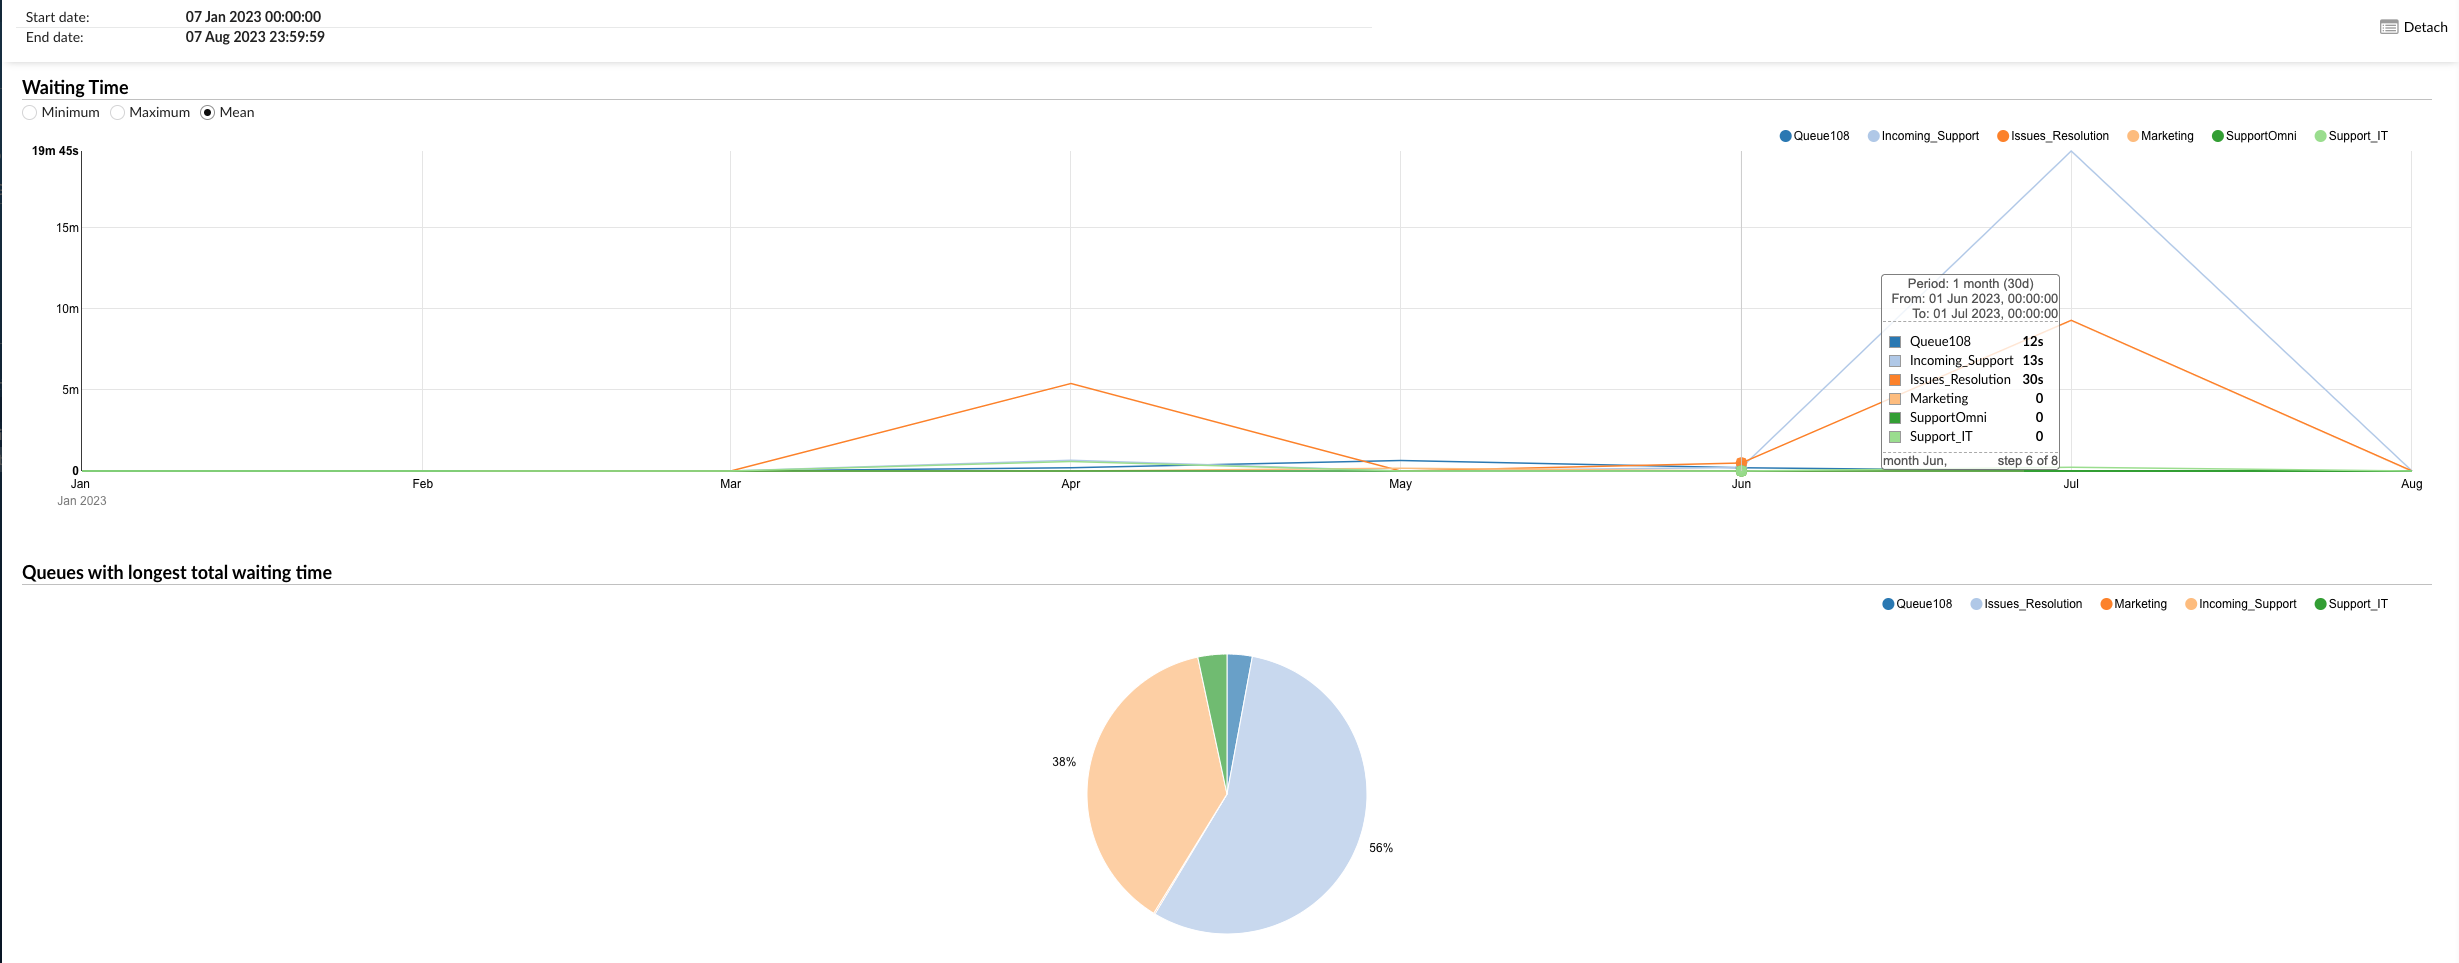
The “Unanswered Conversations by Queue” section provides a visual representation of unanswered conversations, organized by queue. This section is divided into two charts: “Waiting Time” and “Queue with the Longest Total Waiting Time”.
Wait time
This chart illustrates the wait time of unanswered conversations in each queue. The chart can be filtered using the following options on the left:
Minimum : This filter displays the shortest waiting time for unanswered conversations in each queue.
Maximum : this filter displays the longest waiting time for unanswered conversations in each queue.
Average : This filter presents the average waiting time of unanswered conversations in each queue.
On the right, you can select specific queues to display their data. By hovering over the graph lines, you can see the exact wait time data for each queue.
Queue with the longest total wait time
This pie chart provides a visual representation of the queue showing the longest total wait time for unanswered conversations. You can filter the data by selecting specific queues on the right. Each slice of the pie chart represents a queue and the size of the slice corresponds to the total wait time of that queue.
These charts provide a comprehensive view of the wait time of unanswered conversations in each queue, allowing you to identify trends, make informed decisions, and implement strategies to improve customer service and efficiency.
Chart of unanswered conversation outcomes by queue
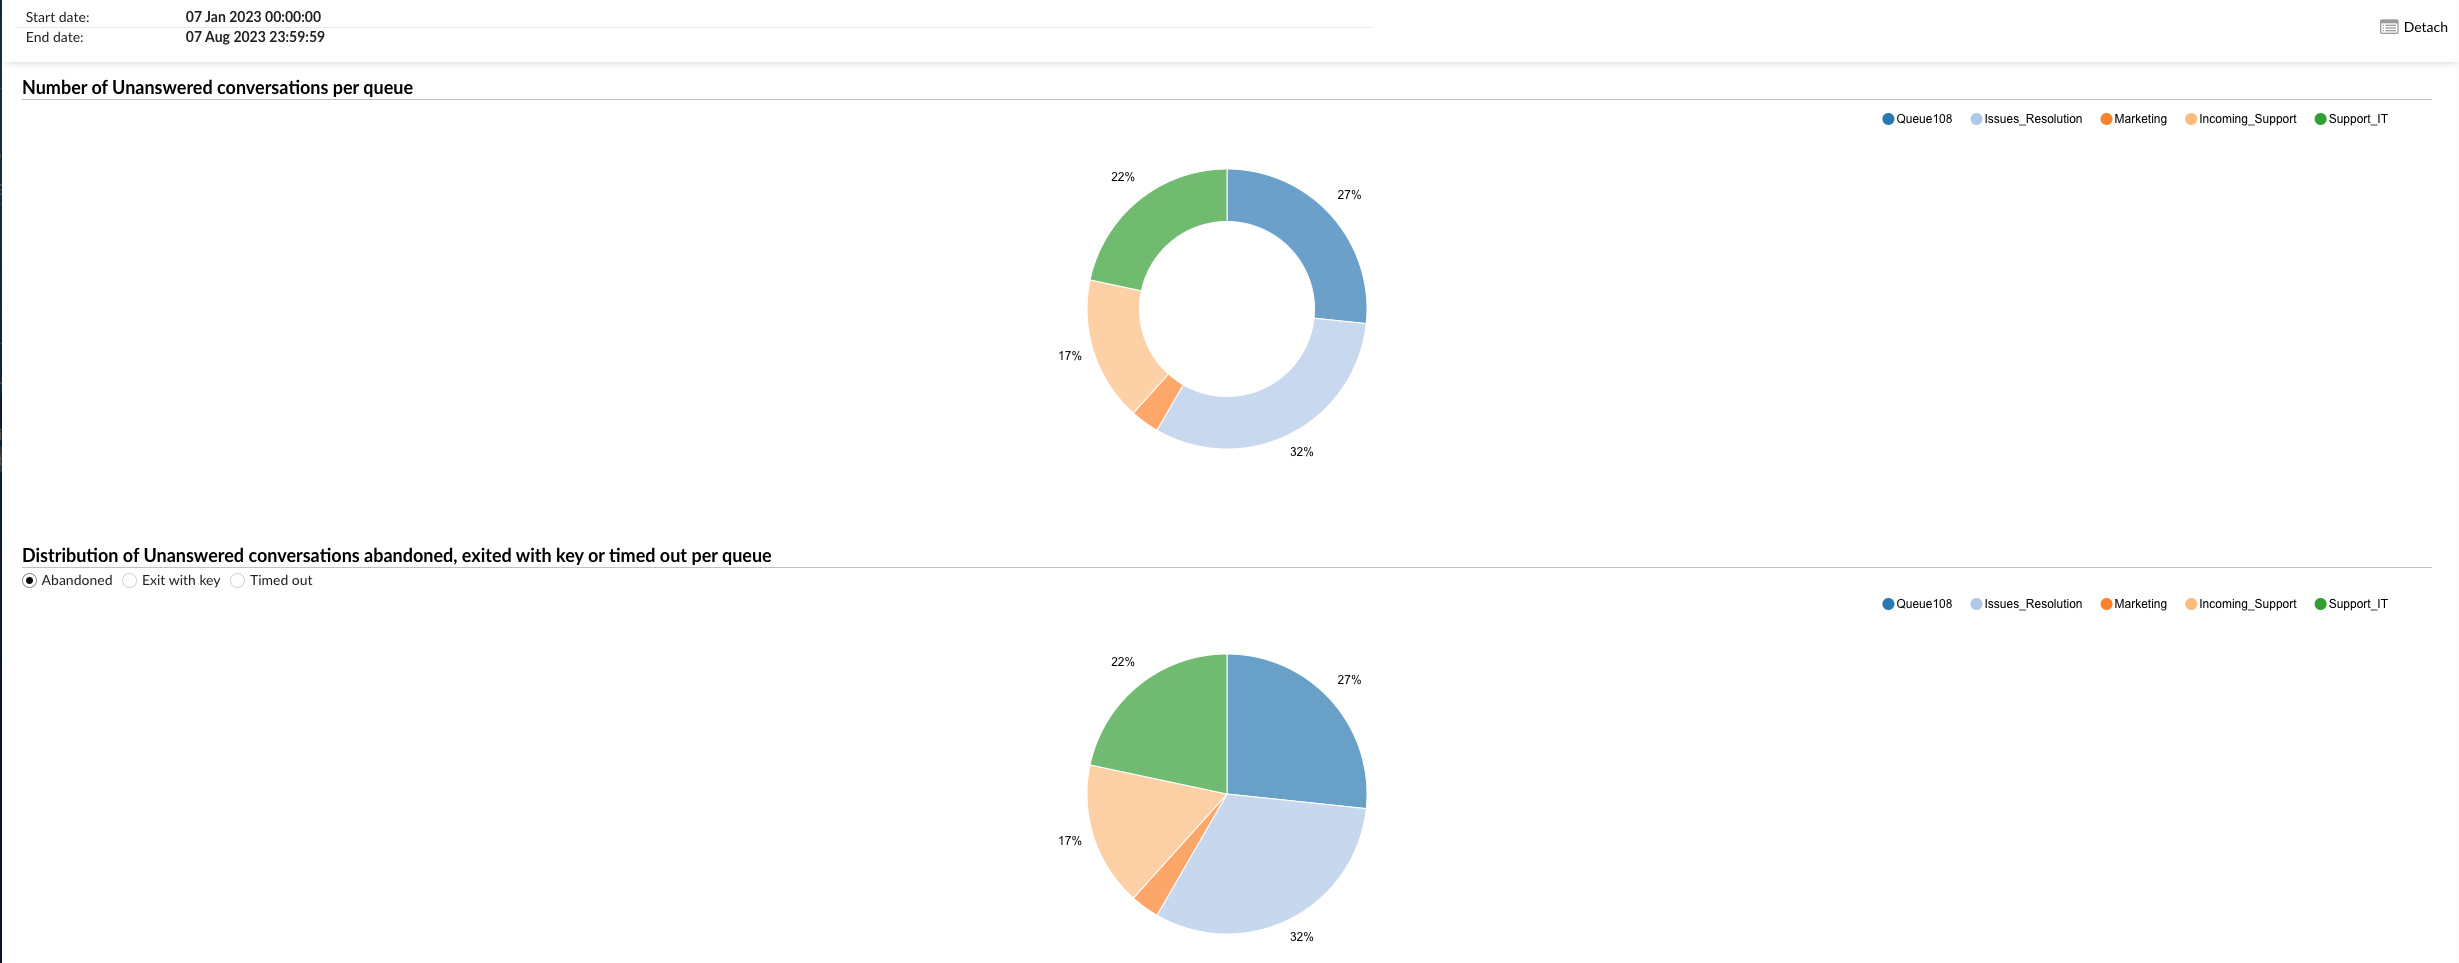
The “Unanswered Conversations Results by Queue Chart” section provides a visual representation of the results of unanswered conversations, organized by queue. This section is divided into two charts: “Number of Unanswered Conversations by Queue” and “Unanswered Conversations Breakdown – Abandoned, Exited with the key, or Timed out by queue.”
Number of unanswered conversations per queue
This pie chart illustrates the number of unanswered conversations for each queue. You can filter the data by selecting specific queues on the right. Each slice of the pie chart represents a queue and the size of the slice corresponds to the number of unanswered conversations in that queue.
Distribution of unanswered conversations – Abandoned, exited with the key, or timed out, by queue
This chart provides a visual breakdown of the outcomes of unanswered conversations in each queue. You can filter the data using the following options on the left:
Abandoned : This filter displays the number of conversations that were abandoned by the customer before an agent could answer.
Quit with key : this filter displays the number of conversations where the customer left the queue using a key.
Timed Out : This filter presents the number of conversations that timed out before an agent could answer.
On the right, you can select specific queues to display their data. This graph allows you to see the distribution of these results for each queue.
These charts provide a comprehensive view of the outcomes of unanswered conversations in each queue, allowing you to identify trends, make informed decisions, and implement strategies to improve customer service and efficiency.
Scheduled reports
Scheduled reports are useful for monitoring and analyzing key performance indicators, activities and trends over time. These reports are preconfigured to run at specific intervals, for example daily, weekly or monthly. They are generated automatically without requiring any manual intervention.
The three main key points regarding scheduled reports:
Scheduled reports eliminate the need for company staff to manually generate regular reports. Instead, reports are generated automatically at predetermined intervals, saving time and effort.
As businesses process a large amount of data, including call volumes, agent performance, customer satisfaction, and so on, scheduled reports allow organizations to analyze this data systematically, which makes it easier to identify trends and areas for improvement.
Since scheduled reports are highly customizable, users can choose specific metrics, date ranges and formats to create reports tailored to their unique needs.
Scheduled reports are an extension of the agent and queue reports, where each report template has different filters that can be applied during editing.
Add a report
To add or create a new report in our system, users can start the process by selecting the  option. This action opens a new page where users can enter additional parameters and settings for the report, including filters, report types, time intervals, etc.
Running and stopping a report
Next to the report configuration options, users will find the “Run” or “Stop” option, which depends on the current state of the report scheduler.
If the scheduler is currently active and configured to generate reports as scheduled, the “Stop” option will be displayed. This means that the system is actively generating reports based on the configured settings.
In contrast, when the scheduler is paused or not running, users will see the "Run" option. This indicates that report generation is temporarily interrupted.
Report scheduler status
The scheduler status is displayed next to the "Run" or "Stop" option. This status provides users with real-time information about the current state of the report scheduling, thus ensuring clarity and ease of management.
 – The report scheduler is active and running.
 – The report scheduler is stopped.
Search for scheduled reports

To search for previously created scheduled reports by their name, go to the search and enter the full name or just a part of their name.
(For example, monthly performance analysis, daily, snapshot)
The landing page provides essential information about scheduled reports, notably the following details:
Name

This field displays the name or the title of each scheduled report. It helps users easily identify and distinguish the different reports.
Interval
The interval indicates how often the report is scheduled to run. This can be daily, weekly, monthly or at custom intervals, depending on the report configuration.
Active
The state Active indicates whether the report scheduler is currently enabled or disabled. An active status means that the report is configured to run according to its schedule, while an inactive status means that it is temporarily suspended.
Last turn
This field displays the date and the time of the last generation or execution of the report. It provides users with a timestamp of the most recent report activity.
Last status
The field Last status summarizes the result or status of the last report execution. It can indicate whether the report ran correctly, encountered errors, or ran into other problems.
Show/Edit/Delete the report
Show
Users must locate and select the button associated with the report they are interested in to access more complete information about a specific report. By clicking on Show , they will be directed to a dedicated page providing detailed information and details about the selected report.
Edit
To make changes to the details of a scheduled report, users must locate and select the button corresponding to the report they want to modify. After clicking on Edit , they will be directed to an editing interface where they can adjust the settings and configuration of the selected report.
Delete
To delete a scheduled report, users must locate and select the button corresponding to the report they want to delete. By clicking on Delete , a warning message will appear and if you click on OK , the selected report will be permanently deleted from the system.
Scheduled report configuration
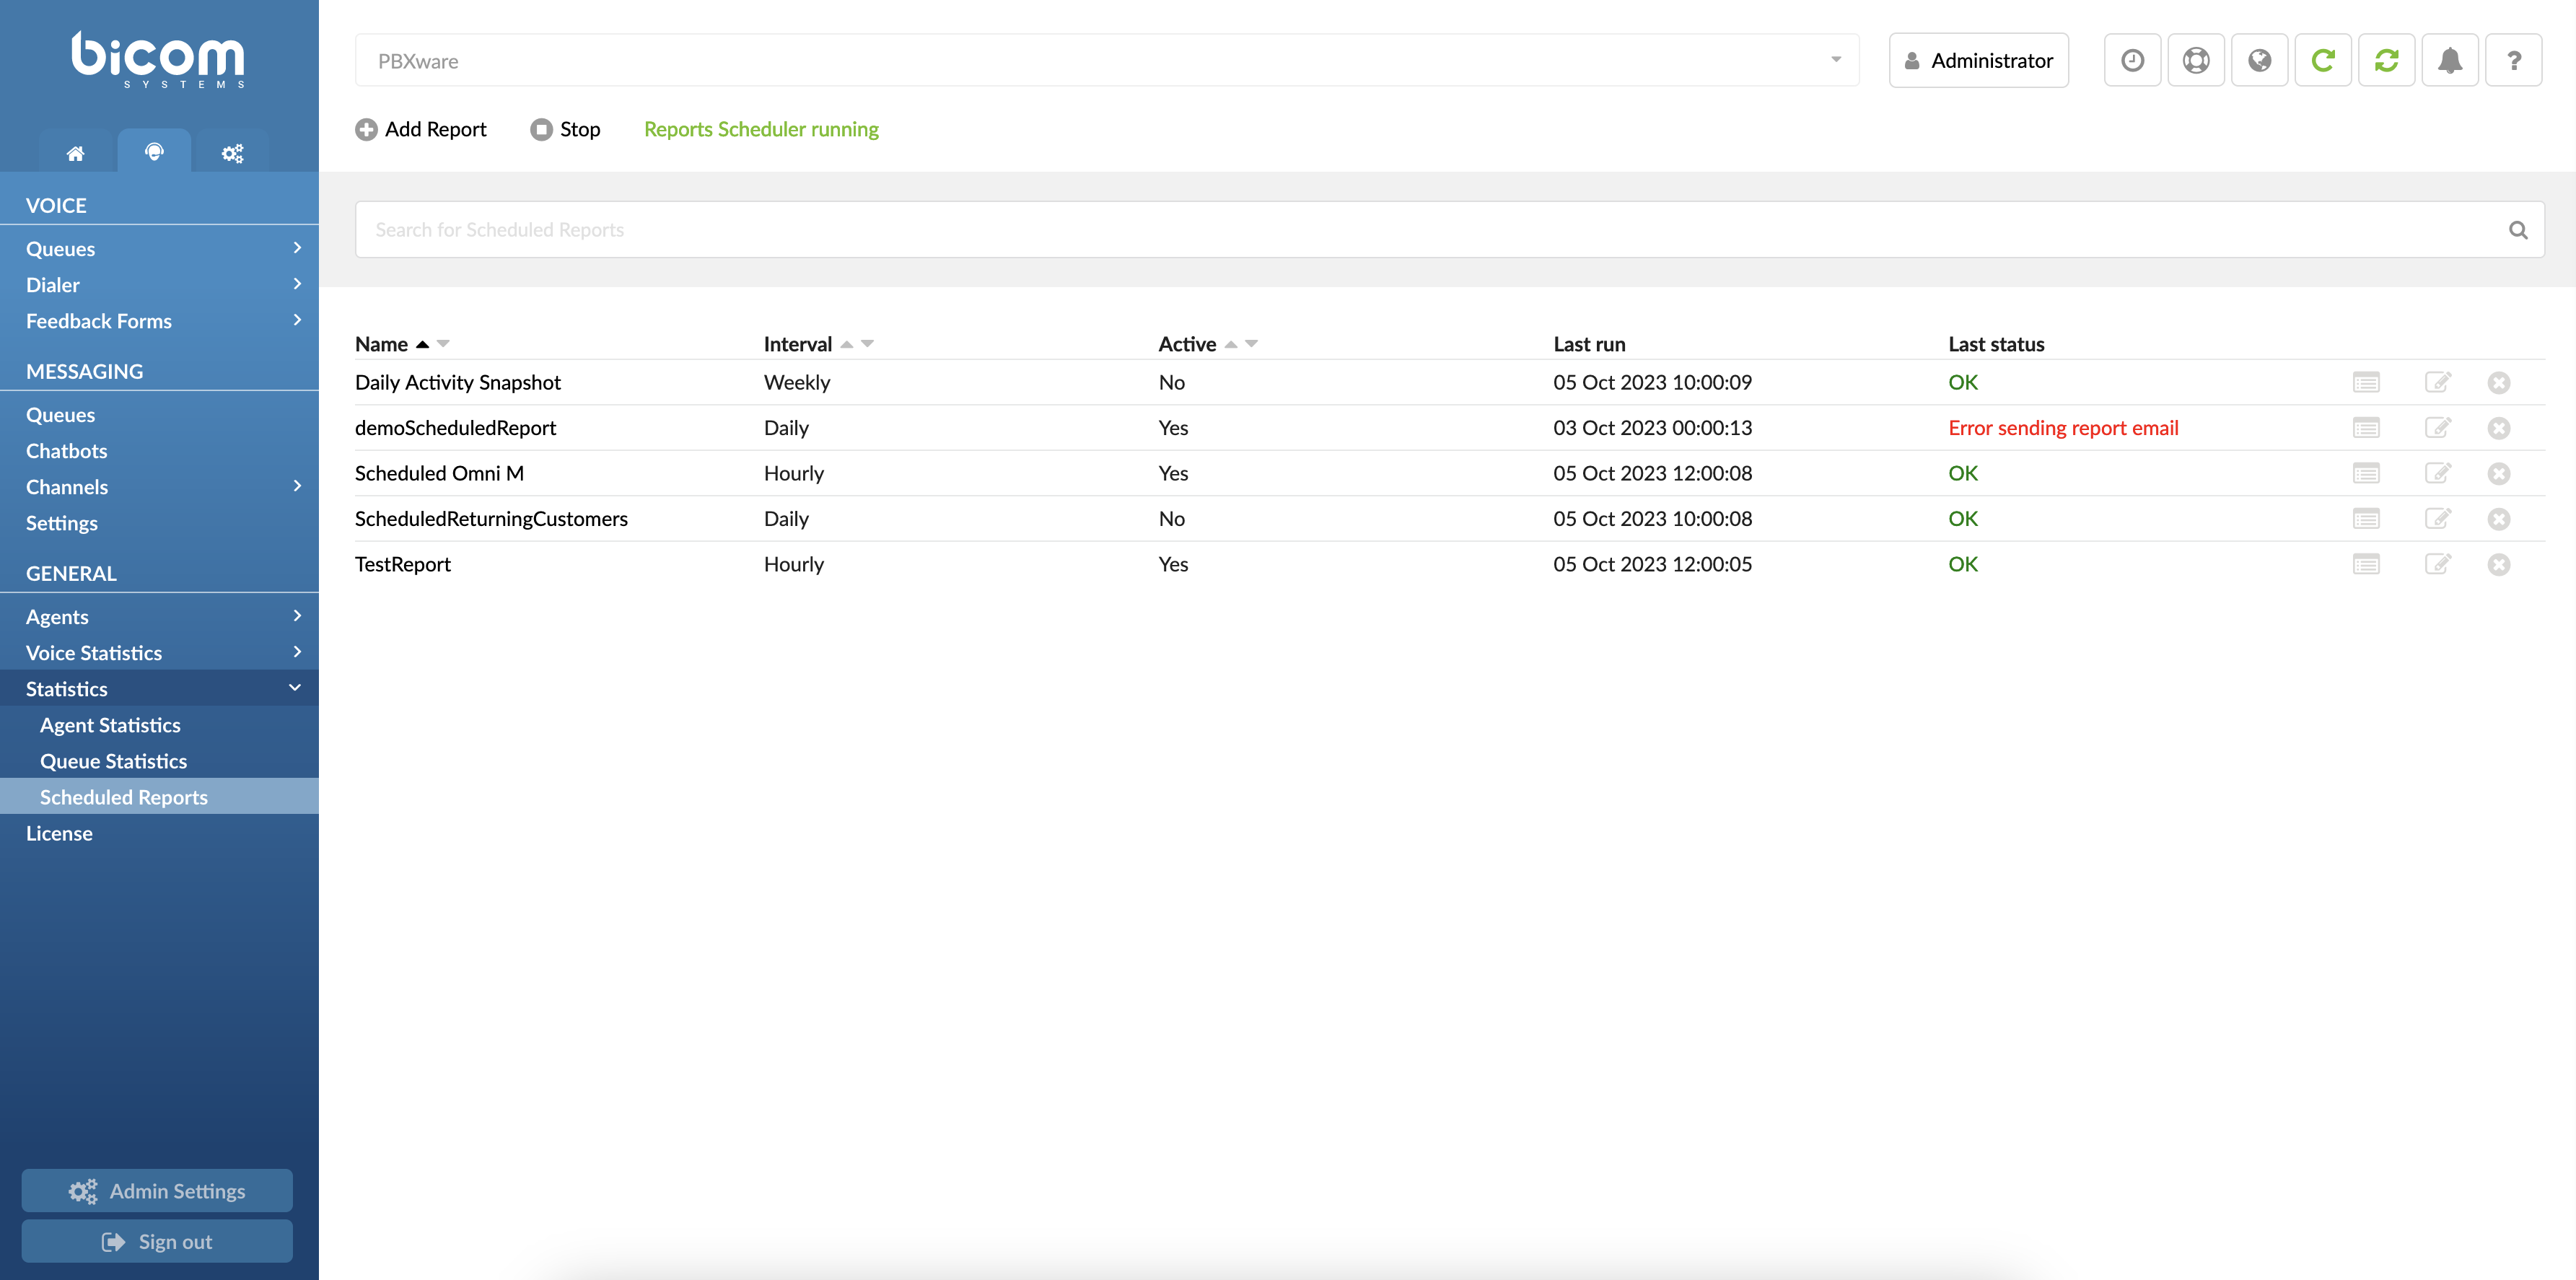
When selecting the Add a report , a new page will open, allowing users to enter additional parameters and configure the report settings.
The landing page is divided into four sections:
General
Name

Enter a descriptive name for the scheduled report. This name will be displayed on the main page of scheduled reports.
(For example, daily activity snapshot, ScheduledReturningCustomers, Schedule 2 Swift Pro)
([az][0-9])
Active

Select whether the report is active or inactive. This means that if the option is set to “No”, the reports will not be generated even if the scheduler is running.
(For example, Yes/No)
(Options button)
Duration
Set the start time of the scheduled report using the time picker.
(Example: 09:00. This means that the report generation will start at 09:00.)
(Options button)
Interval
Choose the interval at which the scheduled report should run.
(Example: Weekly – The report is run every Monday)
(Select the box)
Notification
Send an email

Indicate whether an email should be sent when the report is generated.
(Example: Yes – An email will be sent when the report is generated).
(Options button)
Send to

Enter one or more email addresses to which the reports will be sent. Multiple email addresses can be separated by “;” or “,” plus a space.
(Example:
Unique email: john.doe@example.com
Multiple emails: marketing@example.com ; sales@example.com ).
Attachment
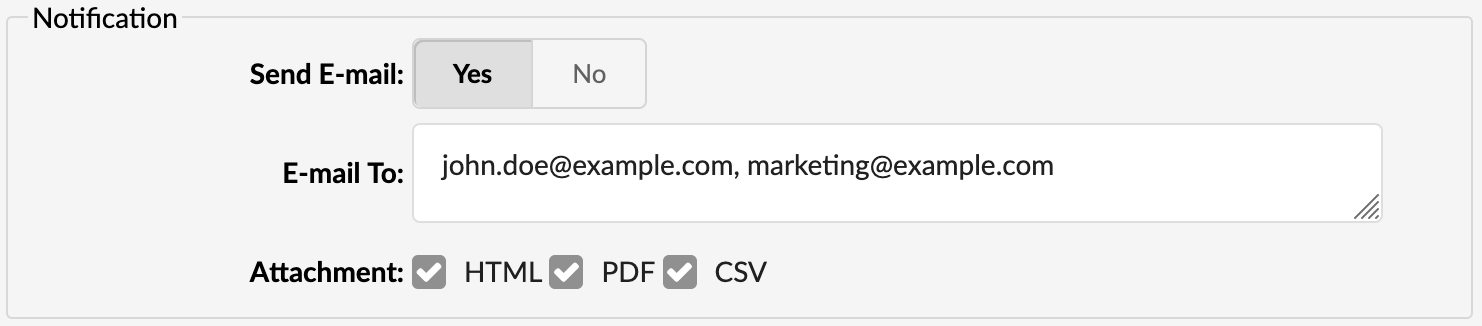
Select a file type to attach to an email.
If the user selects a CSV file type to attach, another CSV file will be created automatically. These files will be compressed and sent by email. The scheduled report type + ‘_breakdown’ will be the name of the new CSV file and will contain additional information about the selected report.
(For example, HTML/PDF/CSV)
If the selected report type is “Agent Availability”, the compressed folder sent by email will include two CSV files: “agentavailability.csv” and “agentavailability_breakdown.CSV”.
Types
Types
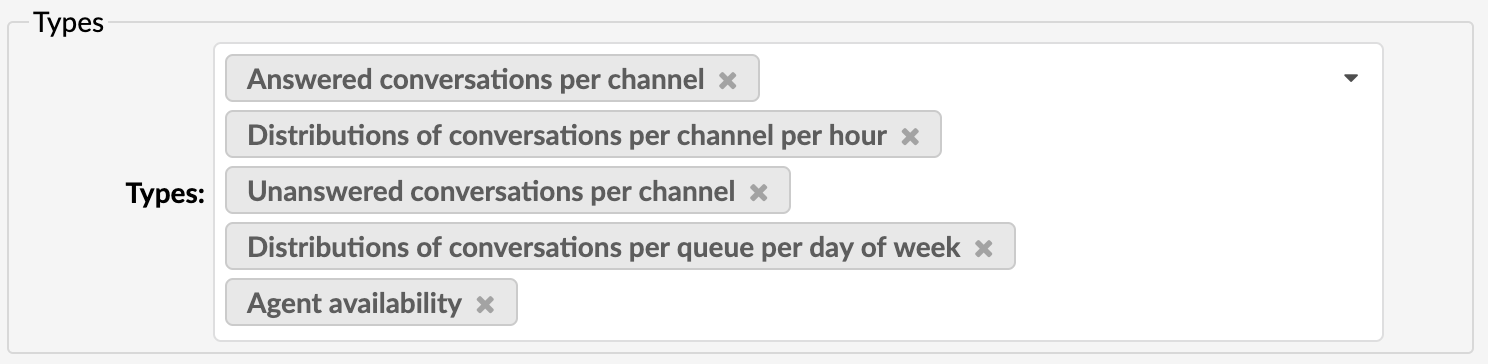
Select a specific conversation type from the drop-down menu provided. There are a total of 14 reports available to select from.
Filters
Time period
Choose a period to apply as a filter for your report.
(Example 1: Current week – Selecting this option will refine the report data to encompass the current week, starting from the current day.)
(Example 2: Last month – This choice will include data from the previous calendar month.)
Channels

Select a channel from a drop-down menu to create a report.
(Example: if you wish to generate a report specifically for email interactions, you must select the « Email » channel from the drop-down menu to focus on the data of that particular channel.)
Files
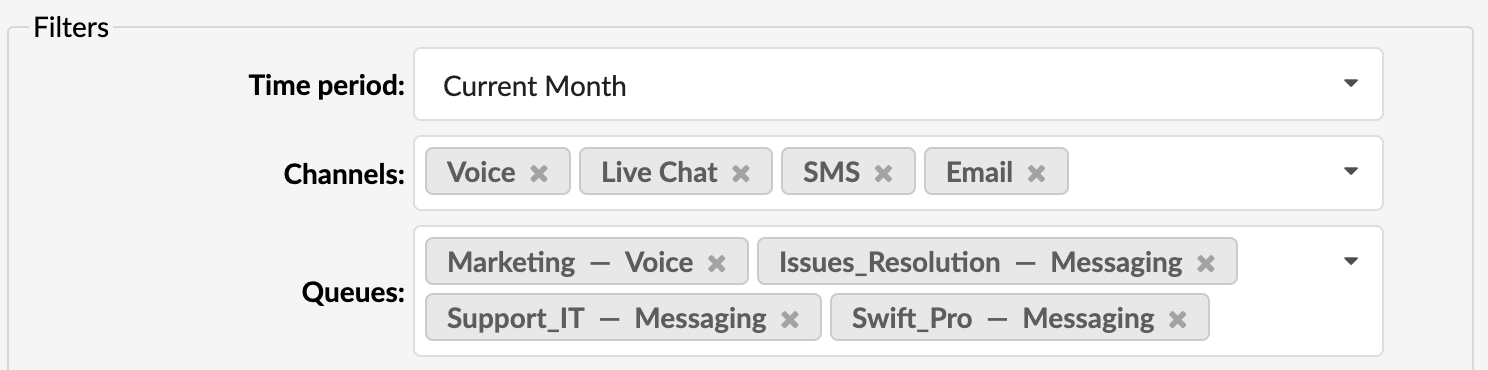
Specify a queue to apply as a filter for the report. Please note that the report will be filtered for the queues voice and messaging . (if selected)
(Example: you wish to generate a report specifically for the “Sales” queue. Select the “Sales” queue from the available options to do so. This will filter the report data to focus only on the activities of the “Sales” queue. )
Agents
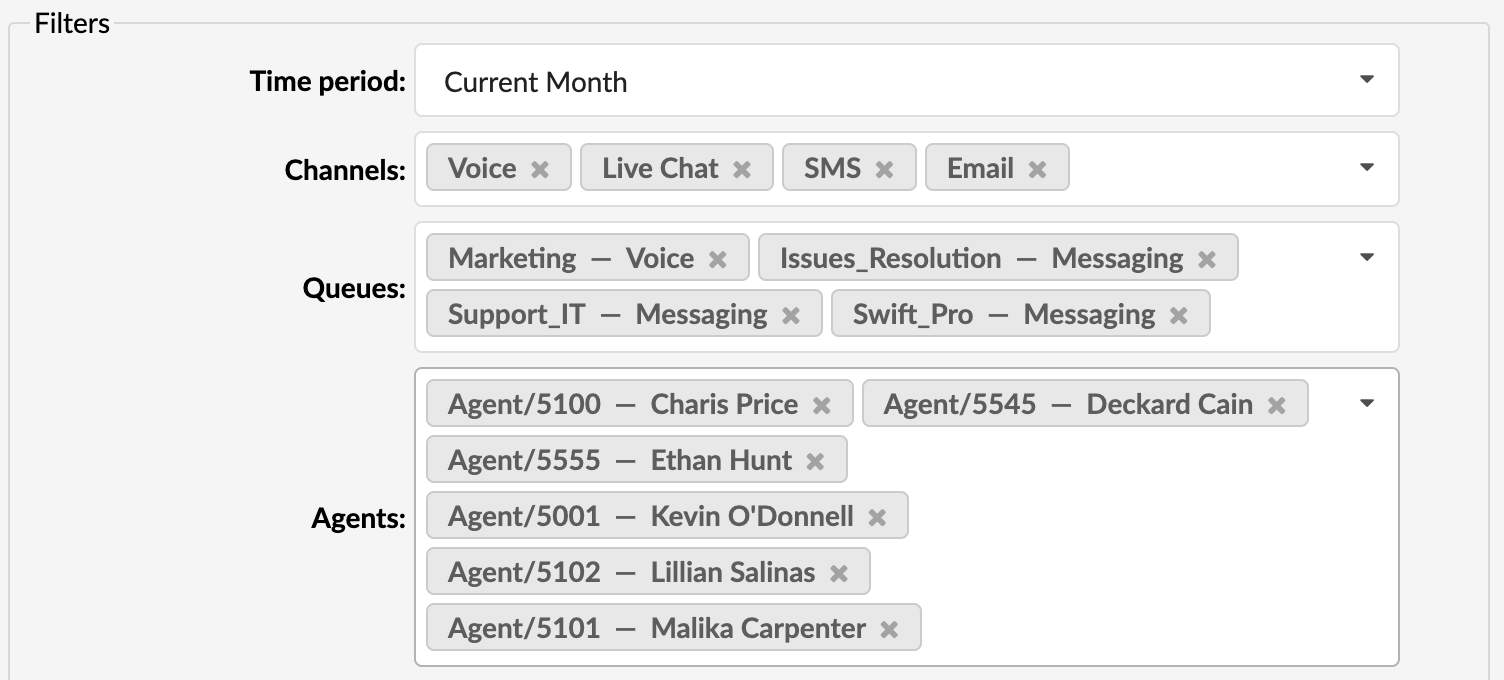
Enter the specific agents whose data you wish to use as filters for the report.
(Example: Suppose you wish to generate a report focused on the performance of your top-performing agents, John and Sarah. To do this, you must select “John” and “Sarah” as the agents to include in the report data. This will filter the report to display information about the activities of these two agents.)
Time format
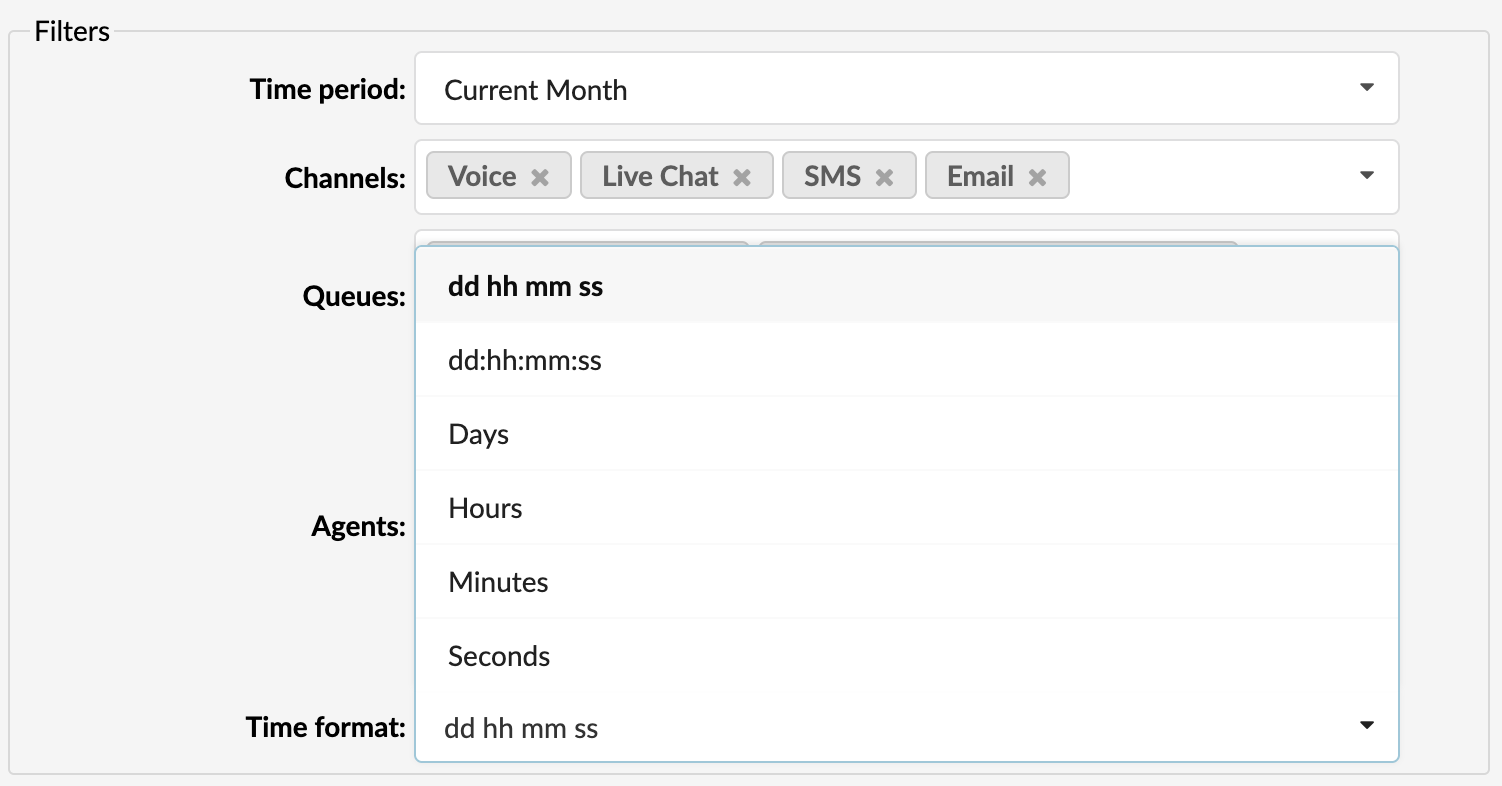
Users can customize the time format to display the data in days, hours, minutes and seconds.
(For example, dd hh mm ss/dd:hh:mm:ss/Days/Hours/Minutes/Seconds)
