



Voice statistics
Agent statistics
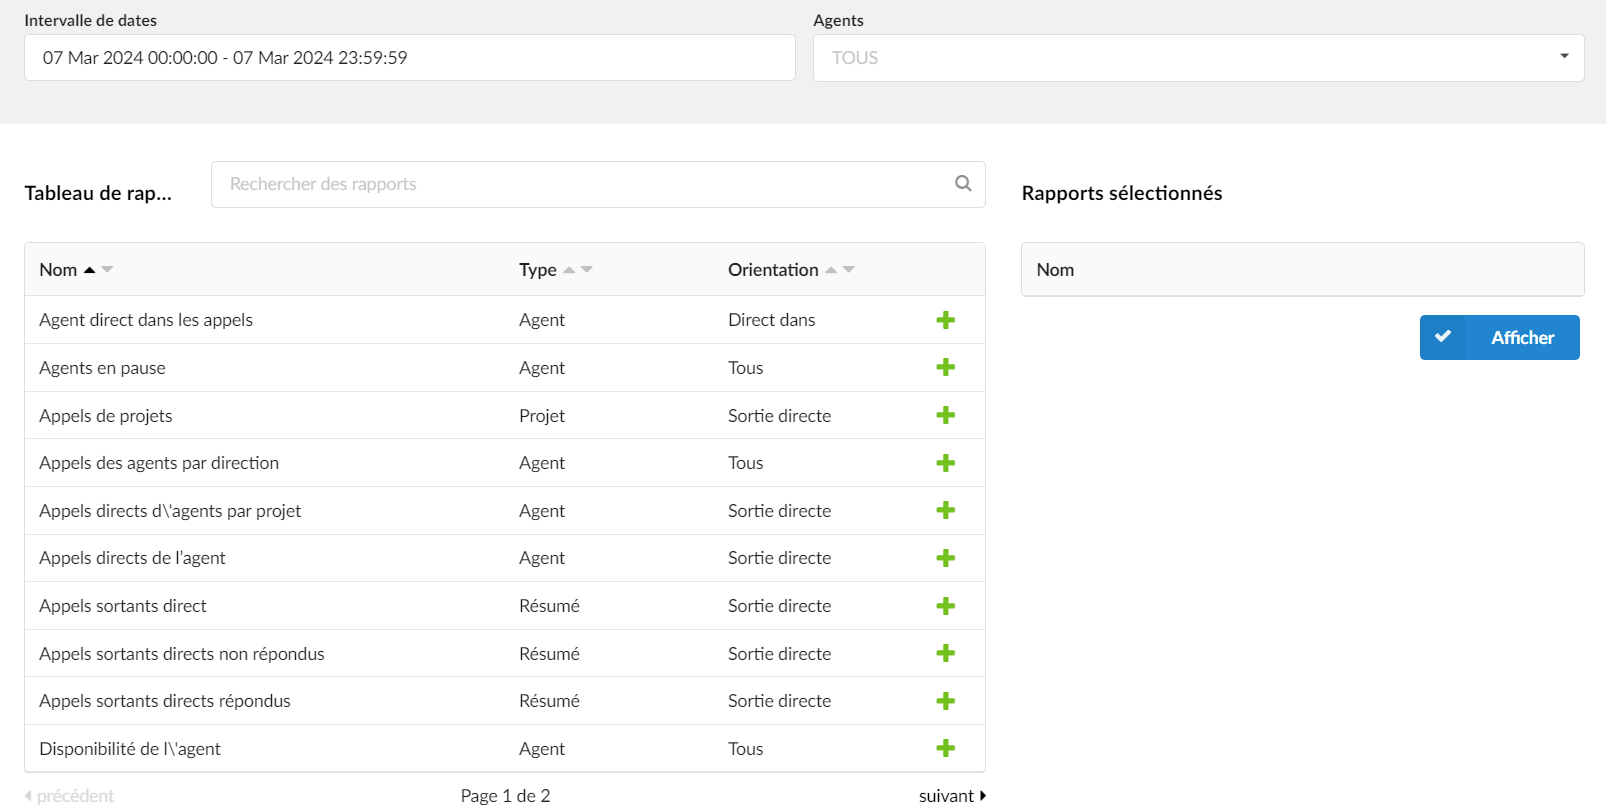
The agent statistics display a complete and detailed set of details about the agents.
- Date range
Statistics time period.
- Agents
Select the agent for which you want to see the statistics.
- Reports panel
You can see a list of all available report templates and choose the one you prefer accordingly. Please refer to the more detailed description for more details.
- Search
Enter a specific report title and get information faster.
- Selected reports
The table where all the selected reports are displayed.
(For example, click the Show button to generate statistics for all selected reports)
NOTE: By clicking on the Show button, you will be prompted to access the Reports page and, in the upper left corner, you will be able to get more details about the preferred report. If you hover your mouse over the Start date and End date lines displayed, you can see when the report was last generated. “Generated at” depends on the system time. The other lines are modified according to the chosen report template.
- Show agent availability statistics
Displays detailed information about agents. It provides a lot of information in a single report to give the client a quick overview of agent availability. The main feature here is agent idle time. This report focuses on the calls, sessions and pauses of all agents and provides accurate information about agent idle time.
- Show agent call statistics by direction
Displays the number of calls by direction. For each agent, the data is grouped by agent and by direction (direct inbound, direct outbound, inbound, outbound).
- Show statistics for direct agents on calls
Displays the agents directly in calls. The main feature here is calls > 1 min. These calls should be considered effective calls. This value is configurable.
- Show statistics on agents' direct calls
Displays detailed information about the agent's direct outbound calls. The main feature here is calls > 1 min. These calls should look like effective calls. This value is configurable.
- Show statistics on agents' direct calls by project
Displays detailed information about agents' direct calls with project codes. The data is grouped by agent, and for each agent, the data is grouped by project code. For example, if an agent made direct calls with three different project codes, this will also be shown in the statistics.
- Show agent occupancy statistics
Displays detailed information about agent sessions, pauses, talk time and occupancy. The data is grouped by agent. Provides a lot of information in a single report to give the client a quick overview of agent occupancy.
- Show statistics on agent pauses
Displays the number of agent pauses with/without a reason and billable/payable pauses. The data is grouped by agent.
- Show statistics for agent sessions and pauses
Displays information about agent sessions and pauses. The data is grouped by agent. The main feature here is the number of agent pauses per session.
- Show statistics for all calls
Displays summary information about all agent calls. Includes all call dispositions, including the total number of answered and unanswered calls.
- Show statistics for all answered direct calls
Displays summary information about calls received directly by the agent. Includes direct answered call dispositions (agent hangups, caller hangups, transferred calls).
- Show statistics for all direct calls
Displays summary information about all direct calls. Includes direct call dispositions that contain the total number of calls and the number of answered and unanswered calls.
- Show statistics for all unanswered direct calls
Displays summary information about the agent handling unanswered calls. Includes unanswered direct call dispositions where users can see the reason for no answer (busy, no answer, cancel)
- Show statistics for all project calls
Displays a certain number of calls made with a project code. The data is grouped by project so that the user can see how project codes are used. Here you can see how calls are distributed for each project code.
Queue statistics
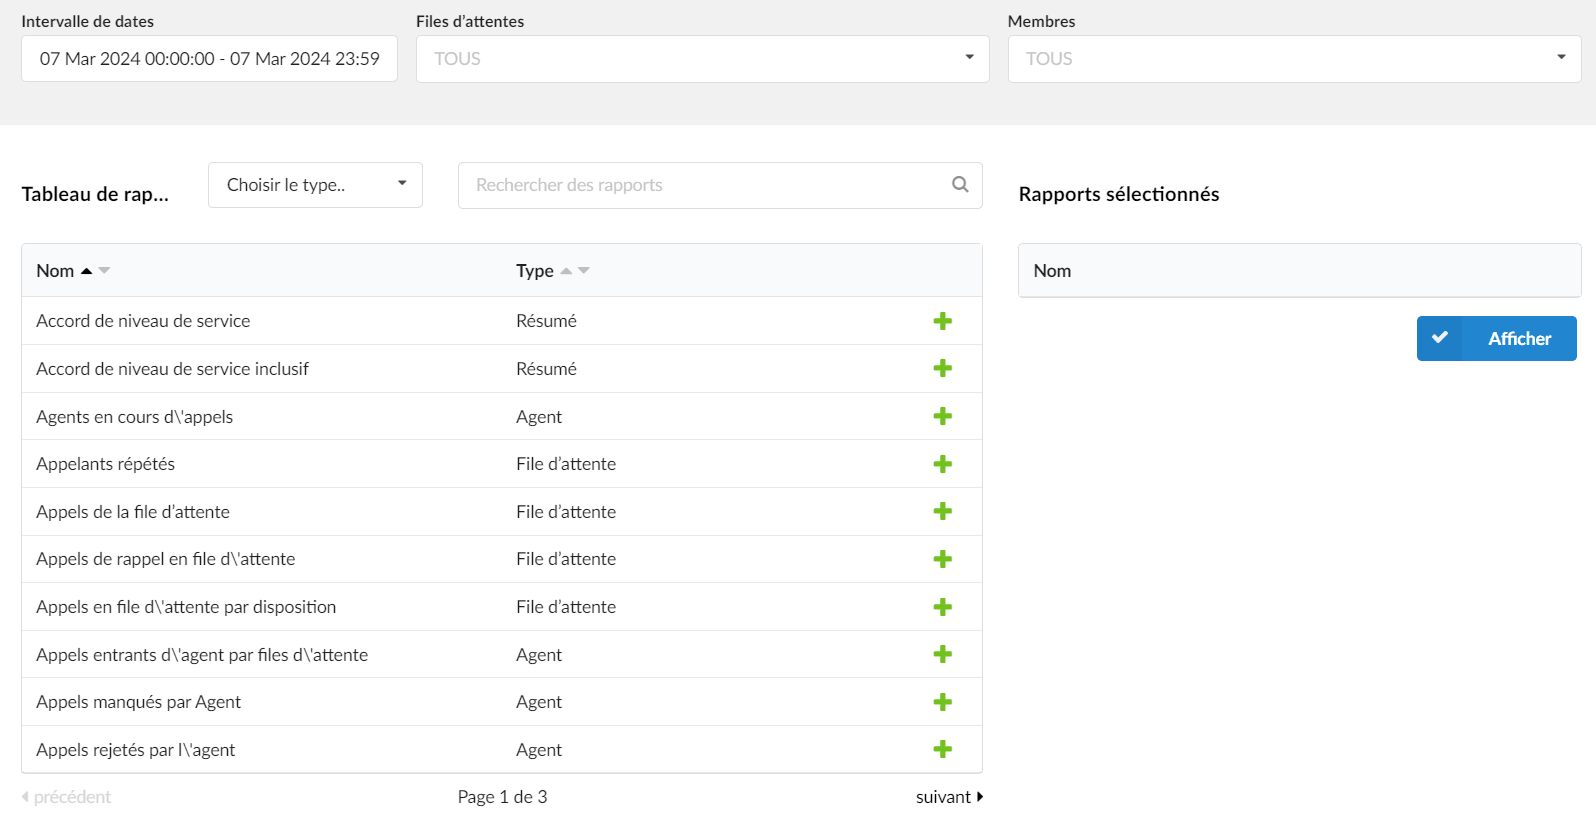
The queue statistics display a complete and detailed table of the queue details.
- Date range
Statistics time period.
Example:
Select the period for which the statistics should be displayed.
- Queues
Select the queue for which you want to see the statistics.
(For example, click the “Please select” button to select “All” (all queues) or a specific queue name, then click the “Show” button.)
(Select the box button)
- Members
Queue members.
In the Contact Center, users can filter the statistics by agent group.
- Select the gender
Type of reports to generate. (For example, queue, agent, summary)
(For example, click the drop-down menu and select the type of report you want to generate.)
- Reports panel
You can see a list of all available report templates and choose the one you prefer accordingly. Please refer to the more detailed description for more details.
- Search
Enter a specific report title and get information faster.
([az])
- Selected reports
A table where all selected reports are displayed.
(For example, click the Show button to generate statistics for all displayed reports.)
NOTE: By clicking on the Show button, you will be prompted to access the Reports page and, in the upper left corner, you will be able to get more details about the preferred report. If you hover your mouse over the Start date and End date lines displayed, you can see when the report was last generated. “Generated at” depends on the system time. The other lines are modified according to the chosen report template.
- Show statistics for all calls skipped by the agent
It indicates the number of calls the agent has rejected. Note that for one call, an agent can dump several times. The total corresponds to the number of calls received by the agent, including rejected calls. This type of call occurs when the agent hangs up on the caller during the queue announcement (agent announcement).
- Show statistics for all agent inbound calls by queue
Displays detailed information about the agent's inbound calls. For each agent, the data is grouped by queue. Users can see here how calls are distributed by agent and by queue.
- Show statistics for all agents' missed calls
It displays the agents' missed calls, the average of missed calls, and the total ring duration. The important thing here is that we can have more than one missed call for an agent call in the queue.
- Show statistics for all answered calls
Displays summary information about all answered inbound calls. Includes all answered call dispositions where we can see how the call ended (agent hangups, caller hangups, transfer).
- Show statistics for all calls in general
Displays summary information about all inbound calls. Includes all call dispositions (Total, Answered, Unanswered).
- Show statistics for all unanswered calls
Displays summary information about all unanswered inbound calls. Includes unanswered call dispositions where we can see the reason for no answer (Abandon, Exit with key, Timeout).
- Show distribution statistics for all calls by day
Displays all calls per day. The list of days depends on the time range filter.
- Show distribution statistics for all calls by day of a month:
It shows you all the calls on every 1st and 2nd day of the month.
- Show distribution statistics for all calls by day of the week
Shows how calls were distributed by day of the week.
- Show distribution statistics for all calls by hour
Shows how calls were distributed by hour.
- Show entry position statistics
Displays the average, minimum, and maximum entry positions of calls in the queue. The data is grouped by queue. This is a critical report because from this report we can discover the amount of load in the queues.
- Show statistics on answered queued calls
Displays more detailed information about answered queue calls. The data is grouped by queue. Includes answered call dispositions where we can see how the call ended (agent hangups, caller hangups, transfer).
- Show statistics for queue callback calls
Displays information about queue callback calls. The data is grouped by queue. Includes callback call dispositions that contain the total number of answered callback calls and unanswered calls.
- Show statistics for queued calls
Displays summary information about all queue calls. The data is grouped by queue. Includes queue call decisions that contain the total number of answered and unanswered calls.
- Show queued call statistics by agent
Displays detailed information about queued calls by agent. The data is grouped by queue. For each queue, the data is further grouped by an agent. Here you can see how calls are distributed by queue and by agent.
- Show unanswered queued call statistics
Displays more detailed reports about unanswered calls in queues. The data is grouped by queue. Includes unanswered call dispositions where we can see the reason for no answer (abandon, exit with key, timeout).
- Show repeated call statistics
This report displays the statistics of a caller who called the queue at least twice.
- Show statistics for the service level agreement
The service level agreement is calculated for each time range (10, 20, 30, 40, 50, 60, 70, 80, 90, 100, 110, 120) as: Service level = answered calls_inside_time/total_calls * 100
- Show statistics for the included service level agreement
The included service level agreement is calculated for each time range (10, 20, 30, 40, 50, 60, 70, 80, 90, 100, 110, 120) as: Included service level agreement = 100 – Answered calls within the allotted time / Total of all calls * 100
Dialer statistics
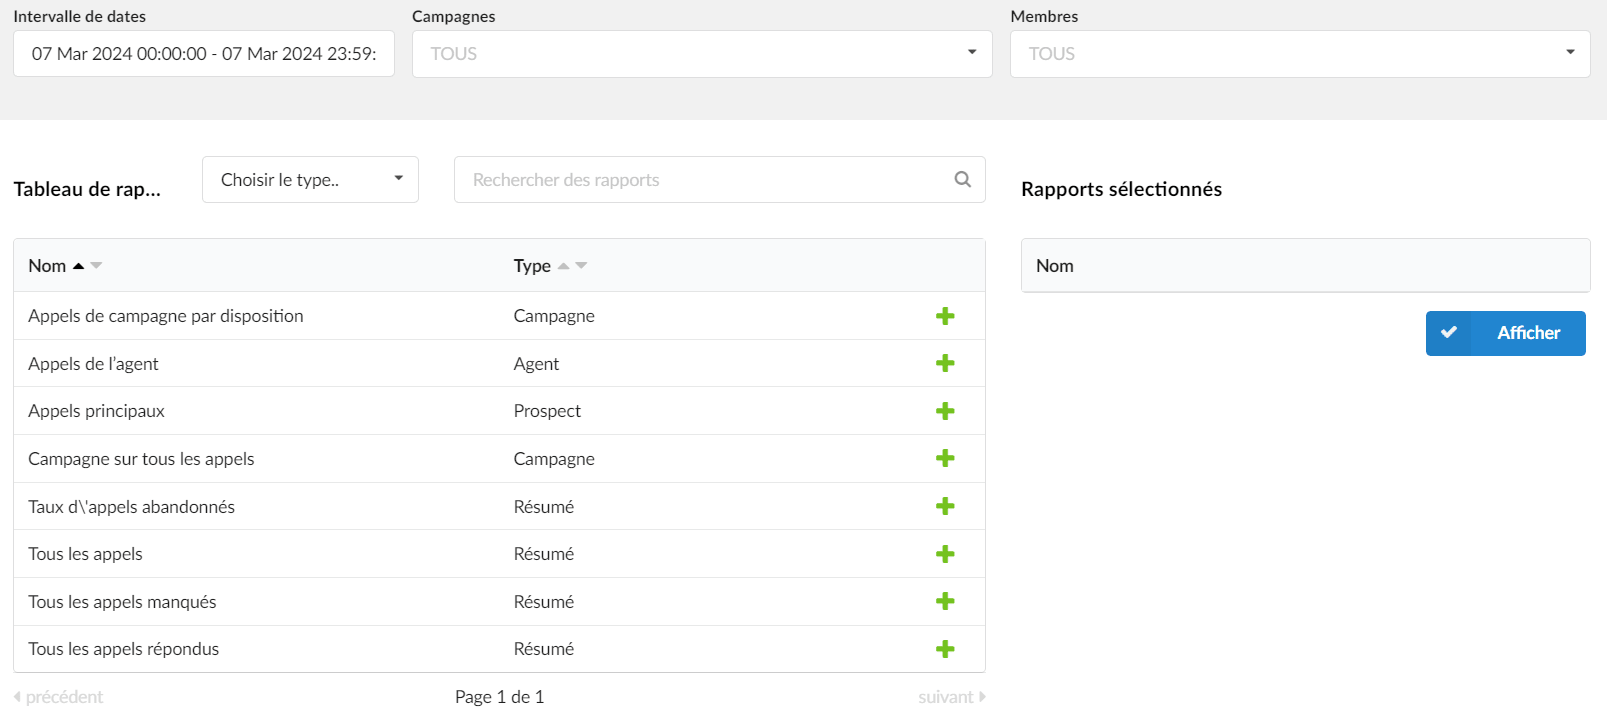
The dialer statistics display a complete and detailed table of the dialer details.
- Date range
Statistics time period
Example:
Select the period for which the statistics should be displayed.
- Campaigns
List of campaigns that can be selected for reports
- Members
Members that can be selected.
- Advanced options:
Call duration
Filter the reports based on the call duration in seconds.
For example, choose the button on the left of this section that says « Less than/Greater than », then set the call duration in seconds for which you want to see a report.
For example, click Greater than and choose 60 seconds. All calls with a duration greater than 60 seconds will be displayed in the report(s) you want to generate.
Retention period
Filter the reports based on the hold duration in seconds.
For example, choose the button on the left of this section that says « Less than/Greater than », then set the retention duration in seconds for which you want to see a report.
Lead
Enter the lead number if you want to generate one or more reports.
Time format
Select the time format for the reports.
- Select the gender
Type of reports to generate. (For example, campaign, agent, summary)
- Reports panel
You can see a list of all available report templates and choose the one you prefer accordingly. Please refer to the more detailed description for more details.
- Search
Enter a specific report title and get information faster.
- Selected reports
A table where all selected reports are displayed.
(For example, click the Show button to generate statistics for all displayed reports)
NOTE: By clicking on the Show button, you will be prompted to access the Reports page and, in the upper left corner, you will be able to get more details about the preferred report. If you hover your mouse over the Start date and End date lines displayed, you can see when the report was last generated. “Generated at” depends on the system time. The other lines are modified according to the chosen report template.
- Show statistics for all abandoned call rates
Displays the number and percentage of abandoned calls.
- Show statistics for all agent calls
Displays a detailed report on the agent's outbound calls. The data is grouped by agent.
- Show statistics for all answered calls
Displays summary information about all answered outbound calls. Includes all answered call dispositions where we can see how the call ended (agent hangups, caller hangups, transfer).
- Show statistics for all calls
Displays summary information about all outbound calls. Includes all call dispositions, which indicate the total number of answered and unanswered calls.
- Show statistics for all unanswered calls
Displays summary information about all unanswered outbound calls. Includes all unanswered call dispositions for which we can see the reason for no answer (abandoned, machine, busy, no answer, cancel).
- Show campaign statistics for all calls
Displays summary information about the campaign and all calls, including talk time, wait time and ring time. The data is grouped by campaign.
- Show campaign call statistics by disposition
Displays the number of campaign calls by disposition. The data is grouped by campaign. For each campaign, the information is further grouped by disposition. Here you can see how calls are distributed by campaign and by disposition.
- Show statistics for all lead calls
Displays summary information about main calls, which includes the number of answered calls and the number of unanswered calls separated by reason for no answer (machine, no answer, busy, no route, abandoned, dial failure).
Scheduled reports

Scheduled reports are an extension of the Agent, Queue and Dialer reports. Users can select a specific type of report template when creating scheduled reports. Users can create queue, agent and dialer report templates. Each report template has different filters that can be applied during editing.
- Search for scheduled reports
Search for already created scheduled reports by their name.
Press the «plus» sign to display additional data on the particular report. For more information, please refer to the screenshot.
- Name
Displays the name of a specific scheduled report.
- Type
Displays the selected report type.
NOTE: Users can select one of the following report types: “Queue”, “Agent” or “Dialer”.
- Last turn
Displays the last time a scheduled report was run.
- Last sent
The last time a scheduled report was sent to a user's email is displayed.
- Active
Indicates whether the scheduled report is active.
- Last status
Displays the success status.
Click the “View” button to display additional information about the report. Users will be prompted to access the page displaying information based on the chosen report type.
(For example, if a user chooses the type "Agent" for a scheduled report and clicks this icon, they will then be prompted to open the "Agent Statistics" window.)
NOTE: In some cases, after modifying the existing configuration of a previously created scheduled report and clicking the "Show" button, the error message the following may appear: « ERR: one of the reports was added to the scheduled report. However, the report and its data are missing. To avoid displaying the error message, check whether « Scheduled reports » is waiting for the scheduled time set to run, or click « Save and run ». Exiting…” . For more information, please refer to the screenshot.
Please note that when you edit the configuration of a scheduled report and click the “Save” button, the report and its data may be missing because the “Scheduled Report” is waiting for the defined time to run. Please check the settings in the “Repeat” field or click “Save and Run” to prevent this error message from appearing.
Report type
By clicking on the button Add a report, users will open a new window in which they can select the type of scheduled report.
- Report type
Select a scheduled report type from the drop-down list.
Add/edit
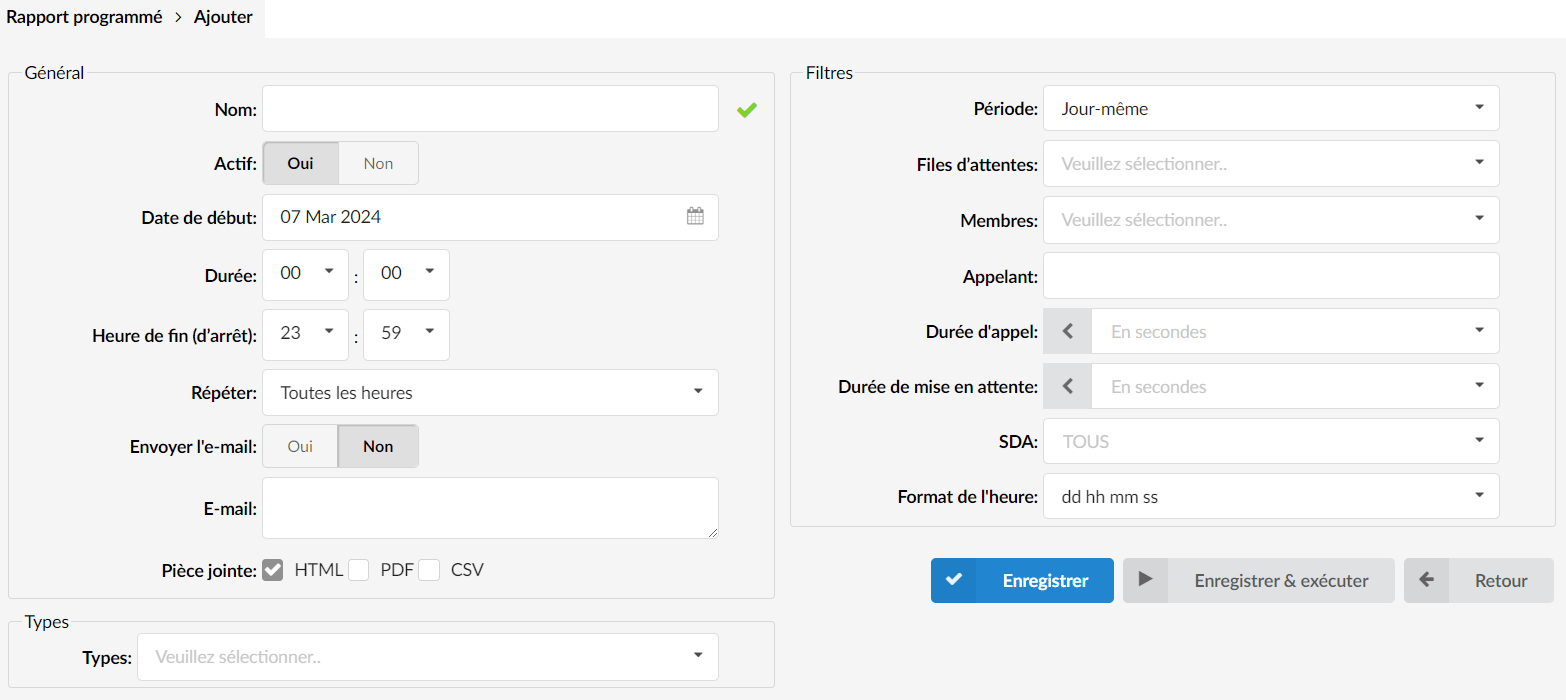
Add/Edit a report
General
- Name
Enter the name of the scheduled report.
- Active
Select the activity status of this specific scheduled report.
- Start date
Specify the start date for running this scheduled report by choosing the date from the drop-down calendar.
- Duration
Define a start time for a scheduled report using the time picker.
- Downtime
Define a stop time for the scheduled report using the time picker.
- Repeat
Select an interval for running the scheduled reports.
- Send an email
Select whether or not an email will be sent for this scheduled report.

Enter one or more email addresses to which the reports will be sent.
NOTE: The correct way to enter multiple emails is to use ” ; ” as the separator or ” , ” and a space as the separator.
(For example, emailOne@example.com ; emailTwo@example.com )
(For example, emailOne@example.com , emailTwo@example.com )
- Attachment
Select a file type to attach to an email.
(For example, HTML/PDF/CSV)
(checkbox)
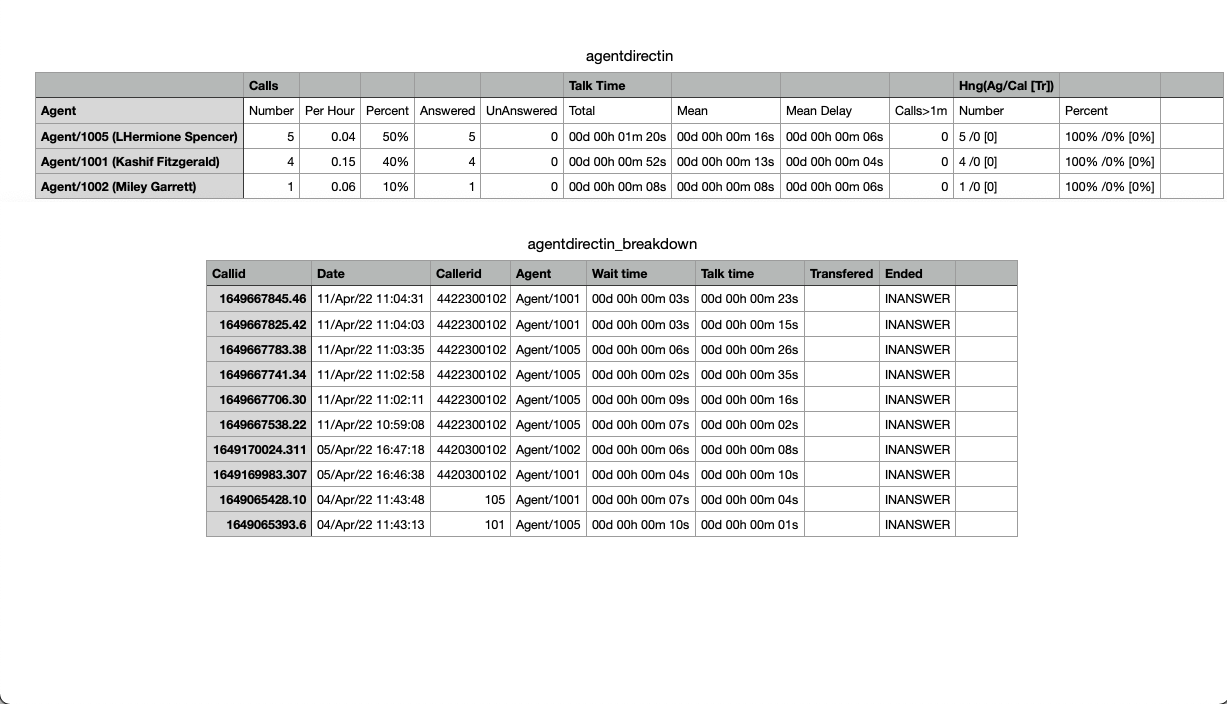
If the user selects a CSV file type to attach, another CSV file will be created automatically. These files will be compressed and sent by email. The scheduled report type + ‘_breakdown’ will be the name of the new CSV file and will contain additional information about the selected report.
(For example, if the user selects the type "Direct agent in calls" for the report, the compressed folder will contain two CSV files, agentdirectin.csv and agentdirectin_breakdown.CSV ).
NOTE: Be aware that some scheduling reports share the same type of information. The breakdowns of these reports will therefore be the same.
Types
- Types
Select the call types to record.
Filters
The configuration will change depending on the type of report (Queue/Agent/Dialer) selected.
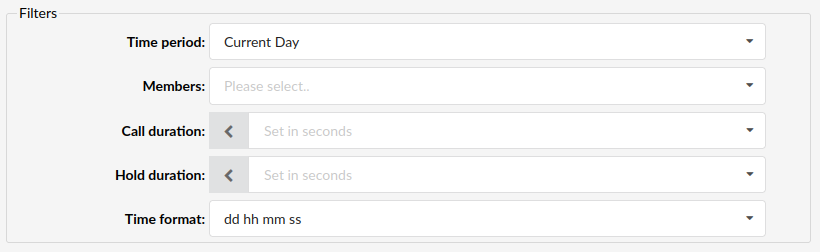
Filters for agent reports
- Time period
Select a period for which a report will be filtered.
(For example, current day/current week/current month/current year/last day/last week/last month/last year)
- Members
Set the members for which a report will be filtered.
- Call duration
Filter the calls for the scheduled report by call duration (in seconds).
- Retention period
Filter the calls for the scheduled report by wait duration (in seconds).
- Time format
Users can set the time format to apply to the filters.
Filters for queue reports
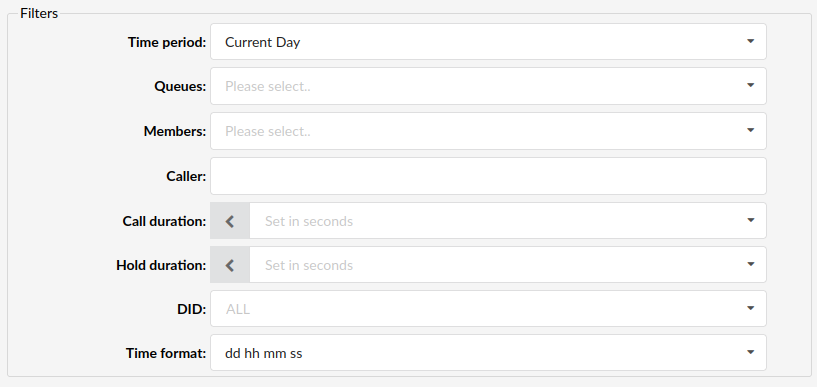
The “Filters” section for the queue reports contains three additional fields: “Queue”, “Caller”, and “DID”.
- Queues
Define a queue for which the report will be filtered.
- Caller
Filter by caller.
- DID
Filter the calls for a scheduled report by selecting the DIDs.
NOTE: Calls per DID are all filtered by default.
- Filters for dialer reports
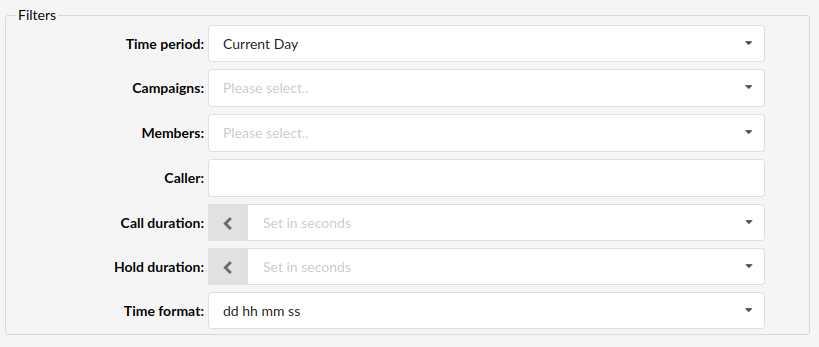
The “Filters” section for the dialer reports contains one additional field: “Campaigns”.
- Campaign
Define a campaign for which the report will be filtered.
 Click the “Save” button to save the changes made to the scheduled report or to keep it as a new scheduled report that is not yet running.
 Click this button to save a report and run it instantly.
 Click this button to return to the previous page where the list of already saved scheduled reports is located.
Settings
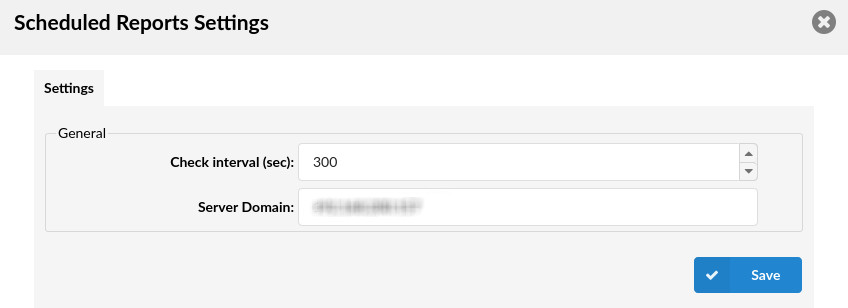
- Check interval (sec)
Set how frequently to check the queue statistics that will be included in the report.
- Server domain
Set the server domain.
NOTE: This field is filled in by default.
